Best Airbnb Markets in New South Wales, Australia
To succeed as an Airbnb investor in New South Wales, Australia, you need to know which areas are actually delivering results. We’ve benchmarked the top 10 locations to show you which neighborhoods are standing out in today’s rental economy.
These market-wide averages provide a great starting point, but they don't tell the whole story for every home. For advanced tools, property-specific performance, and real-time market tracking, use GuestFavorites.
New South Wales Airbnb Market Map (May 2026)
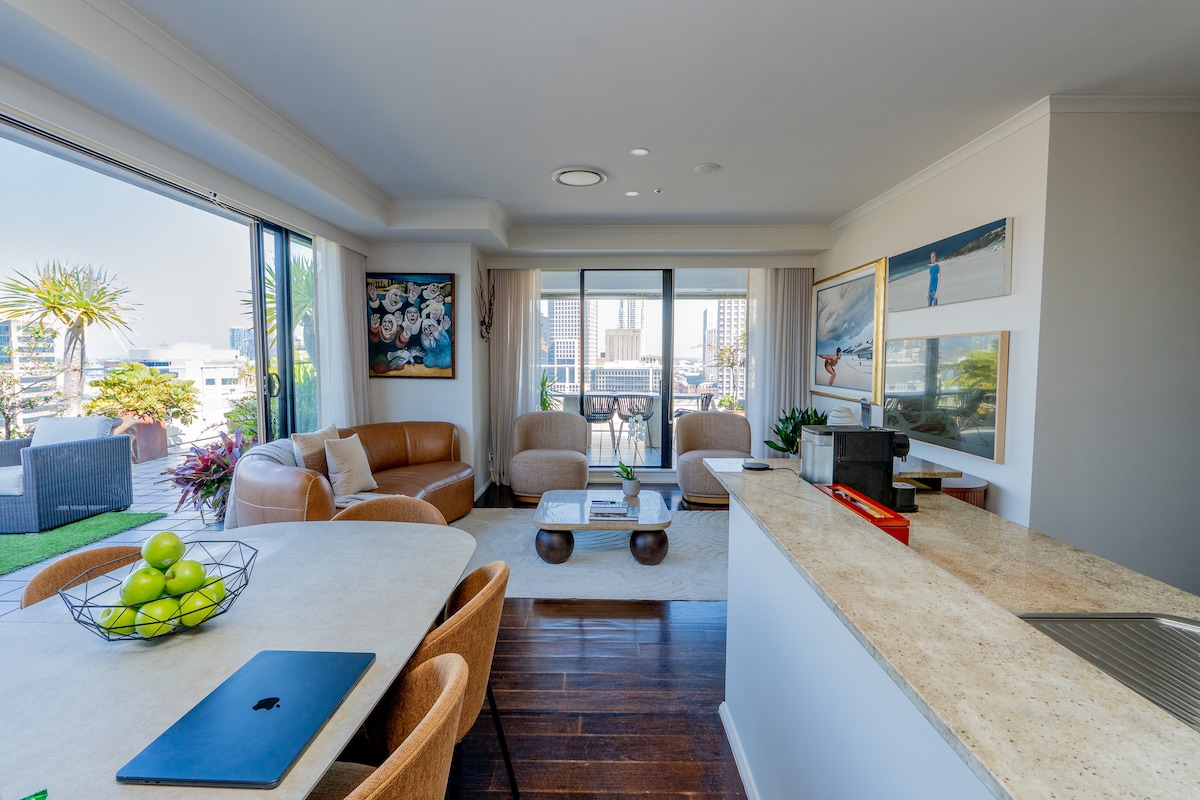
Sydney is Australia’s global icon, world-famous for its stunning harbor, the Opera House, and incredible city beaches like Bondi. As a premier international destination, it attracts a massive and diverse mix of business and leisure travelers throughout the year. The Airbnb market is incredibly vast, with over 12,000 listings and a strong occupancy rate of 66%. Visitors seek everything from luxury urban apartments in the CBD to character homes in trendy eastern suburbs, providing hosts with a substantial annual revenue of A$82,451. Its status as a world city ensures constant demand and a highly dynamic environment for short-term rentals.
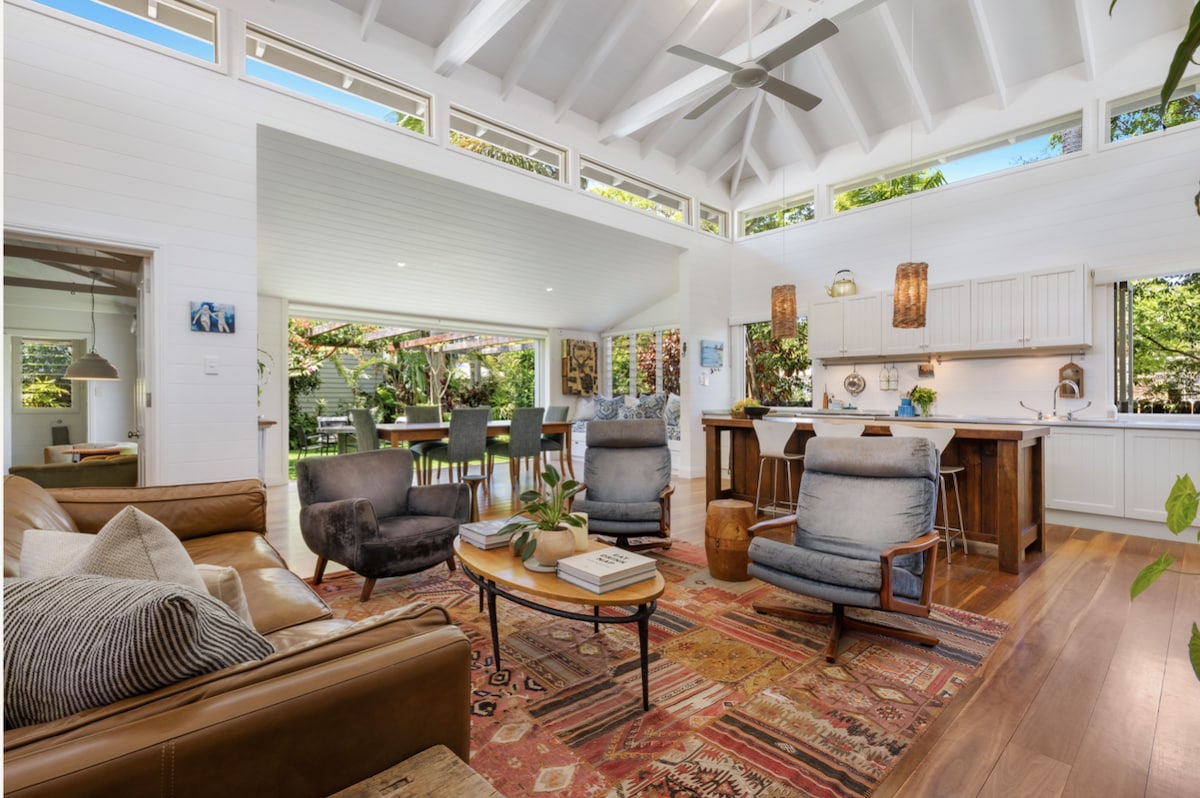
Featured Listings
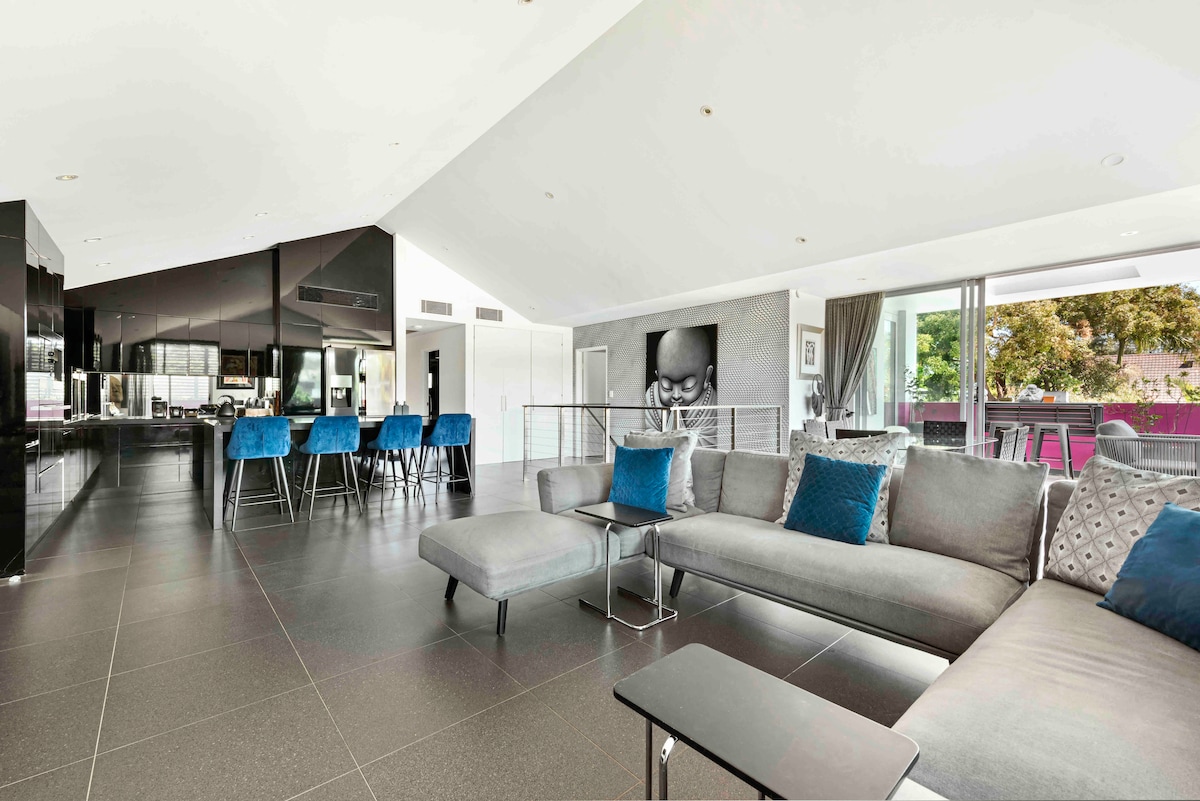
Byron Bay is an international icon, famous for its world-class surfing, bohemian spirit, and stunning natural beauty at Australia’s easternmost point. As a premium lifestyle destination, it attracts a diverse mix of celebrities, backpackers, and families. The vacation rental market is one of the most lucrative in the country, featuring an average daily rate of A$658. Visitors seek everything from luxury architectural estates to quirky beach shacks, driving a massive annual revenue of A$138,631. Despite high demand, its unique charm and “Byron vibe” ensure it remains a top-tier, high-yielding market for hosts.
Featured Listings
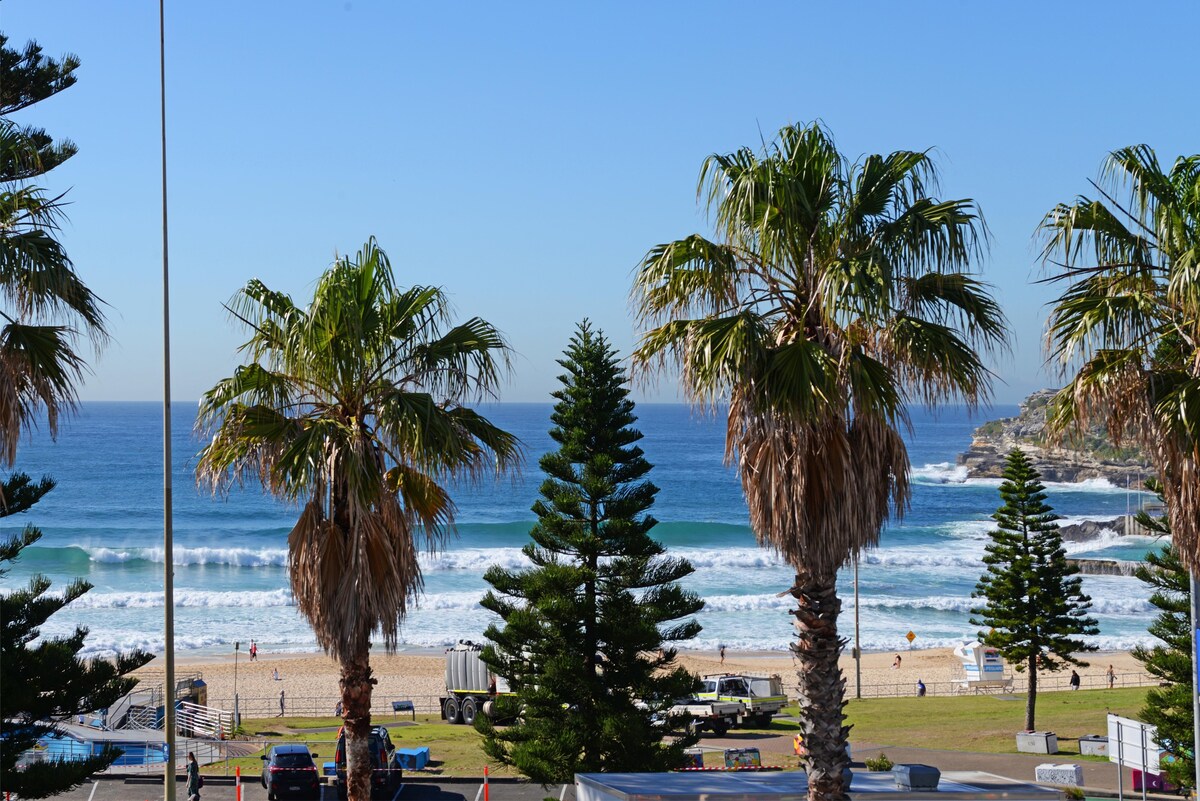
Coffs Harbour is a beloved coastal destination on the Mid North Coast, famous for its Big Banana icon, stunning beaches, and the beautiful Solitary Islands Marine Park. It’s a premier family holiday spot that blends a relaxed coastal vibe with excellent urban amenities. The vacation rental market is robust, featuring an occupancy rate of 52%. Travelers favor well-located holiday apartments and family homes near the jetty and Park Beach, resulting in a steady annual revenue of A$64,283. Its central location between Sydney and Brisbane and its year-round outdoor appeal ensure a stable and reliable rental market.
Featured Listings
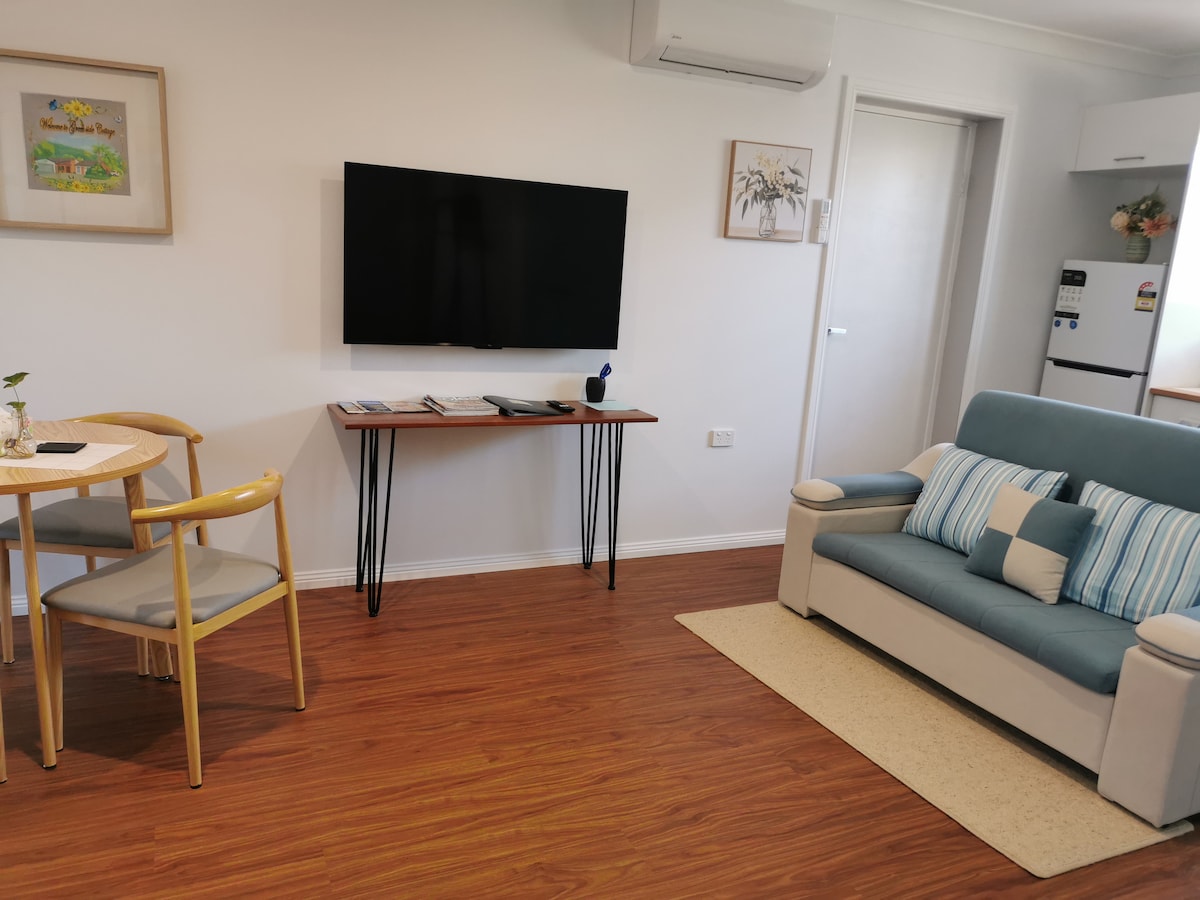
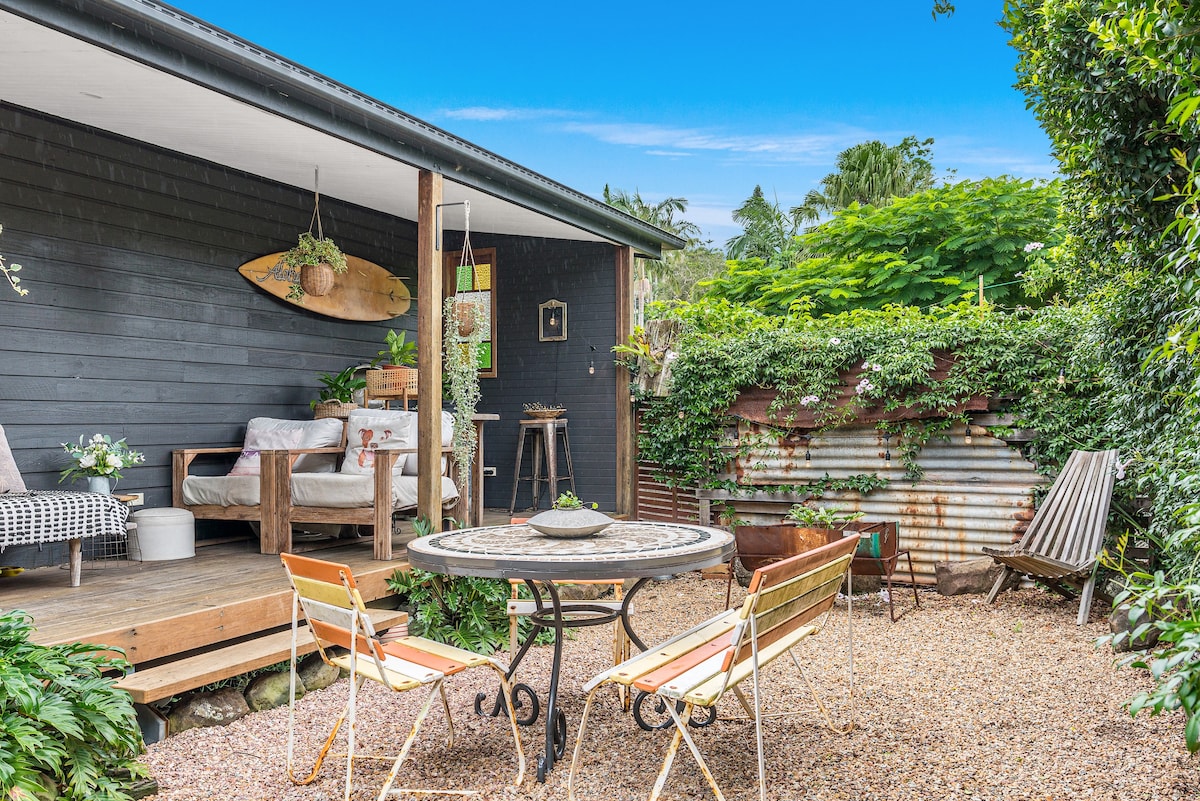
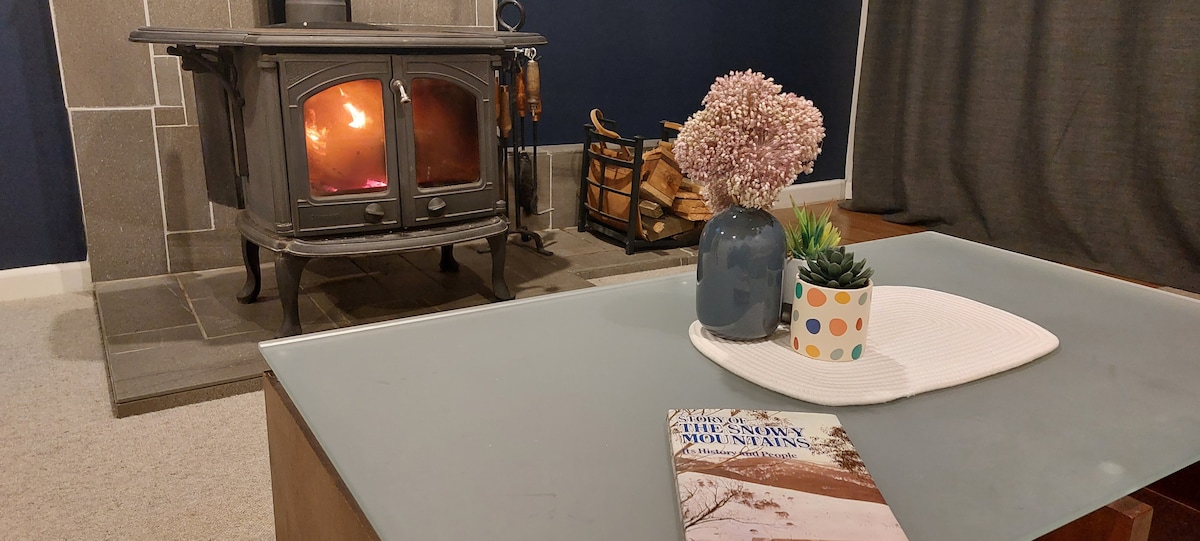
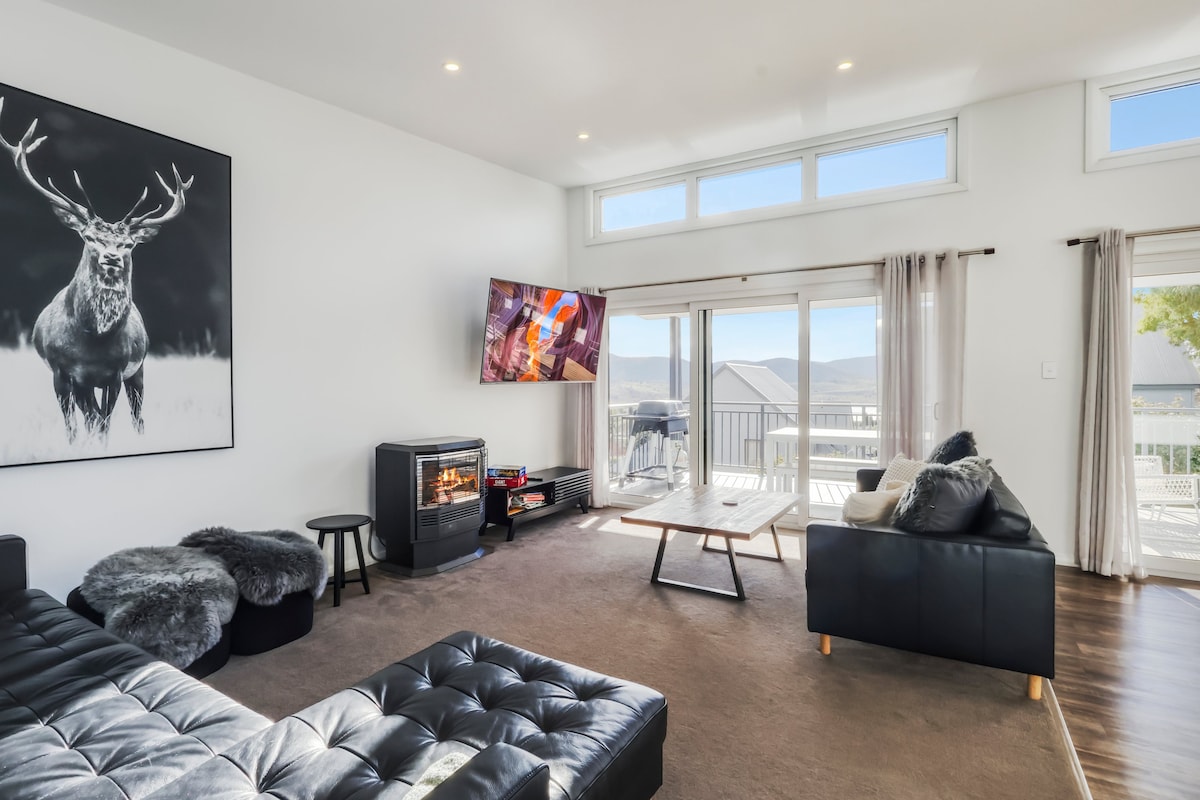
Jindabyne is the essential gateway to the Snowy Mountains, serving as the primary base for skiers and snowboarders heading to Perisher and Thredbo. It’s a dynamic dual-season market that thrives in winter for snow sports and in summer for fishing, hiking, and mountain biking on Lake Jindabyne. The short-term rental market is very strong, with an average daily rate of A$525. Travelers seek spacious lodges for groups and cozy apartments with lake views, resulting in an annual revenue of A$84,785. Its strategic location and massive seasonal peaks ensure high demand and excellent returns for property owners.
Featured Listings

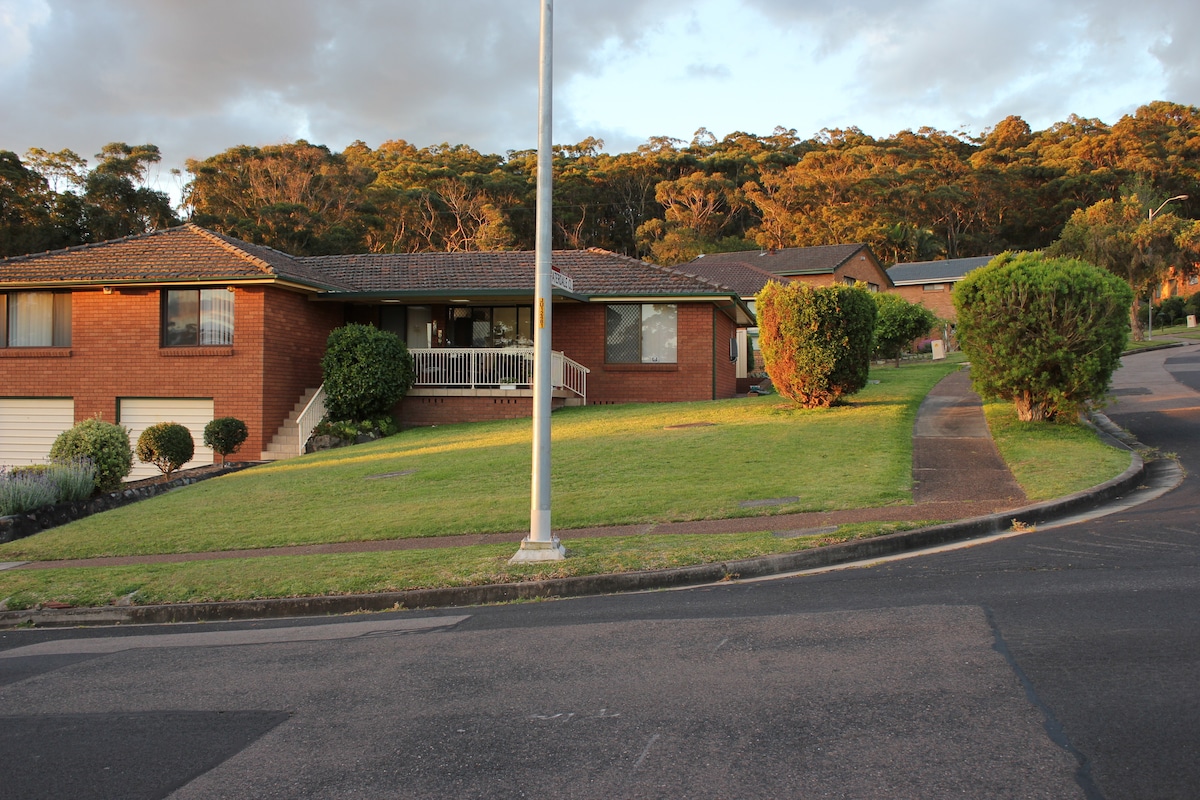
Newcastle is Australia’s second-oldest city, a vibrant coastal hub that has successfully transitioned from an industrial past to a trendy destination known for its world-class surf beaches and thriving dining scene. It attracts a mix of business travelers and tourists seeking a sophisticated yet relaxed urban escape. The Airbnb market is robust, featuring an occupancy rate of 61%. Visitors favor renovated character homes and modern apartments near the harbor and beaches, generating a strong annual revenue of A$69,817. Its consistent events calendar and growing reputation as a cultural hub ensure steady demand year-round.
Featured Listings
Pokolbin is the heart of the Hunter Valley wine country, famous for its world-class vineyards, gourmet dining, and spectacular golf courses. It’s a premier weekend destination for travelers seeking a sophisticated escape from Sydney. The short-term rental market is exceptionally high-yielding, featuring an average daily rate of A$733. Visitors seek luxury vineyard estates and charming cottages, driving a massive annual revenue of A$103,670. Its constant stream of weddings, concerts, and wine festivals ensures consistent demand and premium pricing, making it a top-tier market for high-end hosts.
Wollongong is a stunning coastal city located between the Illawarra Escarpment and the Pacific Ocean, offering a unique blend of industrial heritage and spectacular natural beauty. As a major regional center, it attracts a diverse mix of students, business travelers, and families seeking a beachside lifestyle. The vacation rental market is solid, featuring an occupancy rate of 55%. Travelers favor modern city apartments and family homes near North Wollongong Beach, resulting in an annual revenue of A$66,401. Its proximity to Sydney and its wealth of outdoor activities make it a reliable and attractive market for short-term rental hosts.
Featured Listings
Kingscliff is a charming seaside village on the Tweed Coast, offering a relaxed and upscale alternative to the busy Gold Coast. Famous for its long sandy beaches, creek-side activities, and a high-quality dining strip, it’s a favorite for families and couples seeking a quiet getaway. The Airbnb market is high-performing, with an occupancy rate of 60%. Visitors favor modern beach houses and resort-style apartments, generating a strong annual revenue of A$99,673. Its proximity to both the Gold Coast and Byron Bay, combined with its peaceful atmosphere, makes it a highly desirable and stable rental market.
Featured Listings
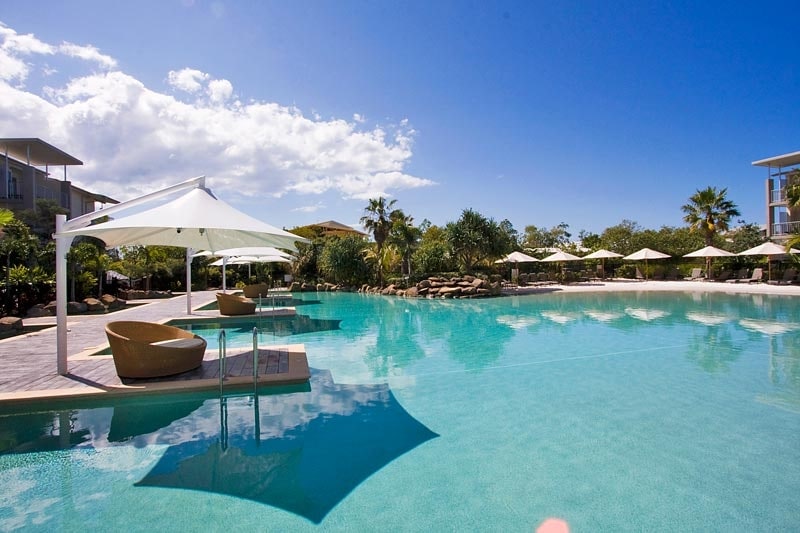
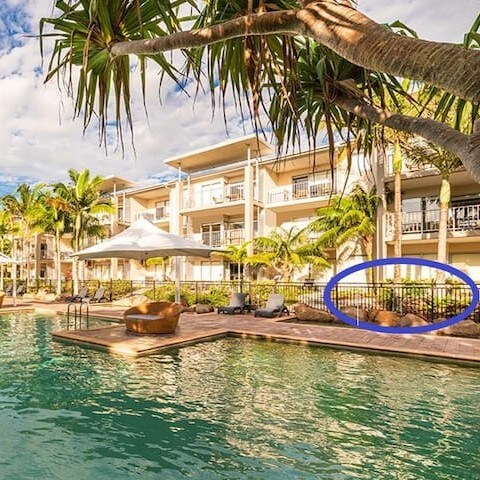
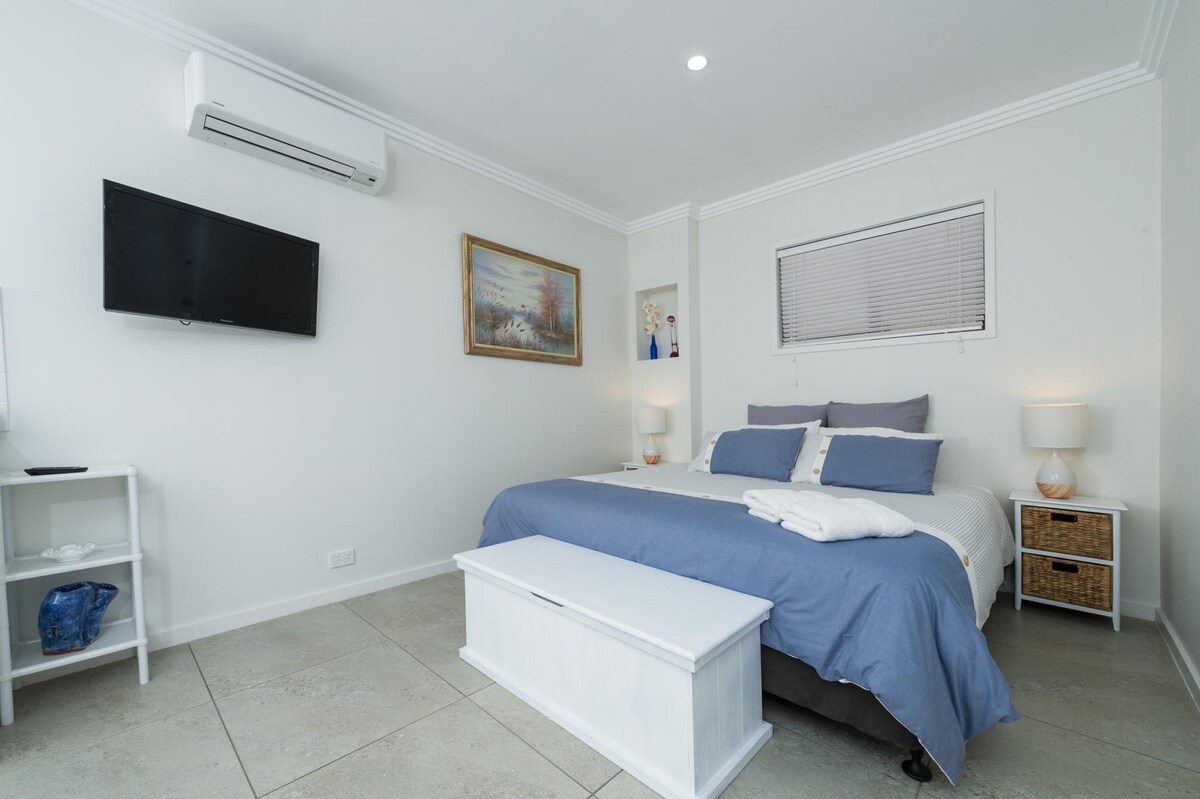
Nelson Bay is the vibrant hub of Port Stephens, known as the ‘dolphin capital of Australia’ and famous for its stunning blue waters and massive sand dunes. It’s a premier family holiday destination offering everything from whale watching to snorkeling and coastal hiking. The vacation rental market is robust, with an occupancy rate of 48%. Travelers favor beachside apartments and spacious holiday homes, resulting in an annual revenue per listing of A$69,119. Its consistent popularity with Sydney-based families and its spectacular natural setting ensure steady demand and reliable returns for hosts.
Featured Listings
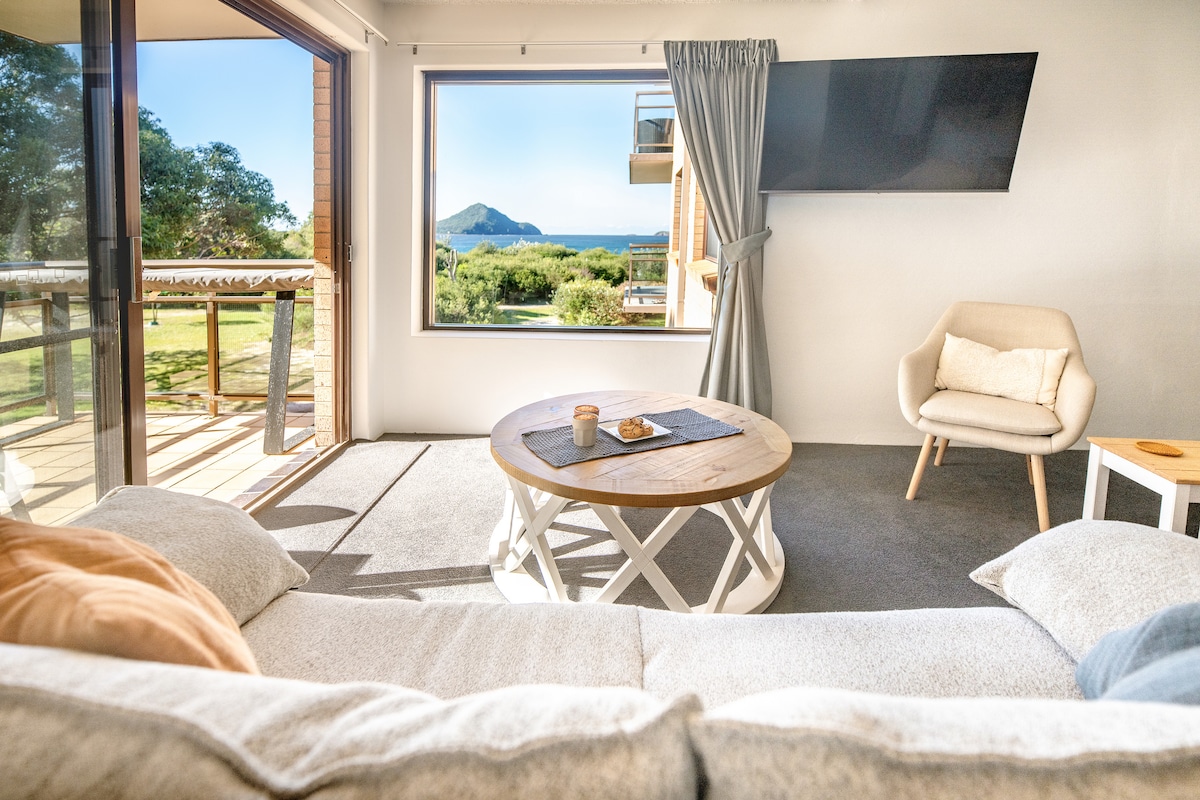
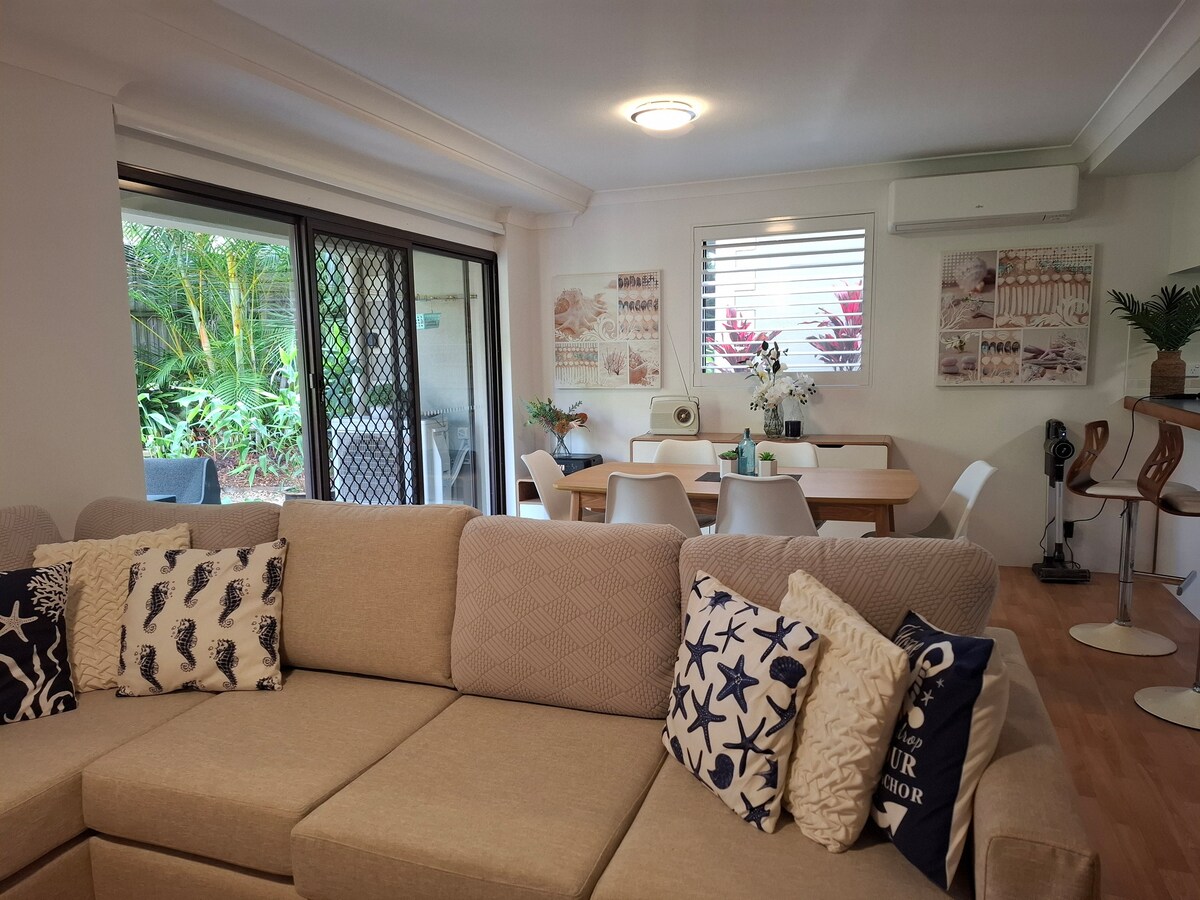
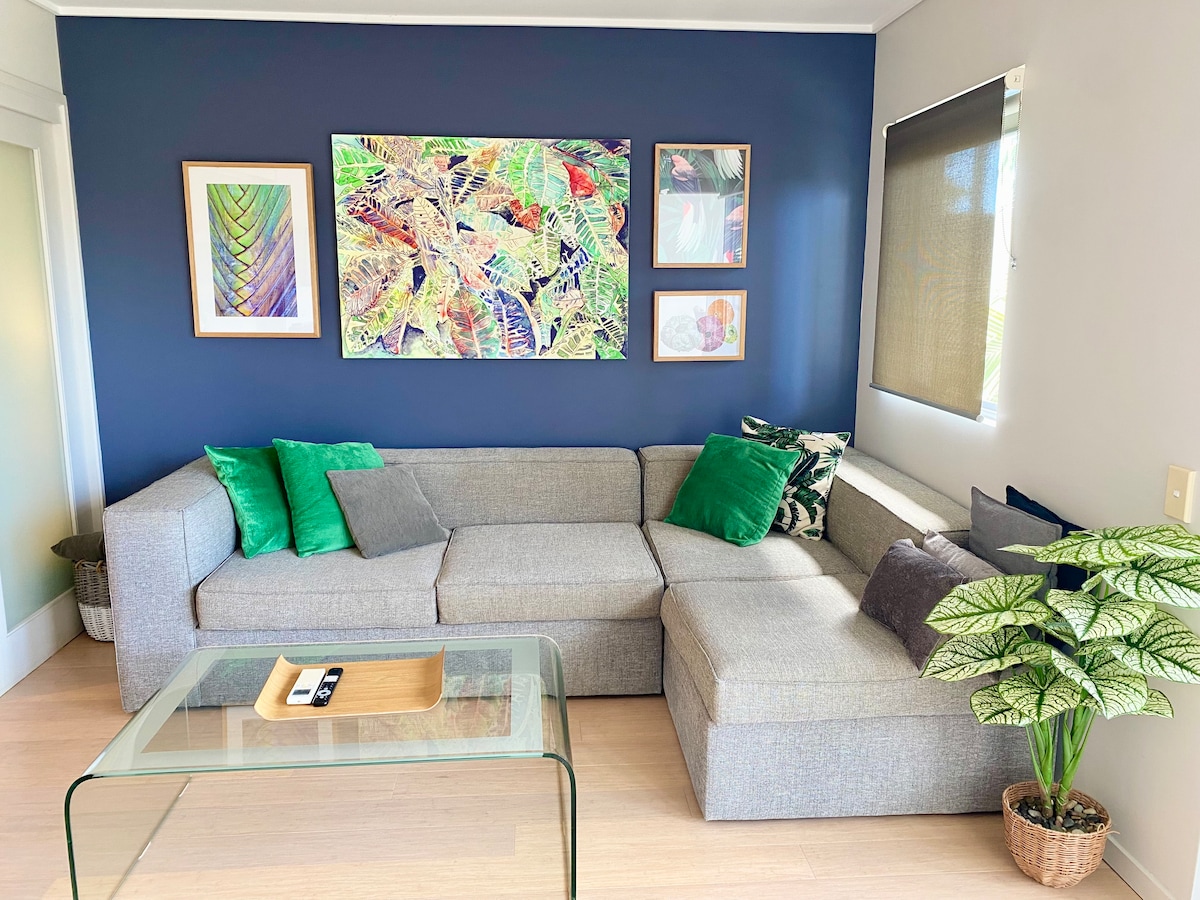
![Top Airbnb: Zen at Nelson Bay [2024 newly renovated] in Nelson Bay](https://a0.muscache.com/im/pictures/miso/Hosting-1283491562939275069/original/e7b7b309-5df6-4d49-8dcc-07a8a711b266.jpeg)
Yamba is the Clarence Valley’s coastal gem, frequently voted as one of Australia’s best towns for its incredible surf, fresh seafood, and unhurried pace of life. It offers a nostalgic and authentic beach holiday experience that is increasingly rare. The short-term rental market is strong, featuring an occupancy rate of 53%. Visitors seek character-filled beach houses and apartments with views of the Clarence River or the ocean, generating an annual revenue of A$74,856. Its reputation as a ‘hidden gem’ ensures a loyal following of domestic travelers and a stable environment for rental investment.
Featured Listings
Get Live New South Wales, Australia Market Intelligence
Discover detailed New South Wales, Australia Airbnb Analytics and explore real-time market data to make accurate investment decisions.
Explore Real-time Analytics