Airbnb Occupancy Rates in Florianópolis, Santa Catarina(September 2026)
Florianópolis combines island beaches, university life, and southern Brazil summer demand—R$91,914 average revenue, 51% occupancy, R$493 nightly rate, and 20,023 active listings in September 2026.
Investors buy January and February season; strong operators also capture extended holidays and nautical events. The key is aggressive summer pricing and protecting the winter calendar with discounts for digital nomads and families from SC/PR/RS.
Florianópolis Airbnb Market Map (September 2026)
Florianópolis Market Performance
Period: January 2026 - August 2026
Is Airbnb a Good Investment in Florianópolis?
YES — Florianópolis works for hosts who accept marked seasonality and invest in properties near island beaches or well-connected mainland areas.
| Market | Revenue | Occupancy | ADR |
|---|---|---|---|
| Florianópolis | R$91,914 | 51% | R$493 |
| Rio de Janeiro | R$116,401 | 62% | — |
| Balneário Camboriú | R$90,254 | 51% | — |
| São Paulo | R$58,259 | 60% | — |
| Curitiba | R$42,725 | 59% | — |
Trade-offs: summer concentrates most revenue; winter needs active marketing. Post-pandemic competition grew—professional photos and linens are essential baseline to compete.
Get Live Florianópolis Market Intelligence
Discover detailed Florianópolis Airbnb Analytics and explore real-time market data to make accurate investment decisions.
Explore Real-time Analytics
How Often Will Your Airbnb Be Booked in Florianópolis?
View Demand Patterns →Occupancy rates directly impact your revenue potential. Understanding demand patterns helps you set realistic expectations and optimize your availability strategy.
The current average occupancy rate in Florianópolis is 51%, meaning properties are booked for about 186 nights per year. However, occupancy varies significantly based on property quality and management. Here's what you can expect:
Airbnb Occupancy Tiers in Florianópolis
Premium(Top 10%) | High-performing(Top 25%) | Average(Median) | Low-performing(Bottom 25%) |
|---|---|---|---|
| 71% | 38% | 10% | 0% |
*High desirability & optimized availability | *Good market fit & guest satisfaction | *Standard market performance | *Higher vacancy, optimization needed |
Seasonal Occupancy Patterns in Florianópolis
April, March
Highest demand and occupancy rates. Perfect for premium pricing strategies and maximizing revenue. Consider longer minimum stays and higher rates.
June, May
Moderate demand with balanced pricing opportunities. Good for attracting budget-conscious travelers while maintaining reasonable occupancy rates.
December, November
Lower demand requires competitive pricing and creative marketing. Focus on local events, extended stay discounts, and targeting specific traveler segments.
How Much Can You Earn with Airbnb in Florianópolis?
Calculate Earnings →One of the most common questions for potential Airbnb hosts in Florianópolis is about earning potential. Let's break down the revenue patterns and what you can realistically expect to earn.
Monthly Revenue Trends in Florianópolis
Best-in-class Airbnb properties (top 10%) in Florianópolis achieve around R$91,403 annually, while strong performers (top 25%) earn at least R$43,697. Typical properties generate about R$10,625 per year, and entry-level listings (bottom 25%) see earnings near R$0, often with room for optimization. Keep in mind, these are market averages—your actual earnings can be even higher depending on your property's location, bedrooms, guest capacity, and unique amenities.
Want to see how your listing could perform? Create a free account to unlock personalized analytics and explore exclusive insights in our app!
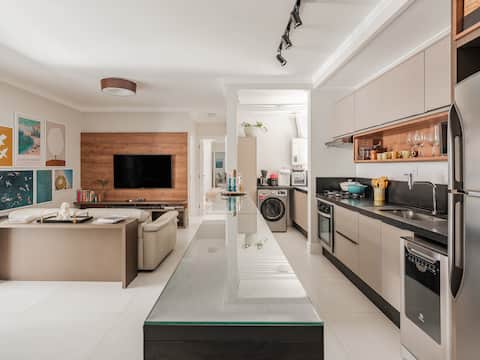
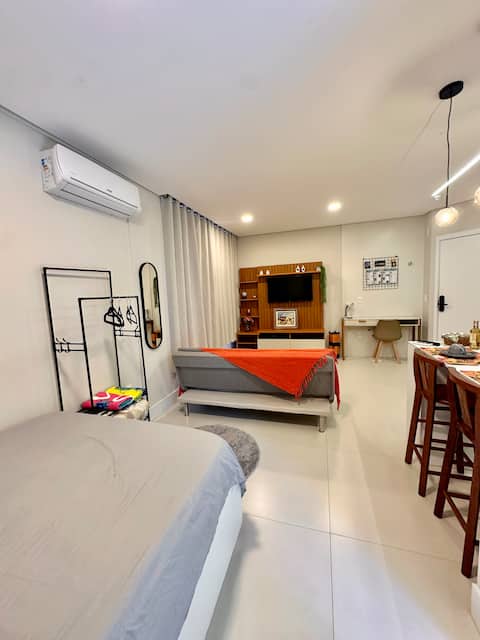
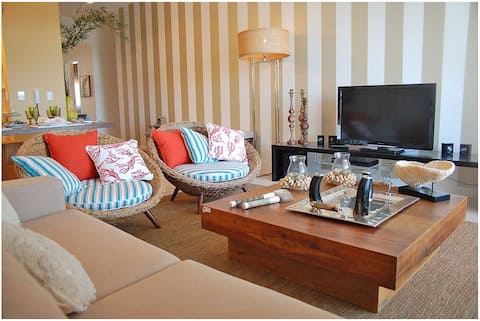
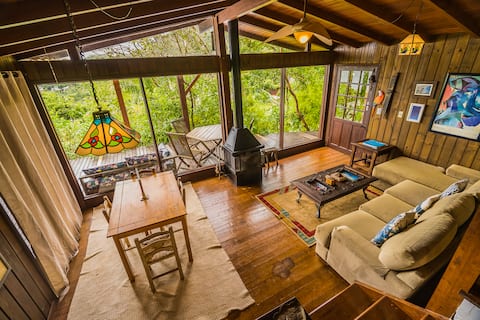
What Can You Learn from Top-Performing Airbnbs in Florianópolis?
View Top Performers →Studying successful properties provides valuable insights for your own Airbnb strategy. Here are the top-performing listings in Florianópolis and what makes them successful.
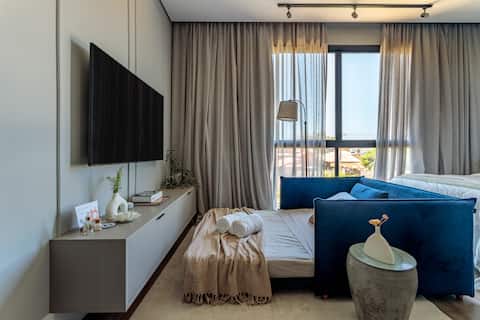
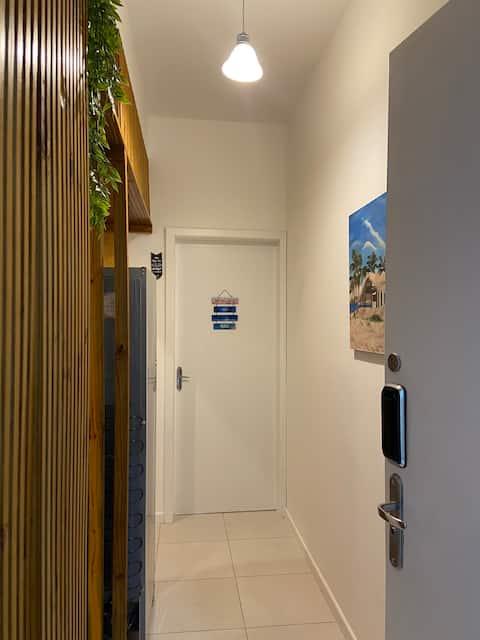
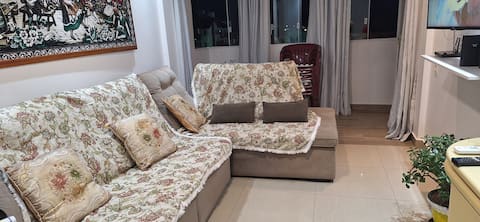
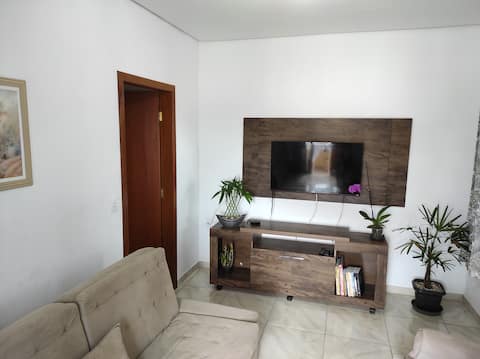
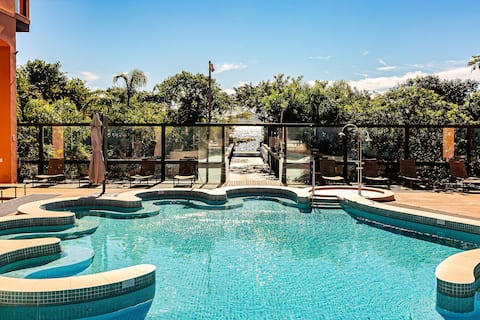
Florianópolis Market Analysis
What the market assumes
Many buyers assume any island apartment generates solid summer revenue. In practice, beach access, parking, and condo rules define who earns five-star reviews.
What the numbers show
With 51% average occupancy and R$493 nightly rate, only well-positioned units—Jurerê, Canasvieiras, Lagoa da Conceição, Campeche—sustain above-median national revenue. High inventory (20,023 listings) demands clear differentiation in title and first photos.
Day-to-day operations
Peak season requires same-day turnover, extra linens, and fast answers about wind, rain, and SC-401 traffic. Off-peak, 7–14 night packages help maintain occupancy.
What Are the Airbnb Regulations in Florianópolis?
Understanding local regulations is crucial for operating a successful Airbnb. Let's examine the compliance landscape and what you need to know about licensing requirements in Florianópolis.
Current Regulatory Status
No properties have proper licensing in this market, indicating minimal regulatory enforcement.
Do I need a permit to list on Airbnb?
Florianópolis is debating municipal short-term rental registries—check the City of Florianópolis and City Council for active bills. Until then, short stays follow the Tenancy Law and condo rules.
What about the condominium?
Assemblies may limit rentals or require guest registration. Read bylaws before buying for investment.
Taxes
Municipal ISS and income reporting (individual or company) depend on revenue volume. Use a local accountant familiar with short-term rentals.
Santa Catarina
State tourism guidance is at SC Turismo. Review changes before scaling multiple units.
What Should You Charge for Your Airbnb in Florianópolis?
Smart Pricing Tools →Pricing is one of the most critical decisions for Airbnb success. Let's analyze the current pricing landscape and help you understand what rates you can realistically charge.
The current average daily rate in Florianópolis is R$493 per night. However, pricing varies significantly based on property quality and location. Here's what different property tiers typically charge:
Airbnb Pricing Tiers in Florianópolis
Premium(Top 10%) | High-performing(Top 25%) | Average(Median) | Budget(Bottom 25%) |
|---|---|---|---|
| R$572per night | R$321per night | R$104per night | R$0per night |
*Top locations, big properties, premium amenities | *Good property management, highly rated | *Standard market performance | *Basic properties, less desirable locations |
Is It Profitable to Start an Airbnb in Florianópolis?
Investment Analysis →Understanding the profitability potential is crucial for any Airbnb investment decision. Let's analyze the revenue performance and profit margins in the Florianópolis market to help you make informed financial decisions.
Revenue Performance
Profitability Factors
Which Areas in Florianópolis Are Most Profitable for Airbnb?
Explore All Areas →Top-performing neighborhoods
- Canasvieiras — R$94,317, 54%, 1,904 listings; island’s largest inventory, Argentine families and peak summer.
- Ingleses Centro — R$99,293, 51%; long beach, condos, and January–March flow.
- Jurerê Leste — R$128,352, 51%; premium ADR, beach clubs, and high-ticket guests.
- Ingleses Norte — R$110,135, 51%; northern stretch with group-friendly apartments.
- Capivari — R$70,682, 47%; quick access to northern beaches and resort-town feel.
North beaches vs Lagoa
Canasvieiras, Jurerê Leste, and Jurerê Oeste (R$193,525, 50%) concentrate summer revenue—price January and February early and invest in parking. Lagoa da Conceição (R$70,555, 54%) and Barra da Lagoa (R$73,781, 51%) capture digital nomads, surf trips, and longer off-peak stays.
Downtown, university, and mainland
Centro (R$62,022, 54%) serves business, ferry access, and short trips; Trindade (R$52,983, 58%) blends university life with beach access. Confirm condo bylaws on short-term rentals—island buildings vary widely by assembly vote.
Airbnb Markets Near Florianópolis
Florianópolis concentrates summer demand on the island, yet northern Santa Catarina’s coast — a few hours north on BR-101 — holds inventory, holiday ADR, and Argentine families comparing Canasvieiras with Balneário Camboriú and Itapema. Hosts who cross-check revenue, occupancy, and listing scale between the island capital and nearby municipalities often find complementary theses: January summer season, family apartments on the mainland, and weekend escapes with guaranteed parking.
| City | Avg revenue | Occupancy | Listings | Demand profile |
|---|---|---|---|---|
| Balneário Camboriú | R$90,254 | 51% | 5,737 | Vertical waterfront, peak summer, large inventory |
| Itapema | R$102,681 | 49% | 3,589 | Families, Meia Praia, January calendar |
| Bombinhas | R$116,432 | 51% | 6,680 | Cove beaches, diving, calmer profile |
| Penha | R$67,532 | 49% | 1,858 | Beto Carrero, families, extended holidays |
| Porto Belo | R$95,330 | 46% | 722 | Marina, boating, upscale summer homes |
| Garopaba | R$91,147 | 42% | 2,355 | South island, surf, Praia do Rosa, longer stays |
| Governador Celso Ramos | R$112,986 | 45% | 2,408 | Preserved beaches, premium residential feel |
Balneário Camboriú and Itapema
Balneário Camboriú and Itapema form the highest-scale axis north of Florianópolis: waterfront towers, large inventory, and demand concentrated in January and holidays. BC supports aggressive ADR on ocean-view units; Itapema captures families who prefer Meia Praia and barbecue-ready apartments. Price summer months early and invest in photos showing real beach distance — competition between the two cities is intense.
Penha, Bombinhas, and Porto Belo
Penha sells theme-park calendar and school-holiday flow; apartments with parking and equipped kitchens convert families from SC, PR, and RS. Bombinhas offers smaller coves and a more residential profile than BC — ideal for hosts who want meaningful inventory with less vertical density. Porto Belo anchors boating demand and higher-ticket summer stays in the region.
South island and surroundings
Garopaba and Governador Celso Ramos complement the island thesis with southern beaches and a calmer profile than Canasvieiras or Jurerê. Surf, 7–14 night stays, and Argentine/Gaúcho guests fill calendars outside the January peak when listings clearly communicate BR-101 access and nighttime quiet.
Explore Other Markets in Brazil
Airbnb Occupancy Rates in Rio De Janeiro, Rio De Janeiro
Rio De Janeiro, Brazil
32,318 Active Listings
Airbnb Occupancy Rates in Cabo Frio, Rio De Janeiro
Macae Rio Das Ostras Cabo Frio, Brazil
9,092 Active Listings