Airbnb Occupancy Rates in Salvador, Bahia(October 2026)
Salvador blends Pelourinho, popular festivals, and urban coastline—R$57,686 average revenue, 52% occupancy, R$306 per night, and 9,139 active listings in October 2026.
Carnival, New Year’s, and religious holidays move bookings months ahead. Off-peak, domestic tourism and business on the waterfront keep moderate flow for hosts who price by season.
Salvador Airbnb Market Map (October 2026)
Salvador Market Performance
Brazil average: 48% occupancy, R$424 per night.
Airbnb occupancy rates by city in BrazilPeriod: January 2026 - September 2026
Is Airbnb a Good Investment in Salvador?
YES — Salvador is attractive for hosts who master the Bahian event calendar and operate with clear safety communication for international guests.
| Market | Revenue | Occupancy | Listings |
|---|---|---|---|
| Salvador | R$57,686 | 52% | 9,139 |
| Fortaleza | R$66,980 | 63% | 3,812 |
| Rio de Janeiro | R$117,185 | 62% | 34,066 |
| Florianópolis | R$89,307 | 51% | 19,194 |
Fortaleza competes for Northeast beach tourism at a different ADR; Rio and Florianópolis capture part of the same summer traveler—compare net yield including condo and cleaning costs.
Get Live Salvador Market Intelligence
Discover detailed Salvador Airbnb Analytics and explore real-time market data to make accurate investment decisions.
Explore Real-time Analytics
How Often Will Your Airbnb Be Booked in Salvador?
View Demand Patterns →Occupancy rates directly impact your revenue potential. Understanding demand patterns helps you set realistic expectations and optimize your availability strategy.
The current average occupancy rate in Salvador is 52%, meaning properties are booked for about 189 nights per year. However, occupancy varies significantly based on property quality and management. Here's what you can expect:
Airbnb Occupancy Tiers in Salvador
Premium(Top 10%) | High-performing(Top 25%) | Average(Median) | Low-performing(Bottom 25%) |
|---|---|---|---|
| 82% | 57% | 13% | 0% |
*High desirability & optimized availability | *Good market fit & guest satisfaction | *Standard market performance | *Higher vacancy, optimization needed |
Seasonal Occupancy Patterns in Salvador
September, August
Highest demand and occupancy rates. Perfect for premium pricing strategies and maximizing revenue. Consider longer minimum stays and higher rates.
February, October
Moderate demand with balanced pricing opportunities. Good for attracting budget-conscious travelers while maintaining reasonable occupancy rates.
December, November
Lower demand requires competitive pricing and creative marketing. Focus on local events, extended stay discounts, and targeting specific traveler segments.
How Much Can You Earn with Airbnb in Salvador?
Calculate Earnings →One of the most common questions for potential Airbnb hosts in Salvador is about earning potential. Let's break down the revenue patterns and what you can realistically expect to earn.
Monthly Revenue Trends in Salvador
Best-in-class Airbnb properties (top 10%) in Salvador achieve around R$74,095 annually, while strong performers (top 25%) earn at least R$43,733. Typical properties generate about R$11,116 per year, and entry-level listings (bottom 25%) see earnings near R$0, often with room for optimization. Keep in mind, these are market averages—your actual earnings can be even higher depending on your property's location, bedrooms, guest capacity, and unique amenities.
Want to see how your listing could perform? Create a free account to unlock personalized analytics and explore exclusive insights in our app!
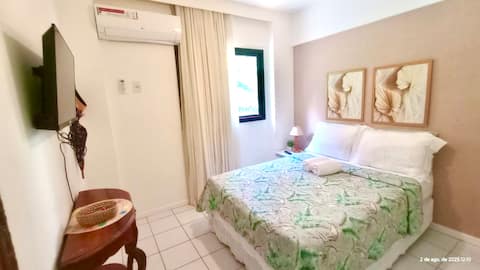
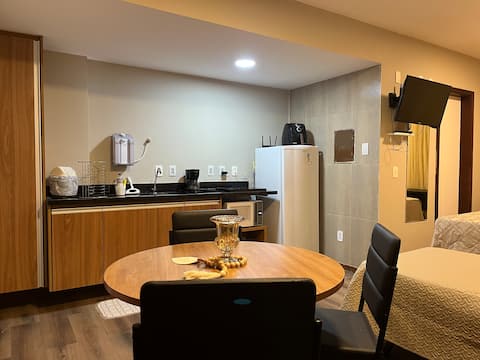
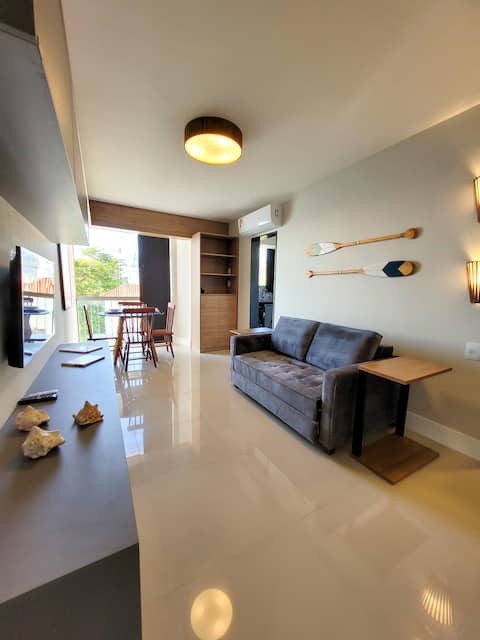
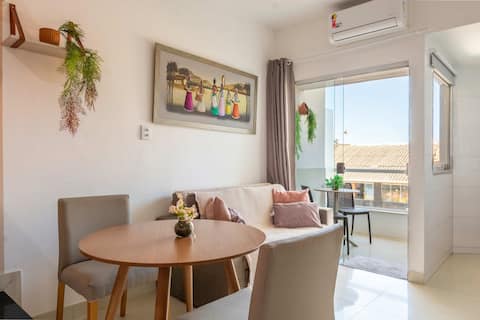
What Can You Learn from Top-Performing Airbnbs in Salvador?
View Top Performers →Studying successful properties provides valuable insights for your own Airbnb strategy. Here are the top-performing listings in Salvador and what makes them successful.
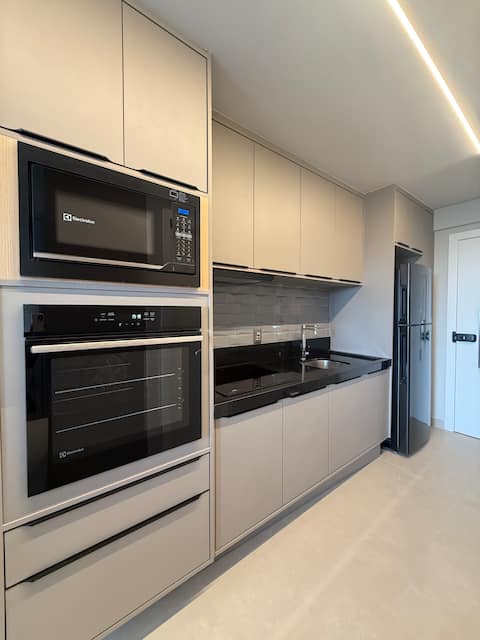
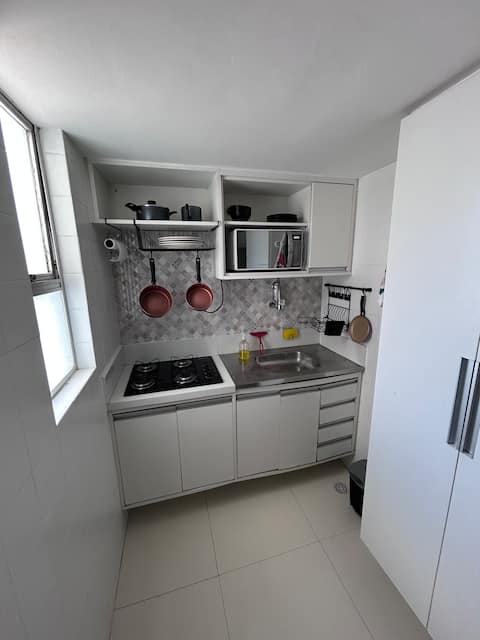
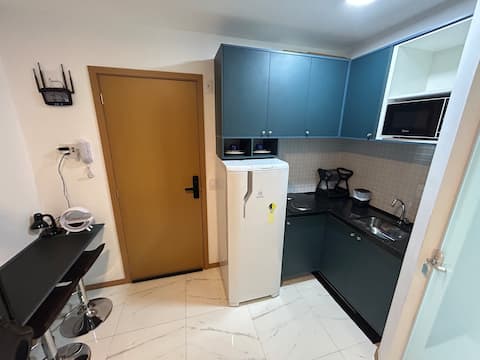
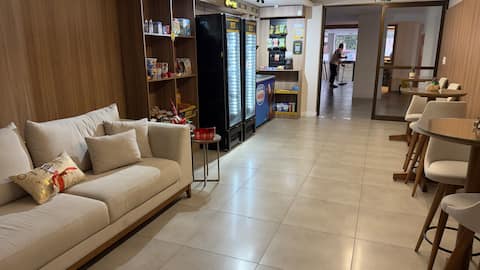
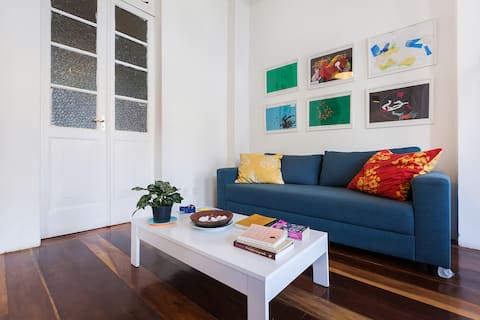
Salvador Market Analysis
Who books Salvador?
Southeast/South Brazilians in summer, Bahians on holidays, international guests in Pelourinho, and executives on the waterfront (Barra, Ondina, Rio Vermelho).
What moves nightly rate?
Ocean view, parking, and powerful AC. Events like Carnival require strict cancellation policy and expanded cleaning crew.
Which property makes sense?
Beachfront apartments for families; studios in the Historic Center for cultural couples. Confirm building rules on parties and music—Pelourinho has constant ambient noise.
What Are the Airbnb Regulations in Salvador?
Understanding local regulations is crucial for operating a successful Airbnb. Let's examine the compliance landscape and what you need to know about licensing requirements in Salvador.
Registration Numbers on Airbnb
None of the active Airbnb listings we tracked last month display a registration or license number.
This reflects what hosts publish on their Airbnb listings, not the local legal requirements. Always confirm them with local authorities.
Note: Salvador is debating short-term rental registries and enforcement—treat compliance as part of operational planning.
City hall
See Salvador City Hall for business registration, ISS, and any tourism registry requirements.
Condominium
Barra and waterfront buildings often have strict visitor rules. Front-desk guest registration is standard.
Federal
Lei 8.245/1991 governs short stays; the Ministry of Tourism guides registries when applicable.
Bahia
Bahia Tourism Secretariat publishes materials for hospitality providers.
What Should You Charge for Your Airbnb in Salvador?
Smart Pricing Tools →Pricing is one of the most critical decisions for Airbnb success. Let's analyze the current pricing landscape and help you understand what rates you can realistically charge.
The current average daily rate in Salvador is R$306 per night. However, pricing varies significantly based on property quality and location. Here's what different property tiers typically charge:
Airbnb Pricing Tiers in Salvador
Premium(Top 10%) | High-performing(Top 25%) | Average(Median) | Budget(Bottom 25%) |
|---|---|---|---|
| R$416per night | R$270per night | R$139per night | R$0per night |
*Top locations, big properties, premium amenities | *Good property management, highly rated | *Standard market performance | *Basic properties, less desirable locations |
Is It Profitable to Start an Airbnb in Salvador?
Investment Analysis →Understanding the profitability potential is crucial for any Airbnb investment decision. Let's analyze the revenue performance and profit margins in the Salvador market to help you make informed financial decisions.
Revenue Performance
Profitability Factors
Which Areas in Salvador Are Most Profitable for Airbnb?
Explore All Areas →Top-performing neighborhoods
- Barra — R$65,271, 55%, 2,041 listings; largest waterfront inventory, families and ocean views.
- Ondina — R$63,699, 47%; continuous coastline with Farol da Barra and steady summer demand.
- Stella Maris — R$68,867, 50%; upscale residential feel and calmer beach.
- Rio Vermelho — R$61,479, 53%; nightlife, dining, and cultural couples.
- Jardim Armação — R$51,620, 55%; southern waterfront with condos and parking.
Premium waterfront vs residential districts
Barra and Ondina capture most international and Southeast Brazil family demand—ADR rises with real ocean view and garage space. Pituba (R$47,562, 51%) and Caminho das Árvores (R$45,167, 54%) serve executives and corporate travel with steadier calendars outside Carnival.
Historic Center and southern coast
The Centro Histórico (R$73,268, 50%) sells culture and Pelourinho—short stays, daytime check-in, and clear communication about noise and perceived safety. Itapuã (R$46,304, 49%) attracts guests seeking a quieter beach farther from the urban core.
Explore Other Markets in Brazil
Airbnb Occupancy Rates in Rio De Janeiro, Rio De Janeiro
Rio De Janeiro, Brazil
34,066 Active Listings
Airbnb Occupancy Rates in Cabo Frio, Rio De Janeiro
Macae Rio Das Ostras Cabo Frio, Brazil
8,864 Active Listings