Best Airbnb Markets in Barcelona, Catalunya
Finding the right investment opportunity in Barcelona, Catalunya starts with accurate, data-driven insights. Our team has evaluated the top 7 markets across the area to pinpoint where demand is strongest and which neighborhoods are truly thriving.
Keep in mind that these figures reflect broad market averages, which serve as an essential starting point for your research. To dive deeper into specific properties, custom filters, and advanced ROI projections, explore the full suite of tools at GuestFavorites.
Barcelona Airbnb Market Map (March 2026)
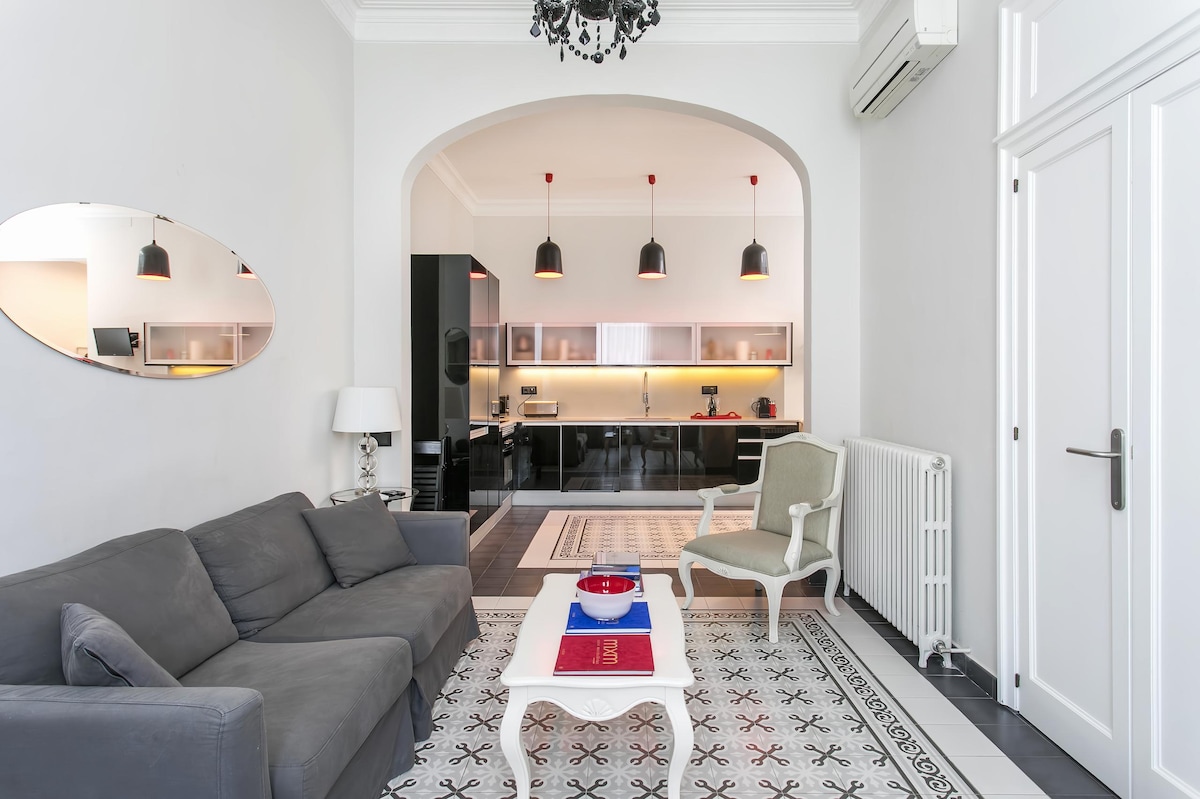
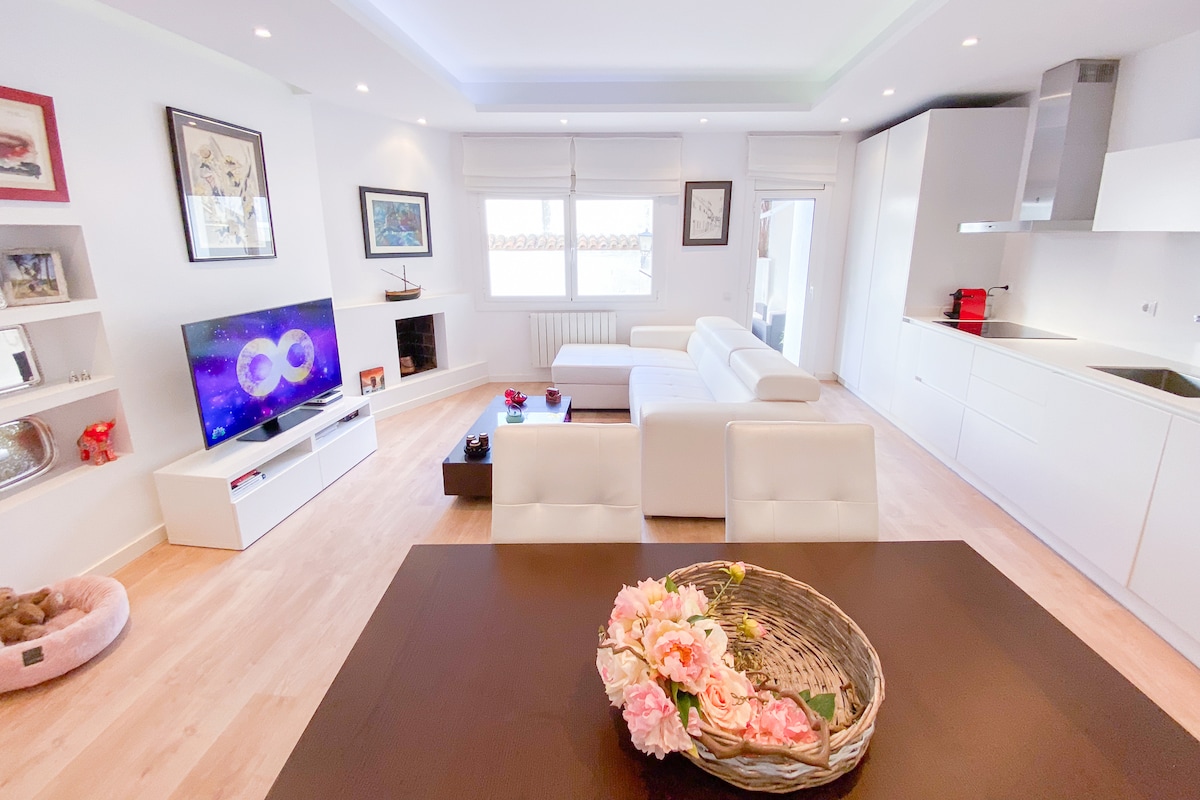
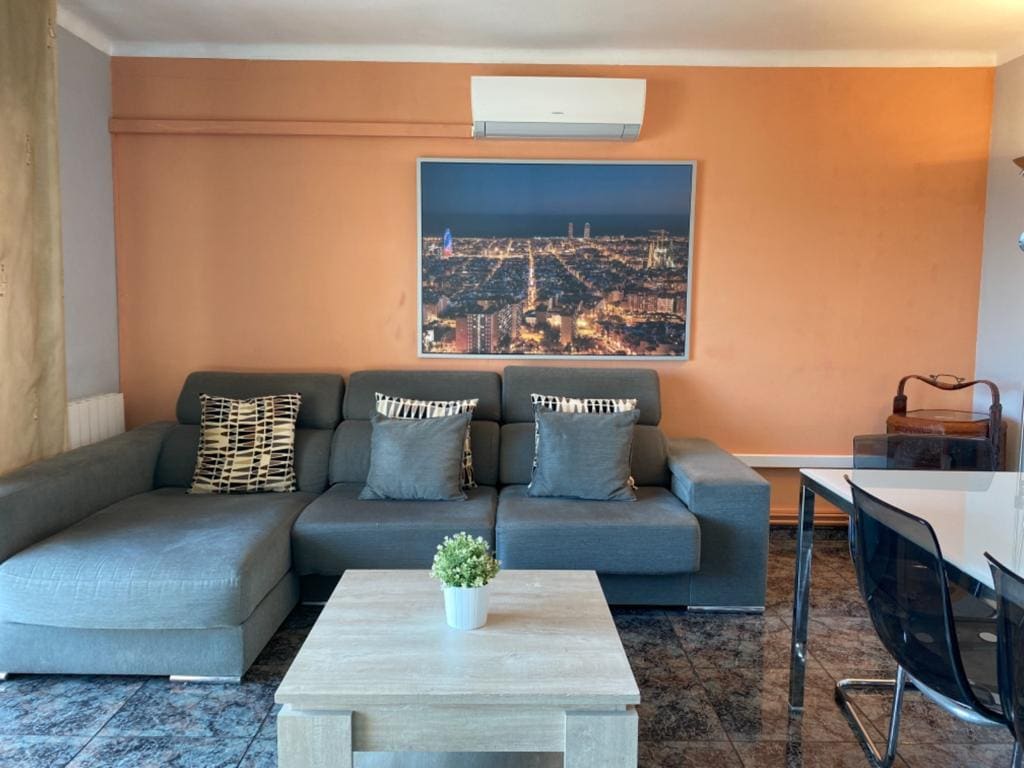
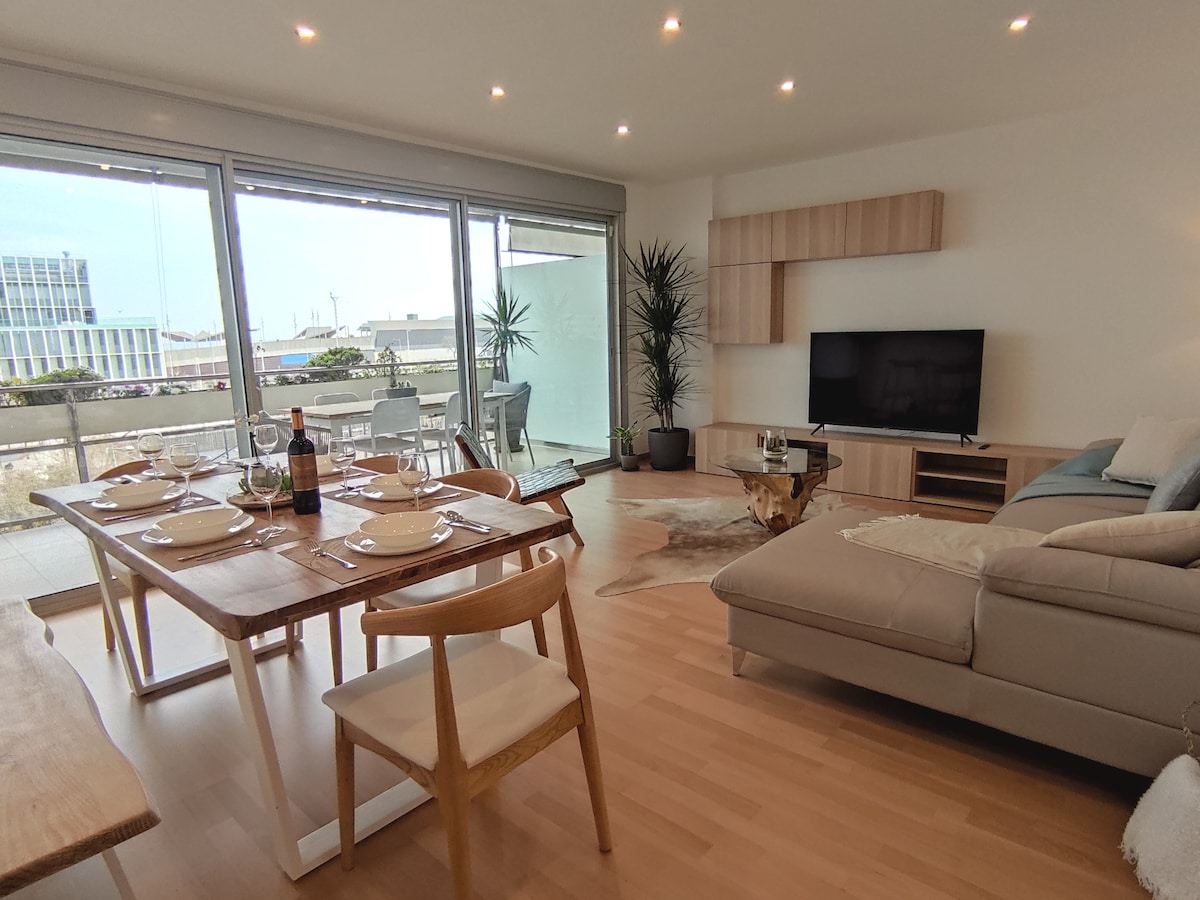
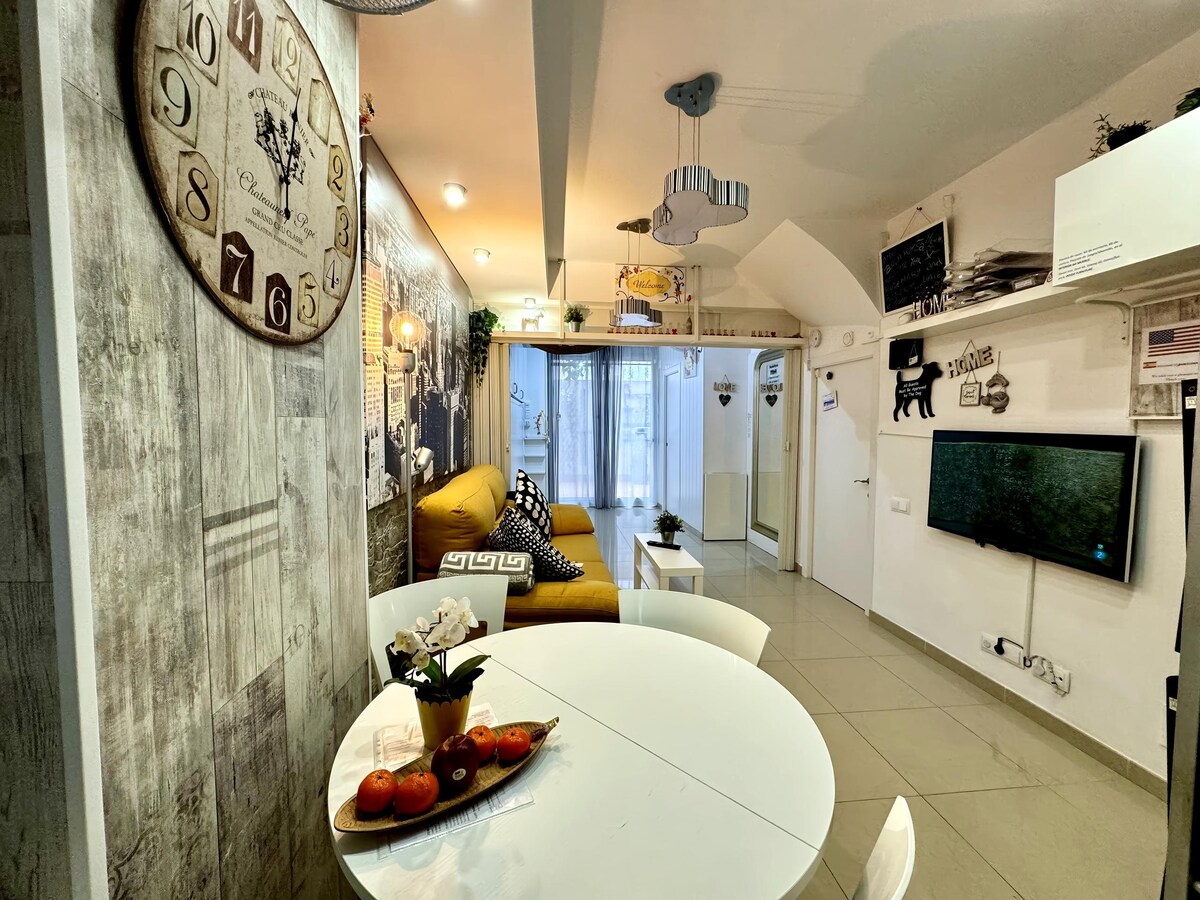
Barcelona is a world-class destination and a global icon of Mediterranean living, famous for its Gaudí architecture, its vibrant Gothic Quarter, and its incredible urban beaches. It is a market with immense appeal, attracting a massive mix of international tourists and business travelers throughout the year. The Airbnb market here is exceptionally strong, featuring an occupancy rate of 76%. Visitors seek the character of renovated historic apartments in Eixample and the functionality of modern homes near the waterfront, generating a remarkable annual revenue of €69,776. Its unique identity and status as a top global tourist hub ensure exceptionally high and steady demand.
Featured Listings
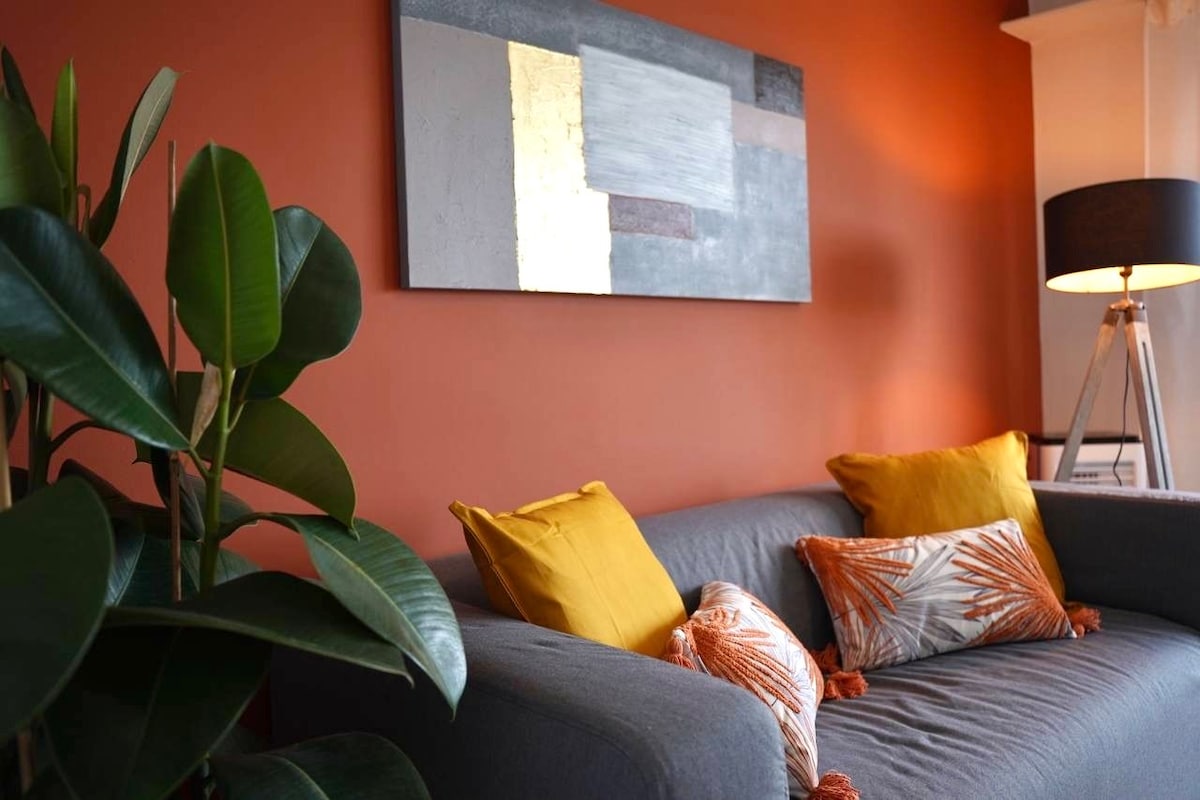
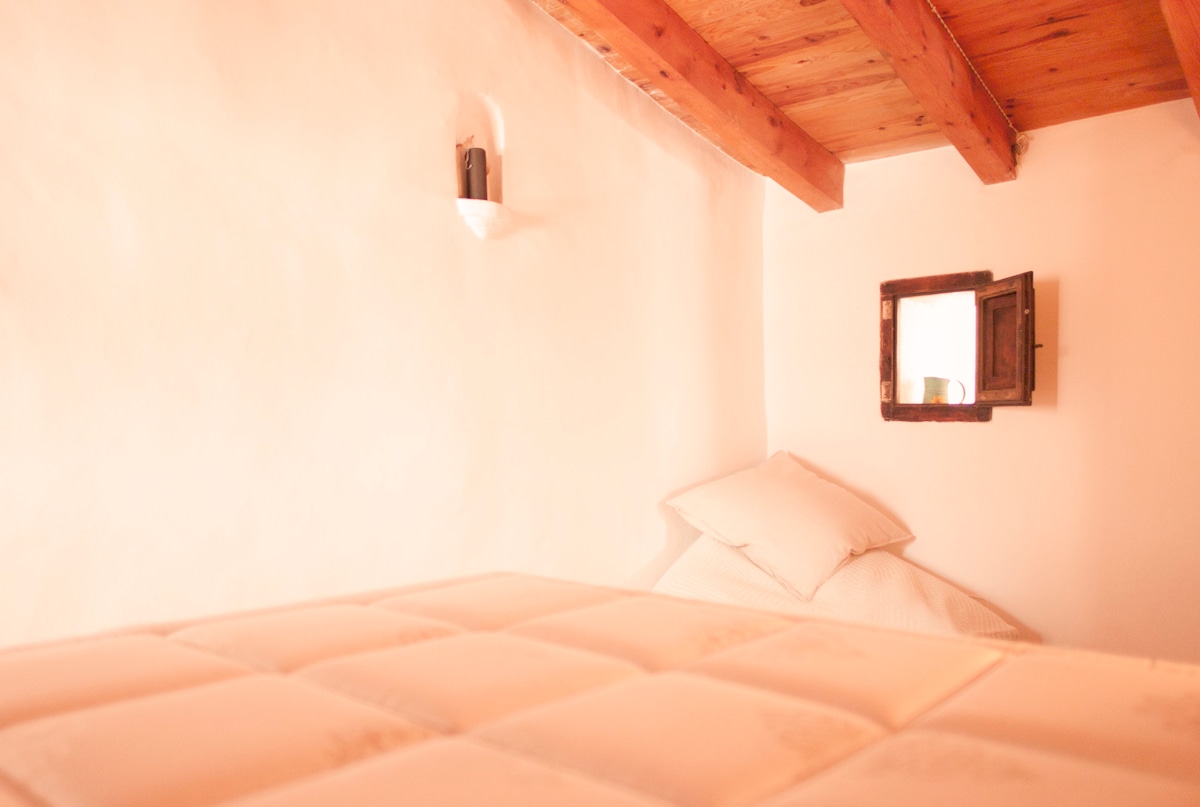
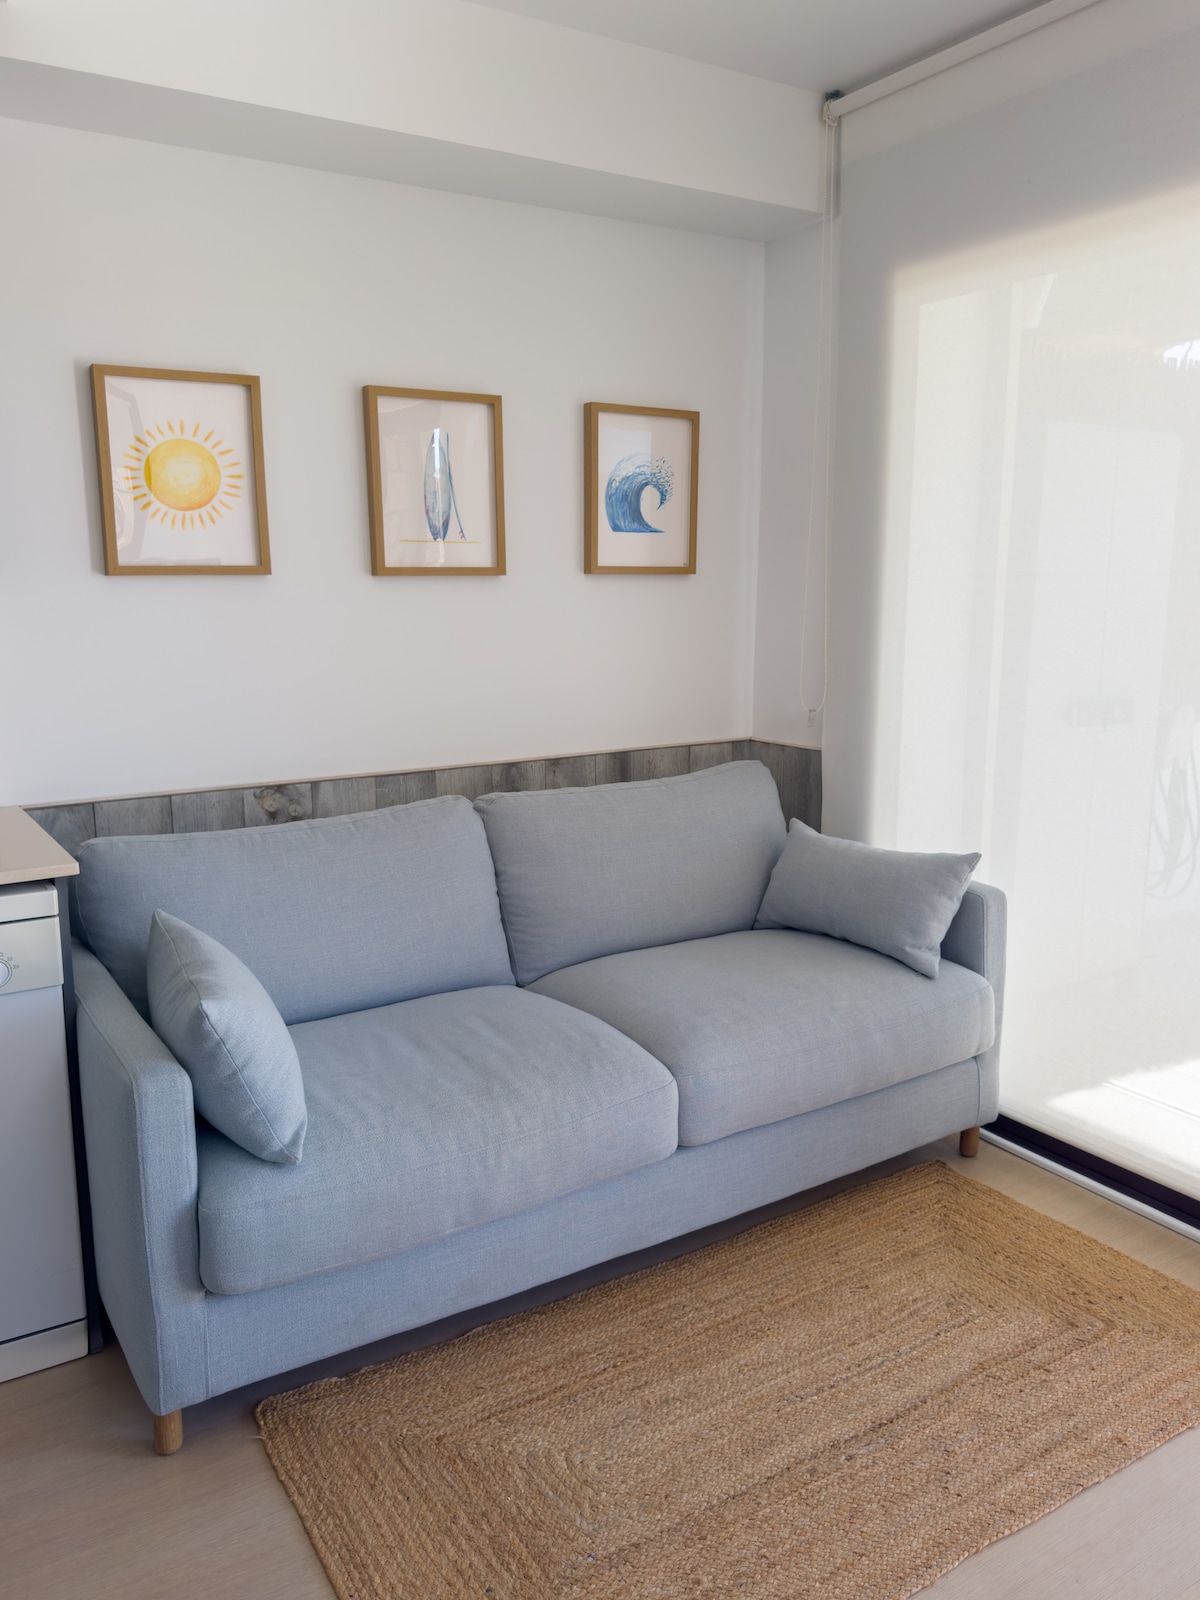
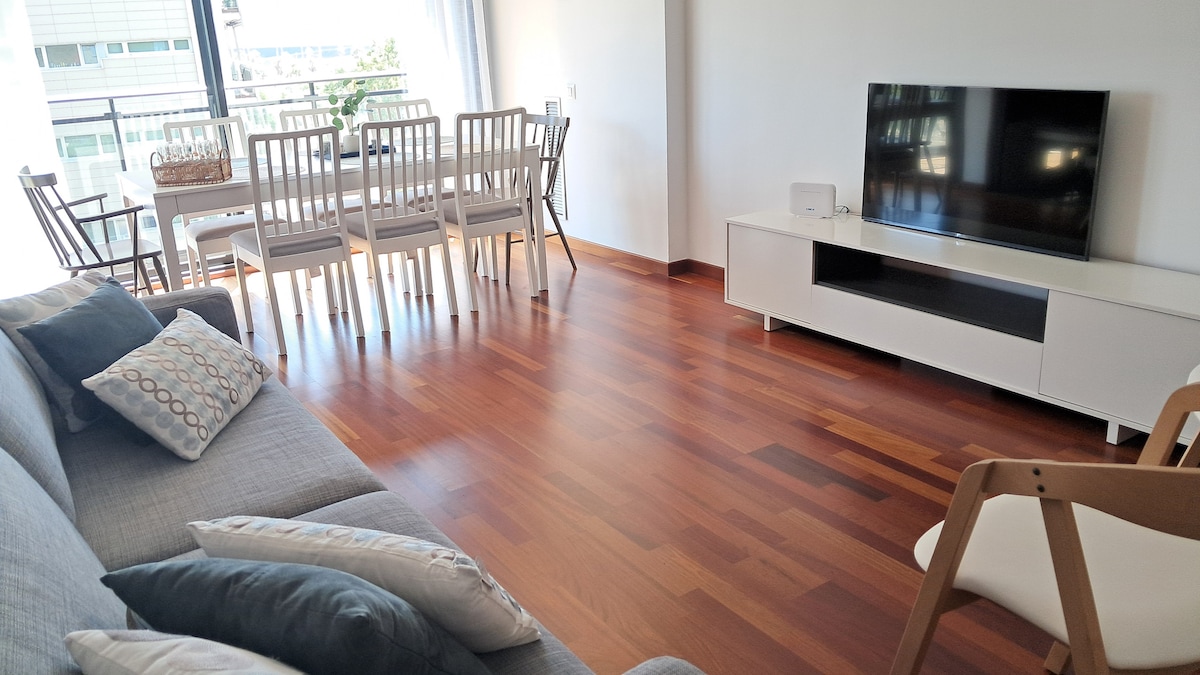
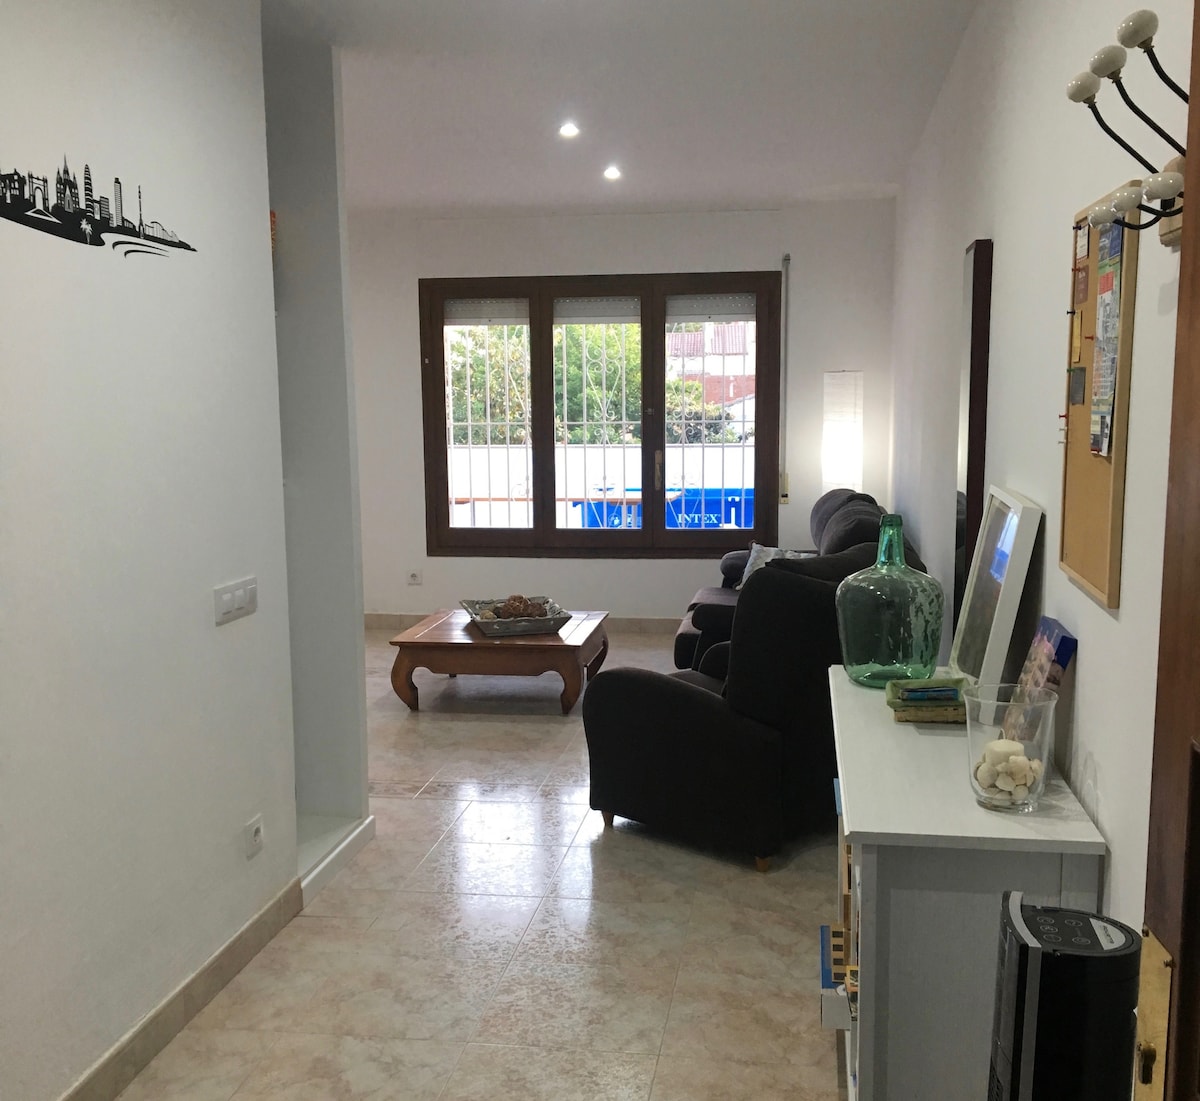
Sitges, the ‘Jewel of the Mediterranean’ just south of Barcelona, offers a prestigious and vibrant seaside experience famous for its film festival, its inclusive atmosphere, and its beautiful historic center. It is a top-tier destination attracting a sophisticated international clientele seeking elegance, high-end gastronomy, and pristine beaches. The Airbnb market here is very high-performing, featuring a remarkable average daily rate of €223. Visitors seek the exclusivity of coastal villas and the charm of townhouses in the old town, generating an impressive annual revenue of €50,675. Its glamorous reputation and stunning setting ensure solid and reliable profitability.
Featured Listings

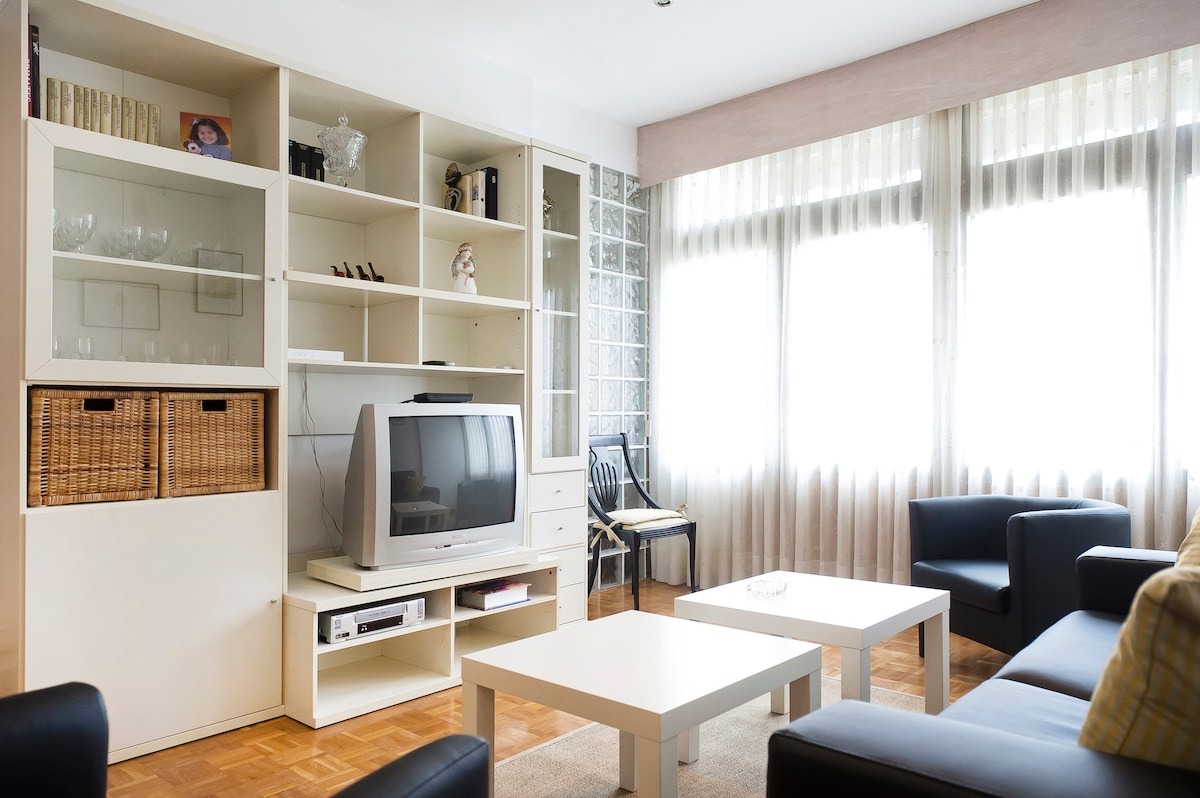
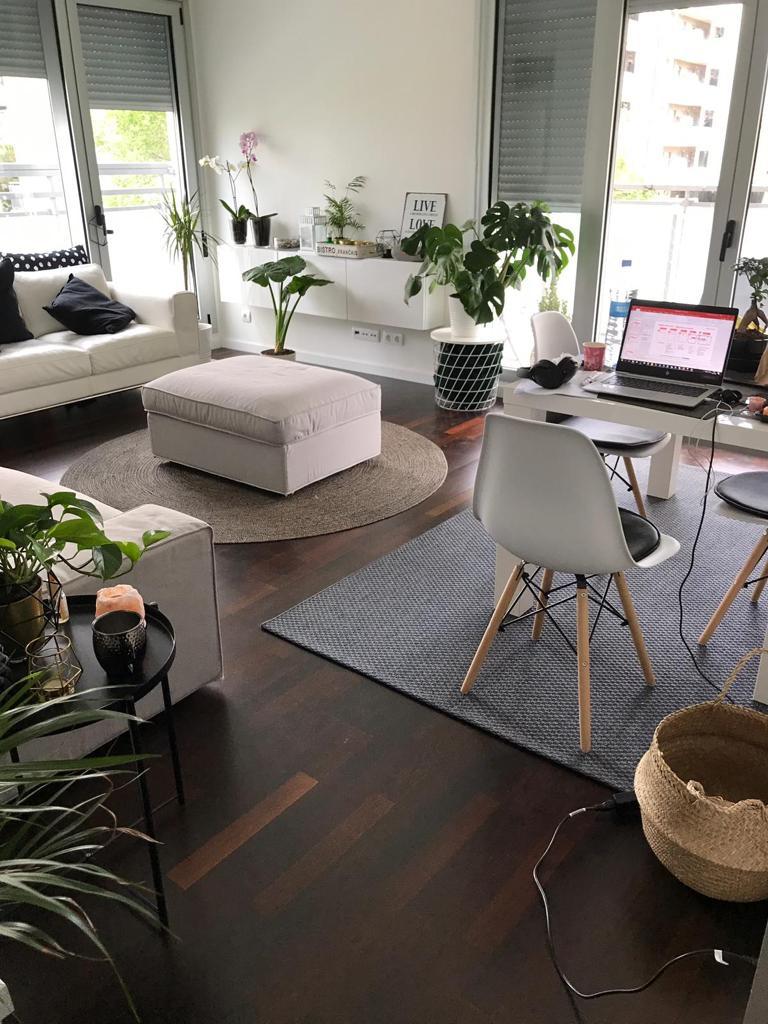
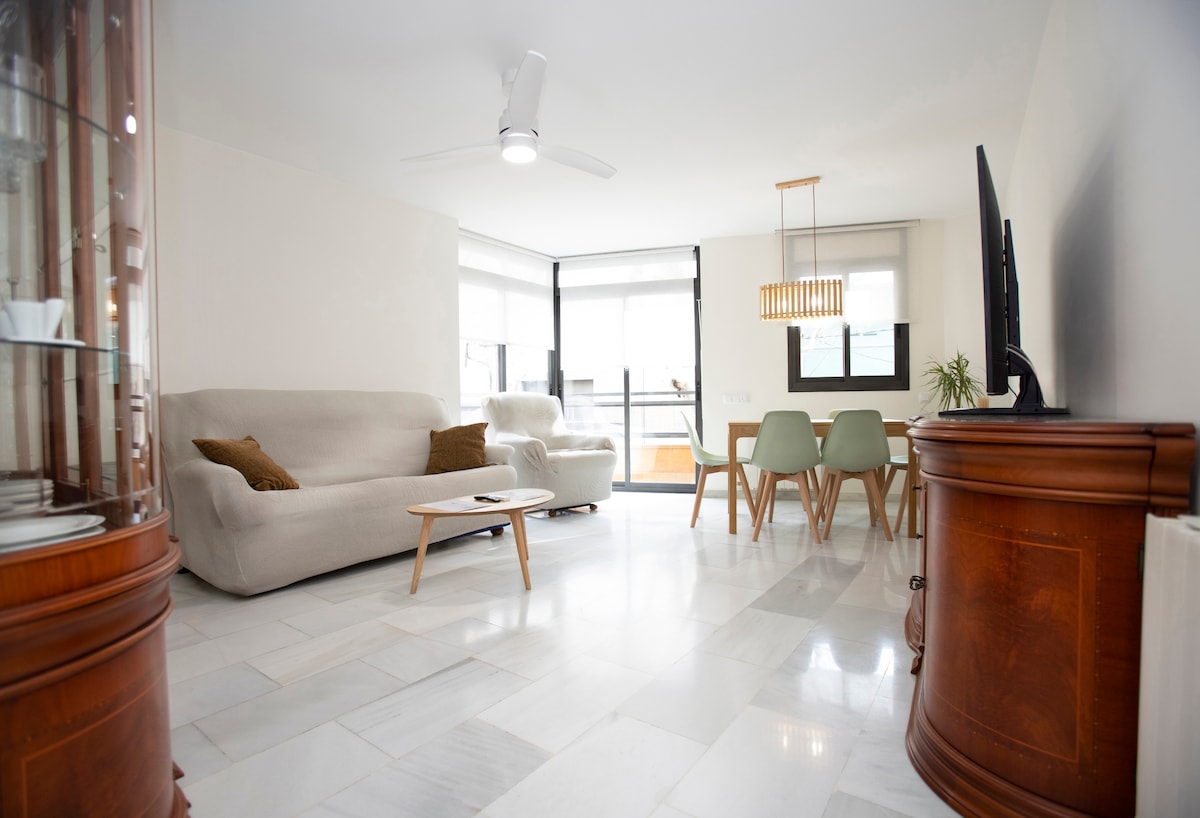
L'Hospitalet de Llobregat, a dynamic city adjacent to Barcelona, offers a strategic and well-connected base for visitors seeking a mix of industrial history and modern urban energy. Known for hosting the major Fira Barcelona events and its growing cultural scene, it attracts a diverse mix of business travelers and discovery tourists. The Airbnb market here is extremely efficient, featuring an impressive occupancy rate of 75%. Visitors value the functionality of modern apartments and the convenience of being just minutes from the center of Barcelona, generating a steady annual revenue of €44,430. Its role as a major economic and transport hub ensures consistent rental demand.
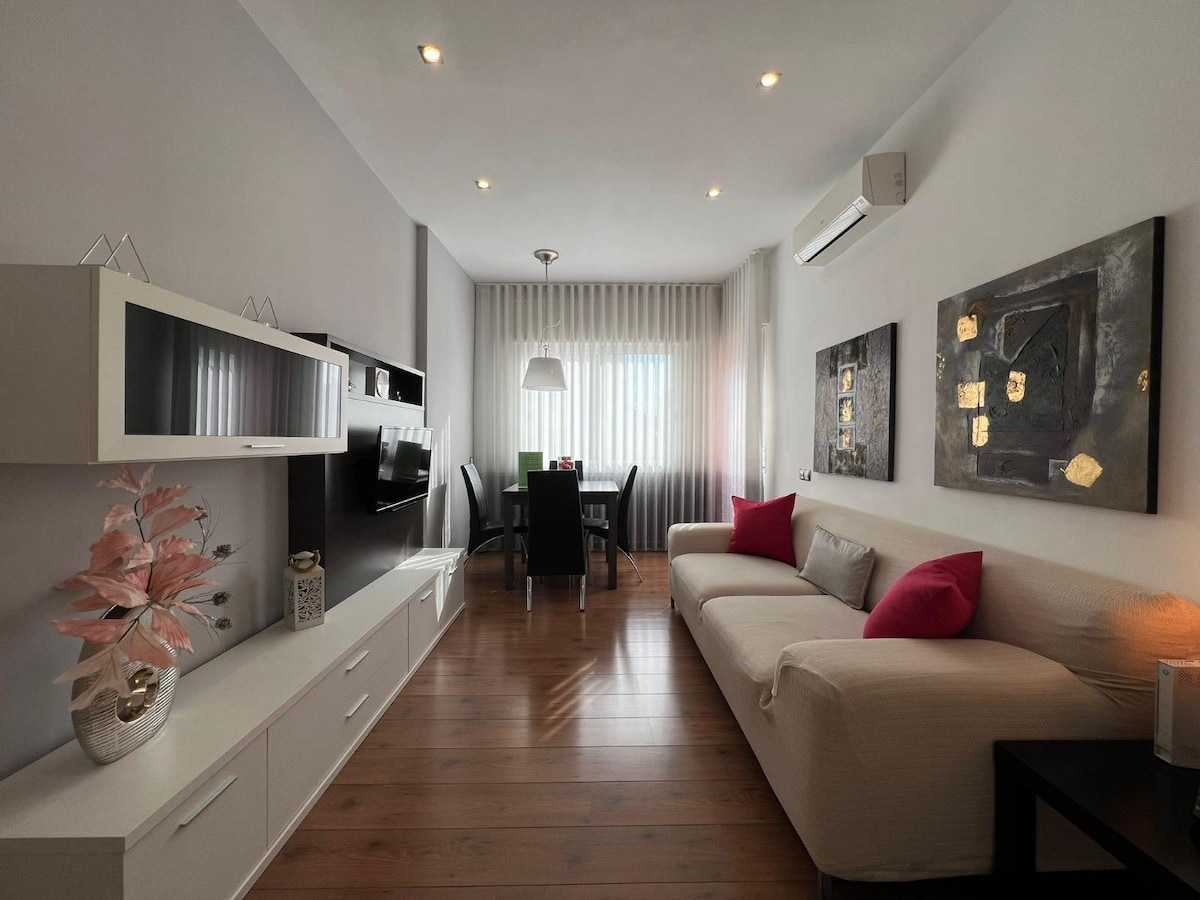
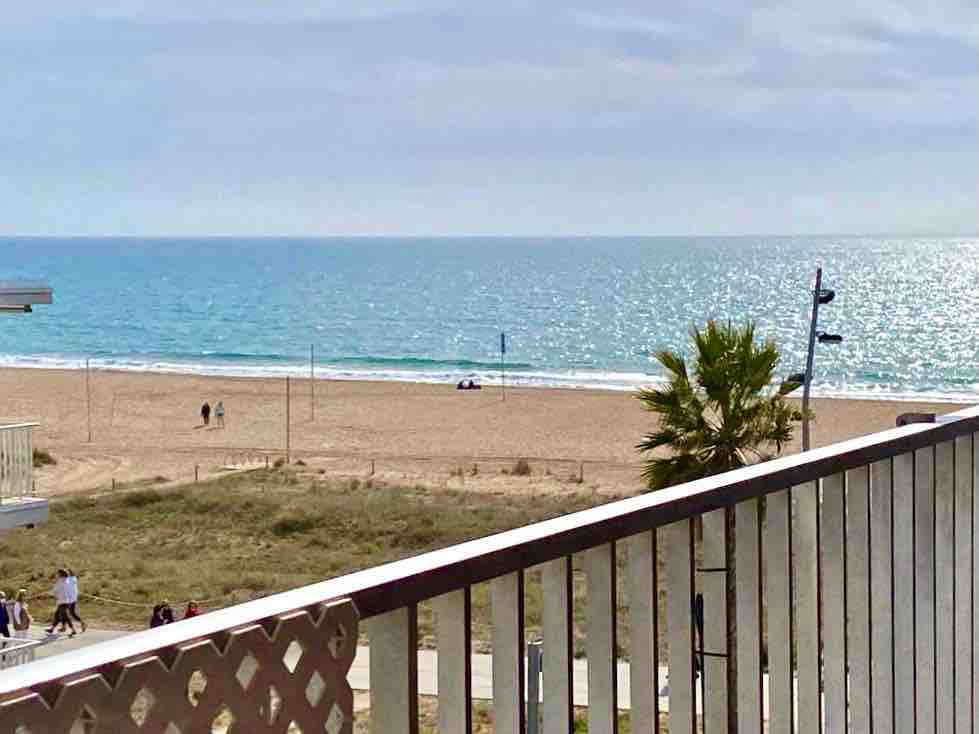
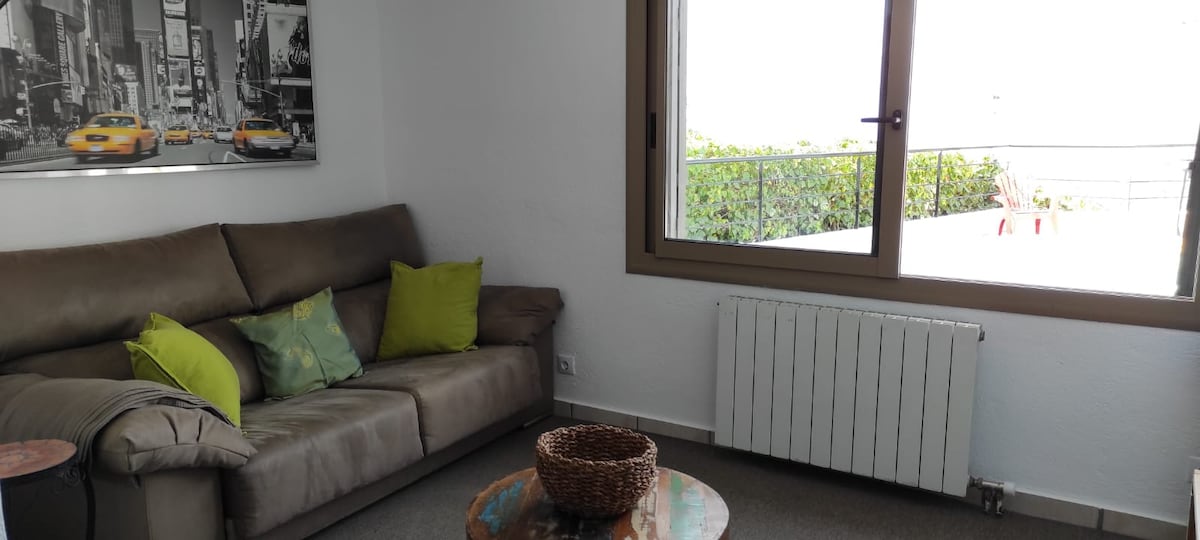
Castelldefels, a prestigious seaside town famous for its long sandy beaches and its iconic castle, offers an ideal Mediterranean lifestyle just outside Barcelona. It is a destination that appeals to a massive mix of international professionals and families seeking a relaxed coastal vibe near urban amenities. The Airbnb market is high-performing here, featuring an occupancy rate of 70%. Visitors seek the quality of modern apartments with sea views and the independence of villas with gardens, taking advantage of an average daily rate of €172. Its year-round appeal and reputation as a prime residential escape ensure robust profitability.
Featured Listings
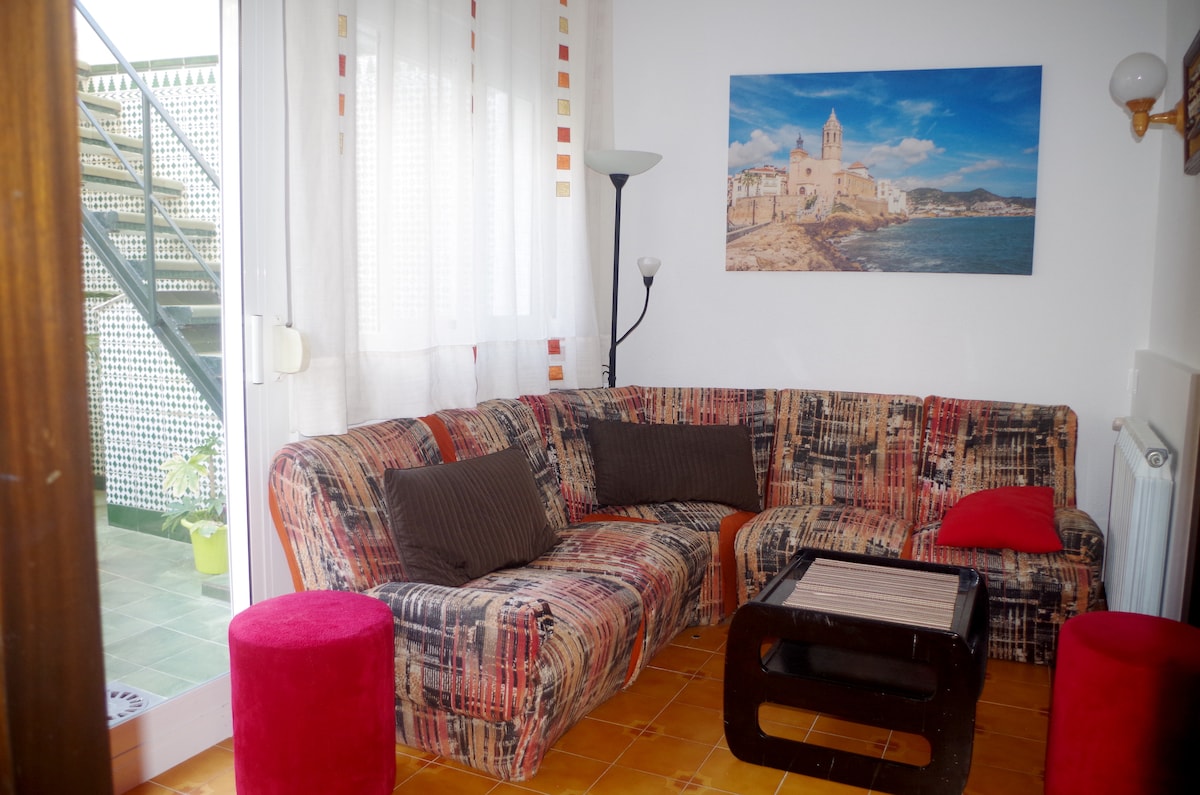
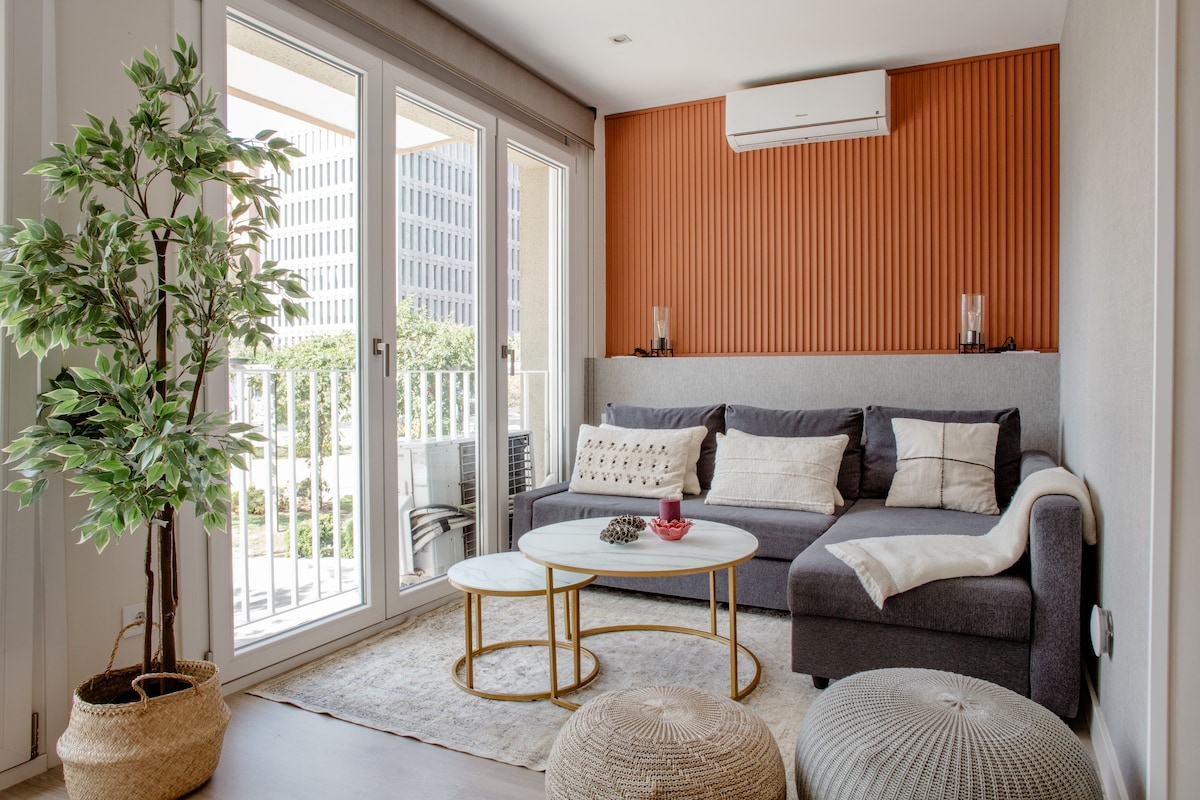
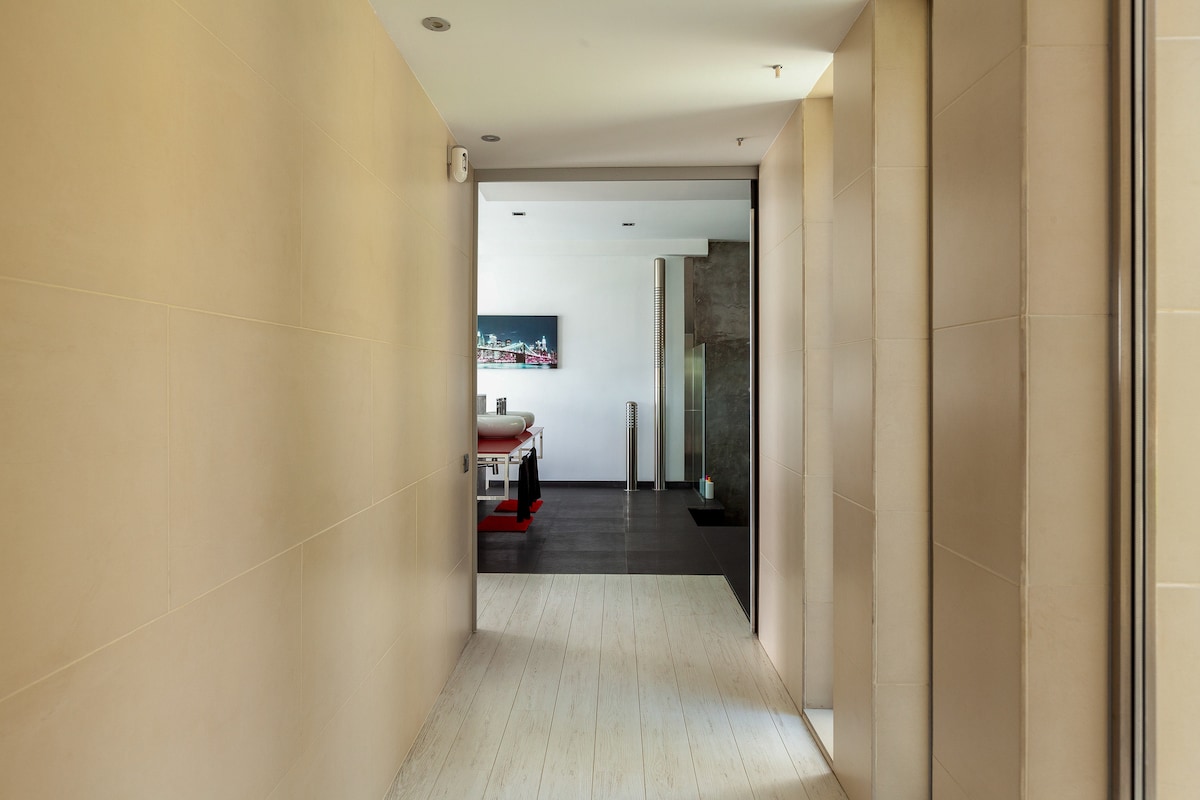
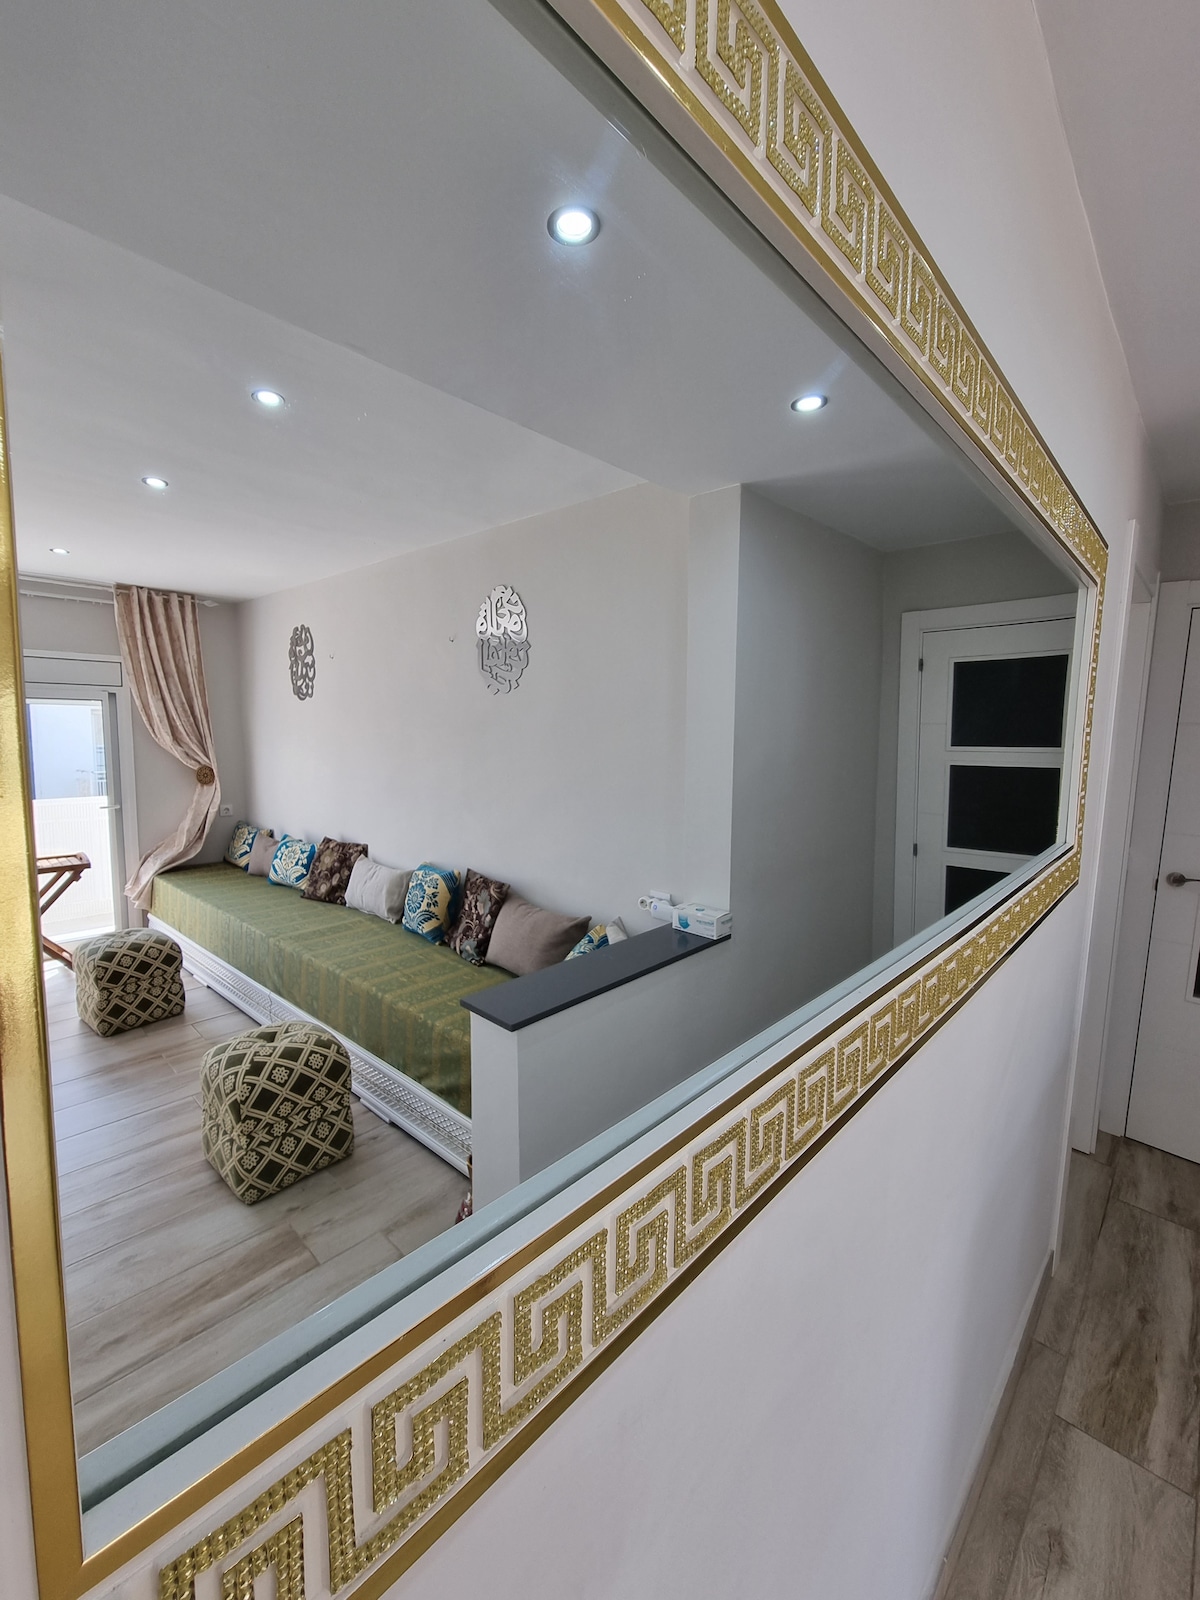
Sant Adrià de Besòs, situated on the Mediterranean coast between Barcelona and Badalona, offers a unique and evolving urban setting famous for its distinctive industrial heritage and its modernizing waterfront. It is a destination that appeals to travelers seeking a more affordable base with excellent beach access and rapid connections to the heart of the capital. The Airbnb market here is very active, featuring an impressive occupancy rate of 71%. Visitors appreciate the functionality of renovated apartments and the proximity to the Diagonal Mar area, generating a steady annual revenue of €42,842. Its strategic location and coastal rejuvenation ensure reliable rental potential.
Featured Listings
Badalona, the city facing the sea and connected to the Barcelona metropolis, has undergone a spectacular transformation, becoming a dynamic destination with well-kept beaches and invaluable Roman heritage. It is an expanding market attracting visitors seeking a relaxed coastal atmosphere that remains perfectly connected to central Barcelona. The Airbnb market here is very efficient, featuring an occupancy rate of 71%. Visitors value the modernity of apartments near the sea and the ‘Pont del Petroli’ pier, generating a notable annual revenue of €48,151. Its metropolitan energy and leisure offerings ensure solid and growing profitability.
Featured Listings
Pineda de Mar, a quintessential and traditional seaside resort on the Maresme coast, enchants with its long sandy beaches and its peaceful, family-friendly atmosphere. It is a destination that appeals through its authentic charm and gentle lifestyle, attracting domestic and international tourists seeking a classic Mediterranean holiday experience. The Airbnb market here is solid, featuring an occupancy rate of 56%. Visitors seek the charm of holiday apartments near the waterfront and the functionality of homes in the town center, generating a steady annual revenue of €29,112. Its year-round coastal beauty and friendly community ensure regular demand.
Get Live Barcelona, Catalunya Market Intelligence
Discover detailed Barcelona, Catalunya Airbnb Analytics and explore real-time market data to make accurate investment decisions.
Explore Real-time Analytics
Explore Other Markets in Spain
Airbnb Occupancy Rates in Madrid, Comunidad De Madrid
Comunidad De Madrid, Spain
11,165 Active Listings
Airbnb Occupancy Rates in Valencia, Comunitat Valenciana
Valencia / Valencia, Spain
4,528 Active Listings