Airbnb Occupancy Rates in Curitiba, Paraná(July 2026)
Curitiba is Paraná’s most stable urban rental capital: less dependence on a single festival week, more demand from business, universities, and weekend travelers from São Paulo and the Paraná interior.
In July 2026, the market shows R$41,743 average revenue per listing, 57% occupancy, R$200 per night, and 5,533 active listings—modest ADR versus Rio or SP, but predictable operation for hosts focused on Batel, Água Verde, and the Civic Center axis.
Curitiba Airbnb Market Map (July 2026)
Curitiba Market Performance
Period: January 2026 - June 2026
Is Airbnb a Good Investment in Curitiba?
YES — Curitiba makes sense for investors who prioritize steady occupancy and moderate ticket size, with a predictable urban calendar year-round.
- Curitiba: R$41,743, 57% — Paraná corporate hub
- São Paulo: R$57,076, 58% — national scale
- Florianópolis: R$98,862, 51% — coastal summer
- Belo Horizonte: R$59,427, 59% — Minas Gerais interior
- Porto Alegre: R$36,810, 49% — Rio Grande do Sul capital
| Market | Revenue | Occupancy | vs Curitiba |
|---|---|---|---|
| Curitiba | R$41,743 | 57% | — |
| São Paulo | R$57,076 | 58% | Higher ADR, more competition |
| Florianópolis | R$98,862 | 51% | Beach seasonality |
| Porto Alegre | R$36,810 | 49% | Compare if expanding in the South |
Get Live Curitiba Market Intelligence
Discover detailed Curitiba Airbnb Analytics and explore real-time market data to make accurate investment decisions.
Explore Real-time Analytics
How Often Will Your Airbnb Be Booked in Curitiba?
View Demand Patterns →Occupancy rates directly impact your revenue potential. Understanding demand patterns helps you set realistic expectations and optimize your availability strategy.
The current average occupancy rate in Curitiba is 57%, meaning properties are booked for about 209 nights per year. However, occupancy varies significantly based on property quality and management. Here's what you can expect:
Airbnb Occupancy Tiers in Curitiba
Premium(Top 10%) | High-performing(Top 25%) | Average(Median) | Low-performing(Bottom 25%) |
|---|---|---|---|
| 89% | 74% | 51% | 19% |
*High desirability & optimized availability | *Good market fit & guest satisfaction | *Standard market performance | *Higher vacancy, optimization needed |
Seasonal Occupancy Patterns in Curitiba
April, June
Highest demand and occupancy rates. Perfect for premium pricing strategies and maximizing revenue. Consider longer minimum stays and higher rates.
September, August
Moderate demand with balanced pricing opportunities. Good for attracting budget-conscious travelers while maintaining reasonable occupancy rates.
October, November
Lower demand requires competitive pricing and creative marketing. Focus on local events, extended stay discounts, and targeting specific traveler segments.
How Much Can You Earn with Airbnb in Curitiba?
Calculate Earnings →One of the most common questions for potential Airbnb hosts in Curitiba is about earning potential. Let's break down the revenue patterns and what you can realistically expect to earn.
Monthly Revenue Trends in Curitiba
Best-in-class Airbnb properties (top 10%) in Curitiba achieve around R$61,528 annually, while strong performers (top 25%) earn at least R$43,278. Typical properties generate about R$26,796 per year, and entry-level listings (bottom 25%) see earnings near R$8,538, often with room for optimization. Keep in mind, these are market averages—your actual earnings can be even higher depending on your property's location, bedrooms, guest capacity, and unique amenities.
Want to see how your listing could perform? Create a free account to unlock personalized analytics and explore exclusive insights in our app!
What Can You Learn from Top-Performing Airbnbs in Curitiba?
View Top Performers →Studying successful properties provides valuable insights for your own Airbnb strategy. Here are the top-performing listings in Curitiba and what makes them successful.


Curitiba Market Analysis
What to buy
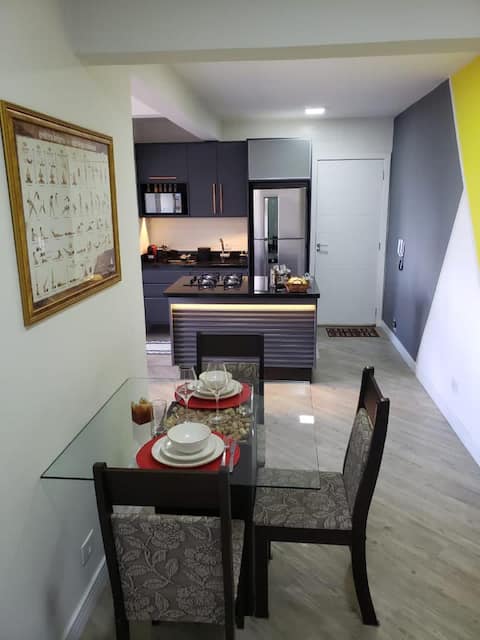
One- and two-bedroom apartments in Batel, Bigorrilho, Água Verde, and downtown with parking. Buildings with 24-hour doorman convert better for executives. Studios near UFPR and PUCPR capture academic visits.
Listing tips that convert
Units with transit access or parking retain corporate guests. Listings that name a specific neighborhood (Batel, Água Verde, downtown) win clicks over generic “all of Curitiba” ads.
Pricing management
Tiradentes, Corpus Christi, and July school holidays move families. Expo Trade and Pinhais events pull temporary demand—watch the municipal calendar.
What Are the Airbnb Regulations in Curitiba?
Understanding local regulations is crucial for operating a successful Airbnb. Let's examine the compliance landscape and what you need to know about licensing requirements in Curitiba.
Current Regulatory Status
No properties have proper licensing in this market, indicating minimal regulatory enforcement.
| Requirement | Where to verify | Link |
|---|---|---|
| Condominium | Bylaws and assembly | Building manager |
| Municipal taxes | ISS and business registration | City of Curitiba |
| Federal law | Stays up to 90 days | Lei 8.245/1991 |
| State tourism | Paraná guidance | Turismo Paraná |
Curitiba follows the national host-registry debate—validate obligations before opening a second or third unit. Written contracts per booking protect against no-shows and damage.
What Should You Charge for Your Airbnb in Curitiba?
Smart Pricing Tools →Pricing is one of the most critical decisions for Airbnb success. Let's analyze the current pricing landscape and help you understand what rates you can realistically charge.
The current average daily rate in Curitiba is R$200 per night. However, pricing varies significantly based on property quality and location. Here's what different property tiers typically charge:
Airbnb Pricing Tiers in Curitiba
Premium(Top 10%) | High-performing(Top 25%) | Average(Median) | Budget(Bottom 25%) |
|---|---|---|---|
| R$305per night | R$211per night | R$159per night | R$114per night |
*Top locations, big properties, premium amenities | *Good property management, highly rated | *Standard market performance | *Basic properties, less desirable locations |
Is It Profitable to Start an Airbnb in Curitiba?
Investment Analysis →Understanding the profitability potential is crucial for any Airbnb investment decision. Let's analyze the revenue performance and profit margins in the Curitiba market to help you make informed financial decisions.
Revenue Performance
Profitability Factors
Which Areas in Curitiba Are Most Profitable for Airbnb?
Explore All Areas →Top-performing neighborhoods
- Centro — R$39,167, 58%, 2,090 listings.
- Água Verde — R$43,237, 55%; leafy residential area near Linha Verde.
- Batel — R$62,873, 59%; bars, corporate offices, nightlife.
- Bigorrilho — R$49,300, 63%; near hospitals and Batel.
- Cristo Rei — R$44,118, 61%; quick downtown access.
Batel–Bigorrilho axis
Restaurant and office concentration makes this the default for business travelers. Highlight Wi‑Fi and a work desk; many guests work remotely for a day.
Historic center and events
Downtown absorbs weekend tourism and events in the Historic Sector. Noise and foot traffic vary—honest photos reduce negative reviews.
Explore Other Markets in Brazil
Airbnb Occupancy Rates in Rio De Janeiro, Rio De Janeiro
Rio De Janeiro, Brazil
32,783 Active Listings
Airbnb Occupancy Rates in Cabo Frio, Rio De Janeiro
Macae Rio Das Ostras Cabo Frio, Brazil
9,580 Active Listings