Airbnb Occupancy Rates in La Réunion, France(June 2026)
La Réunion is not just another mainland French market: it is an overseas island with 7,194 active listings (data as of June 2026), averaging €26,167 in annual revenue per listing, 66% occupancy, and €109 per night — figures that blend beach tourism and mountain stays in a single overseas department.
Guests mix west-coast lagoons, cirques and pitons inland, hiking, and family holidays flown in from mainland France. Host performance depends heavily on the commune (Saint-Paul, Saint-Leu, Saint-Denis…) and on national meublé de tourisme rules plus taxe de séjour collected through Réunion intercommunal portals.
Investing here means accepting southern-hemisphere seasonality (mainland school-holiday peaks) and competition spread across coastal communes — not one compact city centre like Paris or Lyon.
La Réunion Airbnb Market Map (June 2026)
La Réunion Market Performance
Period: June 2025 - May 2026
Is Airbnb a Good Investment in La Réunion?
YES — La Réunion suits investors targeting a high-occupancy French island market, provided you pick the right commune, display your registration number, and remit tourist tax on the correct EPCI portal.
Against other French regions:La Réunion posts €26,167 average revenue and 66% occupancy across 7,194 listings — a distinct overseas island profile. Corse (€39,601, 62%) also pairs sea and mountains with deeper inventory (21,964 listings); Provence-Alpes-Côte d'Azur (€33,803, 58%) leads Mediterranean mainland ADR; Bretagne (€21,404, 54%) offers a more seasonal Atlantic coast; Auvergne-Rhône-Alpes (€28,942, 54%) remains a mountain-and-city hub without island supply-chain friction.
Local strengths: direct flights from Paris, Lyon, and Marseille; repeat demand from mainland France; diverse micro-markets (west lagoon, wild south, windy east, urban north). Constraints: town-hall declaration, tourist tax by EPCI (TCO, CINOR, CIREST, CASUD, CIVIS), humidity and cyclone maintenance costs, and spare-parts logistics. Winning here means underwriting the right commune profile (below) rather than treating “La Réunion” as a single revenue line.
Get Live La Réunion Market Intelligence
Discover detailed La Réunion Airbnb Analytics and explore real-time market data to make accurate investment decisions.
Explore Real-time Analytics
How Often Will Your Airbnb Be Booked in La Réunion?
View Demand Patterns →Occupancy rates directly impact your revenue potential. Understanding demand patterns helps you set realistic expectations and optimize your availability strategy.
The current average occupancy rate in La Réunion is 66%, meaning properties are booked for about 240 nights per year. However, occupancy varies significantly based on property quality and management. Here's what you can expect:
Airbnb Occupancy Tiers in La Réunion
Premium(Top 10%) | High-performing(Top 25%) | Average(Median) | Low-performing(Bottom 25%) |
|---|---|---|---|
| 98% | 84% | 59% | 21% |
*High desirability & optimized availability | *Good market fit & guest satisfaction | *Standard market performance | *Higher vacancy, optimization needed |
Seasonal Occupancy Patterns in La Réunion
November, May
Highest demand and occupancy rates. Perfect for premium pricing strategies and maximizing revenue. Consider longer minimum stays and higher rates.
September, July
Moderate demand with balanced pricing opportunities. Good for attracting budget-conscious travelers while maintaining reasonable occupancy rates.
June, December
Lower demand requires competitive pricing and creative marketing. Focus on local events, extended stay discounts, and targeting specific traveler segments.
How Much Can You Earn with Airbnb in La Réunion?
Calculate Earnings →One of the most common questions for potential Airbnb hosts in La Réunion is about earning potential. Let's break down the revenue patterns and what you can realistically expect to earn.
Monthly Revenue Trends in La Réunion
Best-in-class Airbnb properties (top 10%) in La Réunion achieve around €38,794 annually, while strong performers (top 25%) earn at least €23,396. Typical properties generate about €13,100 per year, and entry-level listings (bottom 25%) see earnings near €3,763, often with room for optimization. Keep in mind, these are market averages—your actual earnings can be even higher depending on your property's location, bedrooms, guest capacity, and unique amenities.
Want to see how your listing could perform? Create a free account to unlock personalized analytics and explore exclusive insights in our app!
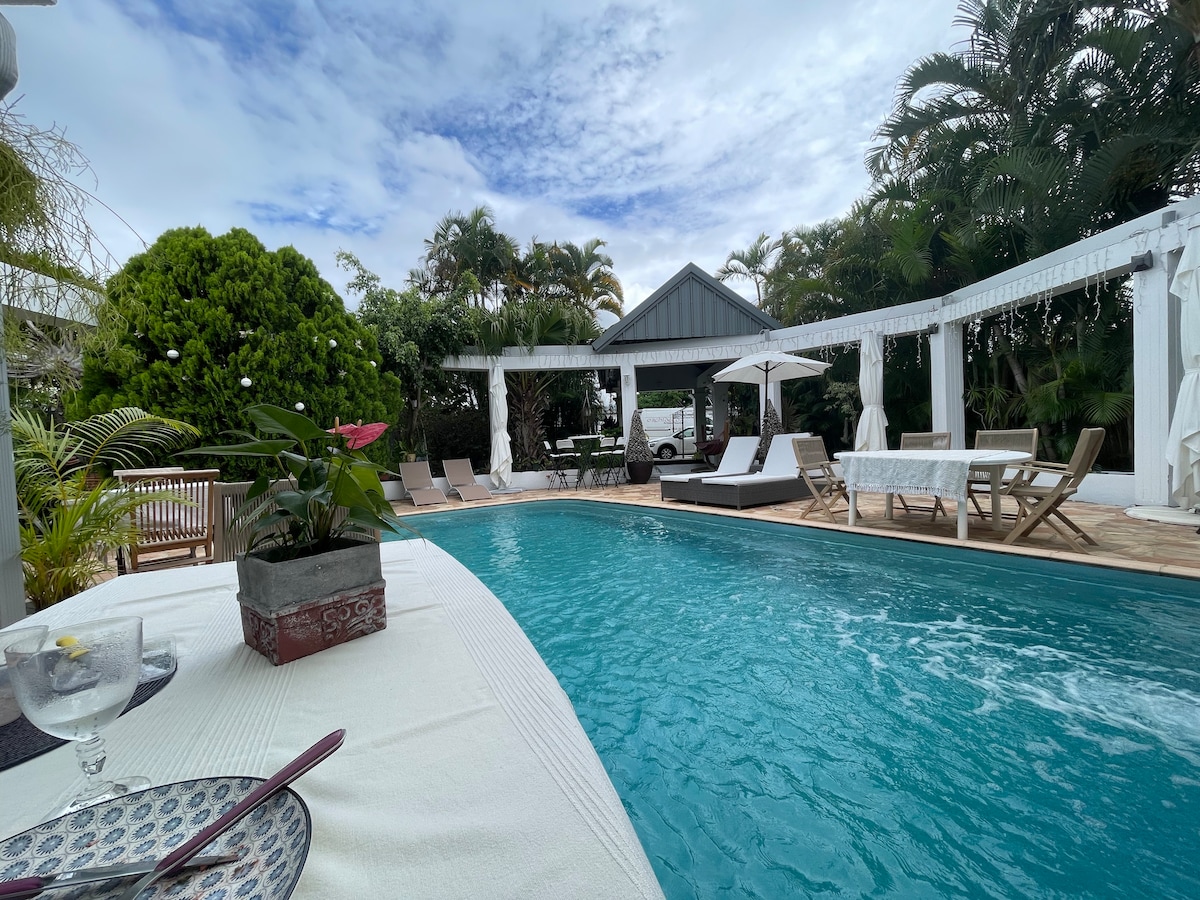
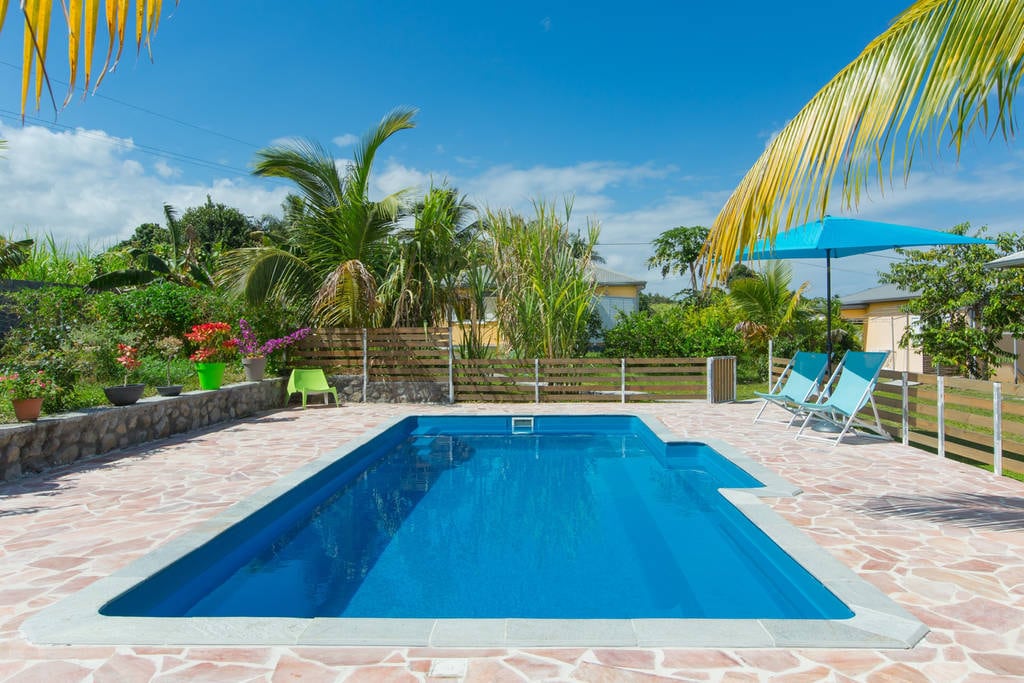
What Can You Learn from Top-Performing Airbnbs in La Réunion?
View Top Performers →Studying successful properties provides valuable insights for your own Airbnb strategy. Here are the top-performing listings in La Réunion and what makes them successful.

La Réunion Market Analysis
Southern summer (December–February)
Mainland school holidays and year-end festivities compress availability on Saint-Paul, Saint-Leu, and the west coast. Rates rise on pool villas and sea-view homes; studios without AC or ventilation underperform despite headline demand. Plan for long family bookings and minimum stays on peak weeks.
Autumn (March–May)
Often the sweet spot for active tourism (hiking, canyoning, paragliding) and remote-work stays from mainland France. Inland communes (Cilaos, Salazie by road) and the south (Saint-Joseph, Petite Île) can hold occupancy when listings target nature guests—not only beach days.
Winter (June–August)
Relatively softer but not dead: professional visits, students, local events. AC servicing, mould prevention, and maintenance responsiveness matter in the humid season. Use this window to reset pricing on communes that over-performed in peak season.
Spring (September–November)
Gradual rebuild before the holidays; good period for medium-length stays. Saint-Denis hosts capture more airport and business nights; the west coast stays leisure-led. Benchmark commune by commune — the regional average hides wide gaps between Saint-Paul and Saint-André.
What Are the Airbnb Regulations in La Réunion?
Understanding local regulations is crucial for operating a successful Airbnb. Let's examine the compliance landscape and what you need to know about licensing requirements in La Réunion.
Current Regulatory Status
No properties have proper licensing in this market, indicating minimal regulatory enforcement.
Risk: letting without town-hall declaration, without the registration number on listings (when the commune requires it), and without taxe de séjour exposes you to fines, platform takedowns, and tax arrears — the framework is national meublés de tourisme law, applied commune by commune in La Réunion.
- Confirm whether the property is a primary residence (120 days/year letting cap) or secondary residence (possible change-of-use rules) — Service Public F33175 and F2043.
- File the mairie declaration (CERFA 14004*04) and obtain the number to display on Airbnb and OTAs.
- From 20 May 2026, plan national online registration for all furnished tourist lets (entreprises.gouv.fr — meublés de tourisme).
- Collect and remit taxe de séjour on the property’s EPCI portal (TCO, CINOR, CIREST, CASUD, CIVIS) — see Service Public F2048.
- Follow the Tourism Code (Légifrance — meublés de tourisme) and the Ecology ministry guide.
National framework (France)
Seasonal letting sits under the Code du tourisme; the regional guide cites a typical 90-day tourist stay limit per tenant (pro.reunion.fr — seasonal letting). No single DOM exemption: mairie + EPCI + national rules apply.
La Réunion specifics
The IRT professional portal covers local steps and intercommunal tourist tax. Check condominium bylaws (common on the coast) and access constraints (coastal roads, cyclones).
How Competitive is the Airbnb Market in La Réunion?
Analyze Competition →Understanding market competition is crucial for any potential Airbnb host. Let's examine the supply dynamics and what they mean for your investment strategy. The La Réunion Airbnb market currently features 7,194 active listings with an average occupancy rate of 66%. This represents a highly competitive market environment where strong demand supports premium pricing.
Airbnb Listings: Change Over Time
Strategic Entry into La Réunion Airbnb Market
Competitive Positioning
- Target premium segment with high-quality amenities
- Emphasize unique features and exceptional service
- Target mid-range market segment
Market Opportunities
- Strong demand supports premium pricing strategies
- Stable market provides predictable investment returns
- Established market with proven demand patterns
What Should You Charge for Your Airbnb in La Réunion?
Smart Pricing Tools →Pricing is one of the most critical decisions for Airbnb success. Let's analyze the current pricing landscape and help you understand what rates you can realistically charge.
The current average daily rate in La Réunion is €109 per night. However, pricing varies significantly based on property quality and location. Here's what different property tiers typically charge:
Airbnb Pricing Tiers in La Réunion
Premium(Top 10%) | High-performing(Top 25%) | Average(Median) | Budget(Bottom 25%) |
|---|---|---|---|
| €203per night | €119per night | €73per night | €39per night |
*Top locations, big properties, premium amenities | *Good property management, highly rated | *Standard market performance | *Basic properties, less desirable locations |
Is It Profitable to Start an Airbnb in La Réunion?
Investment Analysis →Understanding the profitability potential is crucial for any Airbnb investment decision. Let's analyze the revenue performance and profit margins in the La Réunion market to help you make informed financial decisions.
Revenue Performance
Profitability Factors
Which Areas in La Réunion Are Most Profitable for Airbnb?
Explore All Areas →The island has one aggregated “metro” market in GuestFavorites terms, but multiple communes each with their own performance landing pages. Below are the most tracked localities (linked) — useful when narrowing a purchase or launch location.
Higher-revenue communes
- Saint-Paul — largest listing pool (2,022), €32,405 average revenue, 70% occupancy: west coast, lagoon, Hermitage/Les Trois-Bassins.
- Petite Île — €28,551 / 61% on 171 listings: wild south, Grande Anse.
- Cilaos — €28,336, 59%: mountain cirque, nature stays (demanding road access).
- Saint-Leu — €26,120, 70%, 707 listings: surf, paragliding, west coast.
West and south coast
- L'Étang-Salé — €27,833, 69%: airport proximity and dynamic west coast.
- Saint-Pierre — €24,423, 67%, 982 listings: south, town hub and iconic sites.
- Saint-Joseph — €25,054, 60%: volcanic south, Grand Galet, nature positioning.
North and east
- Saint-Denis — €16,318, 68%, 604 listings: prefecture, business, flights — often lower ADR, more urban volume.
- La Possession — €22,118, 70%: west, Mafate access and adventure profiles.
Each commune routes tourist tax through its EPCI: confirm the correct taxesejour portal (TCO, CINOR, CIREST, CASUD, or CIVIS) before the first paid booking.
Explore Other Markets in France
Airbnb Occupancy Rates in Cannes, Provence Alpes Cote D'azur
Alpes Maritimes, France
10,662 Active Listings
Airbnb Occupancy Rates in Nice, Provence Alpes Cote D'azur
Alpes Maritimes, France
8,797 Active Listings
Airbnb Occupancy Rates in Marseille, Provence Alpes Cote D'azur
Bouches Du Rhone, France
7,232 Active Listings
Airbnb Occupancy Rates in Antibes, Provence Alpes Cote D'azur
Alpes Maritimes, France
4,350 Active Listings
Airbnb Occupancy Rates in Saint Raphael, Provence Alpes Cote D'azur
Var, France
3,119 Active Listings
Airbnb Occupancy Rates in Annecy, Auvergne Rhone Alpes
Diocese D'annecy, France
2,752 Active Listings
Airbnb Occupancy Rates in Chamonix Mont Blanc, Auvergne Rhone Alpes
Diocese D'annecy, France
2,619 Active Listings