Airbnb Occupancy Rates in Rocky Mountain House, Alberta(September 2026)
Airbnbs in Rocky Mountain House, Alberta earn an average of $50,228 per year, with a typical occupancy rate of 52% and daily rates averaging $267. There were 139 listings published on Airbnb in September 2026.
This analysis will dive into the market dynamics, pricing strategies, and investment opportunities for short-term rental investors in Rocky Mountain House, Canada.
Rocky Mountain House Airbnb Market Map (September 2026)
Rocky Mountain House Market Performance
Period: February 2026 - August 2026
Get Live Rocky Mountain House Market Intelligence
Discover detailed Rocky Mountain House Airbnb Analytics and explore real-time market data to make accurate investment decisions.
Explore Real-time Analytics
How Often Will Your Airbnb Be Booked in Rocky Mountain House?
View Demand Patterns →Occupancy rates directly impact your revenue potential. Understanding demand patterns helps you set realistic expectations and optimize your availability strategy.
The current average occupancy rate in Rocky Mountain House is 52%, meaning properties are booked for about 188 nights per year. However, occupancy varies significantly based on property quality and management. Here's what you can expect:
Airbnb Occupancy Tiers in Rocky Mountain House
Premium(Top 10%) | High-performing(Top 25%) | Average(Median) | Low-performing(Bottom 25%) |
|---|---|---|---|
| 86% | 71% | 52% | 31% |
*High desirability & optimized availability | *Good market fit & guest satisfaction | *Standard market performance | *Higher vacancy, optimization needed |
Seasonal Occupancy Patterns in Rocky Mountain House
September, July
Highest demand and occupancy rates. Perfect for premium pricing strategies and maximizing revenue. Consider longer minimum stays and higher rates.
February, October
Moderate demand with balanced pricing opportunities. Good for attracting budget-conscious travelers while maintaining reasonable occupancy rates.
January, March
Lower demand requires competitive pricing and creative marketing. Focus on local events, extended stay discounts, and targeting specific traveler segments.
How Much Can You Earn with Airbnb in Rocky Mountain House?
Calculate Earnings →One of the most common questions for potential Airbnb hosts in Rocky Mountain House is about earning potential. Let's break down the revenue patterns and what you can realistically expect to earn.
Monthly Revenue Trends in Rocky Mountain House
Best-in-class Airbnb properties (top 10%) in Rocky Mountain House achieve around $87,441 annually, while strong performers (top 25%) earn at least $56,458. Typical properties generate about $32,057 per year, and entry-level listings (bottom 25%) see earnings near $15,986, often with room for optimization. Keep in mind, these are market averages—your actual earnings can be even higher depending on your property's location, bedrooms, guest capacity, and unique amenities.
Want to see how your listing could perform? Create a free account to unlock personalized analytics and explore exclusive insights in our app!
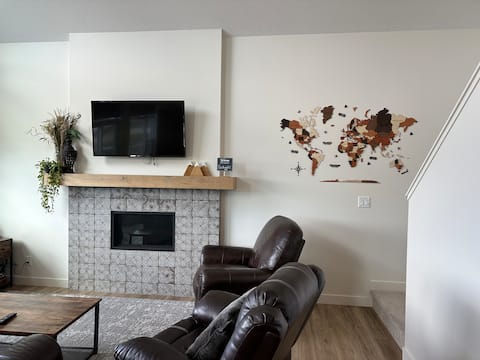
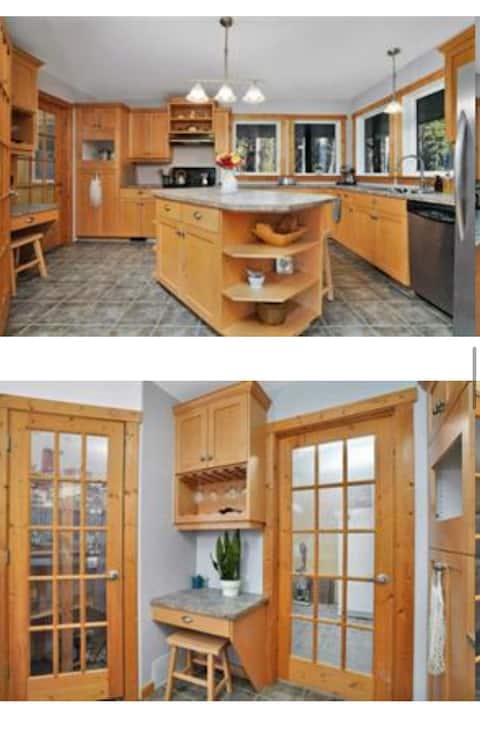
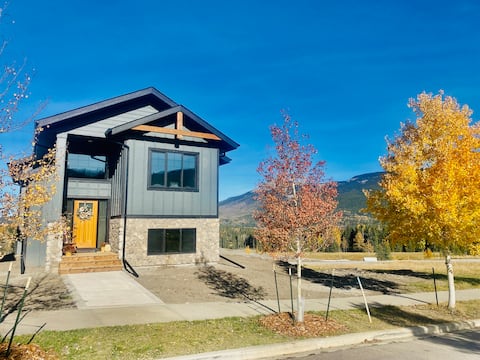
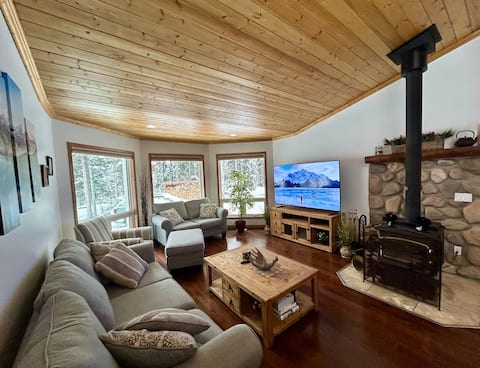
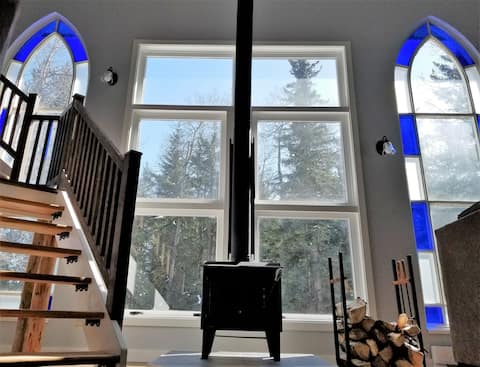
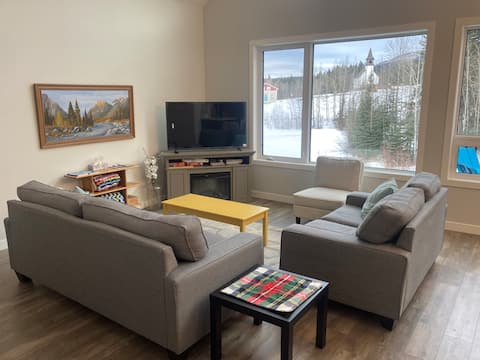
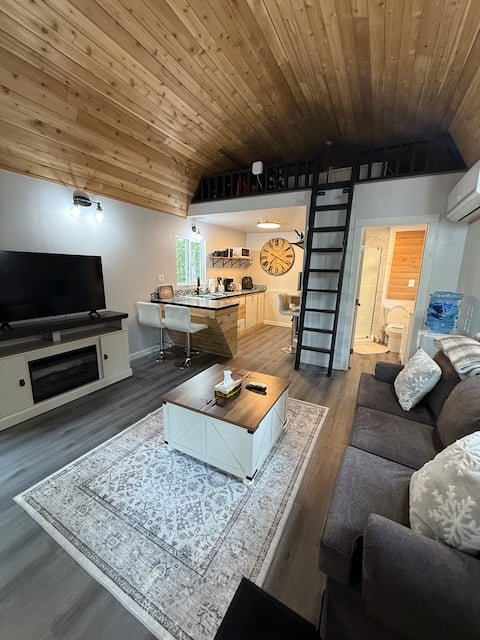
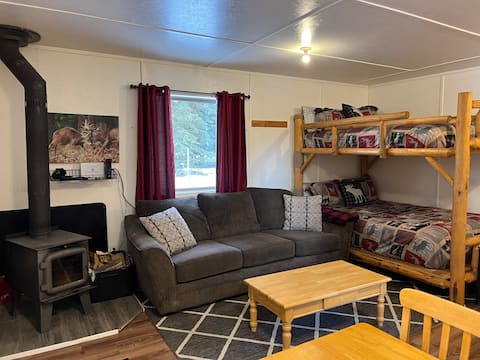
What Can You Learn from Top-Performing Airbnbs in Rocky Mountain House?
View Top Performers →Studying successful properties provides valuable insights for your own Airbnb strategy. Here are the top-performing listings in Rocky Mountain House and what makes them successful.
What Should You Charge for Your Airbnb in Rocky Mountain House?
Smart Pricing Tools →Pricing is one of the most critical decisions for Airbnb success. Let's analyze the current pricing landscape and help you understand what rates you can realistically charge.
The current average daily rate in Rocky Mountain House is $267 per night. However, pricing varies significantly based on property quality and location. Here's what different property tiers typically charge:
Airbnb Pricing Tiers in Rocky Mountain House
Premium(Top 10%) | High-performing(Top 25%) | Average(Median) | Budget(Bottom 25%) |
|---|---|---|---|
| $437per night | $303per night | $199per night | $117per night |
*Top locations, big properties, premium amenities | *Good property management, highly rated | *Standard market performance | *Basic properties, less desirable locations |
Is It Profitable to Start an Airbnb in Rocky Mountain House?
Investment Analysis →Understanding the profitability potential is crucial for any Airbnb investment decision. Let's analyze the revenue performance and profit margins in the Rocky Mountain House market to help you make informed financial decisions.
Revenue Performance
Profitability Factors
What Are the Airbnb Regulations in Rocky Mountain House?
Understanding local regulations is crucial for operating a successful Airbnb. Let's examine the compliance landscape and what you need to know about licensing requirements in Rocky Mountain House.
Current Regulatory Status
No properties have proper licensing in this market, indicating minimal regulatory enforcement.
Key Regulatory Requirements
Minimal registration requirements may apply.
- Registration numbers must be displayed on listings
- Hosts must comply with local zoning laws
- Tax collection and reporting obligations apply
- Safety standards and insurance requirements must be met
Compliance Benefits
Very low compliance barriers make it easy to start your Airbnb business.
- Avoid fines and legal issues
- Build trust with guests and neighbors
- Ensure long-term business sustainability
- Maintain listing visibility on platforms
Important: Regulations can change frequently, and requirements may vary by neighborhood. Always verify current requirements with local authorities before starting your Airbnb business.
Which Areas in Rocky Mountain House Are Most Profitable for Airbnb?
Explore All Areas →Not all areas within Rocky Mountain House perform equally. Let's analyze the performance of different neighborhoods to help you identify the most lucrative locations for your Airbnb investment.
View All 3 submarkets
Get complete profitability analysis and investment ROI for every neighborhood.
Start Free AnalysisExplore Other Markets in Canada
Airbnb Occupancy Rates in Vancouver, British Columbia
Greater Vancouver, Canada
3,682 Active Listings