Airbnb Occupancy Rates in Tarragona, Province of Tarragona(November 2026)
Airbnbs in Tarragona, Province of Tarragona earn an average of €28,256 per year, with a typical occupancy rate of 60% and daily rates averaging €128. There were 402 listings published on Airbnb in November 2026.
This analysis will dive into the market dynamics, pricing strategies, and investment opportunities for short-term rental investors in Tarragona, Spain.
Tarragona Airbnb Market Map (November 2026)
Tarragona Market Performance
Spain average: 64% occupancy, €174 per night.
Airbnb occupancy rates by city in SpainPeriod: November 2025 - October 2026
Get Live Tarragona Market Intelligence
Discover detailed Tarragona Airbnb Analytics and explore real-time market data to make accurate investment decisions.
Explore Real-time Analytics
How Often Will Your Airbnb Be Booked in Tarragona?
View Demand Patterns →Occupancy rates directly impact your revenue potential. Understanding demand patterns helps you set realistic expectations and optimize your availability strategy.
The current average occupancy rate in Tarragona is 60%, meaning properties are booked for about 221 nights per year. However, occupancy varies significantly based on property quality and management. Here's what you can expect:
Airbnb Occupancy Tiers in Tarragona
Premium(Top 10%) | High-performing(Top 25%) | Average(Median) | Low-performing(Bottom 25%) |
|---|---|---|---|
| 90% | 73% | 49% | 20% |
*High desirability & optimized availability | *Good market fit & guest satisfaction | *Standard market performance | *Higher vacancy, optimization needed |
Seasonal Occupancy Patterns in Tarragona
September, July
Highest demand and occupancy rates. Perfect for premium pricing strategies and maximizing revenue. Consider longer minimum stays and higher rates.
February, March
Moderate demand with balanced pricing opportunities. Good for attracting budget-conscious travelers while maintaining reasonable occupancy rates.
January, November
Lower demand requires competitive pricing and creative marketing. Focus on local events, extended stay discounts, and targeting specific traveler segments.
How Much Can You Earn with Airbnb in Tarragona?
Calculate Earnings →One of the most common questions for potential Airbnb hosts in Tarragona is about earning potential. Let's break down the revenue patterns and what you can realistically expect to earn.
Monthly Revenue Trends in Tarragona
Best-in-class Airbnb properties (top 10%) in Tarragona achieve around €33,759 annually, while strong performers (top 25%) earn at least €24,039. Typical properties generate about €14,283 per year, and entry-level listings (bottom 25%) see earnings near €5,512, often with room for optimization. Keep in mind, these are market averages—your actual earnings can be even higher depending on your property's location, bedrooms, guest capacity, and unique amenities.
Want to see how your listing could perform? Create a free account to unlock personalized analytics and explore exclusive insights in our app!
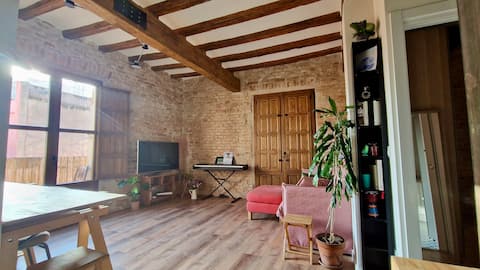
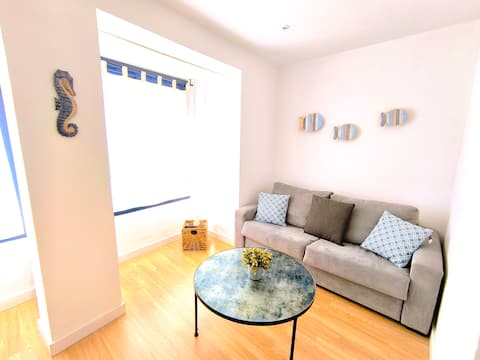
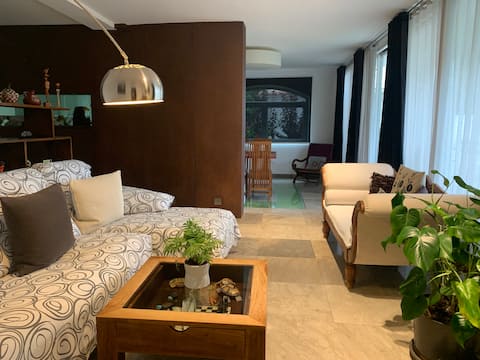
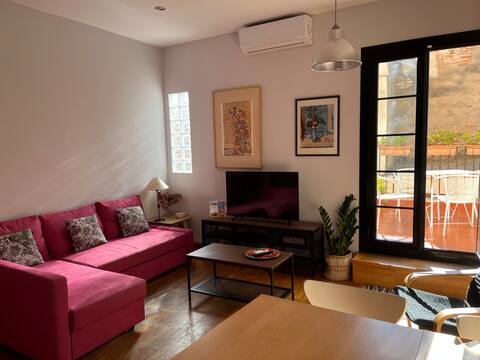
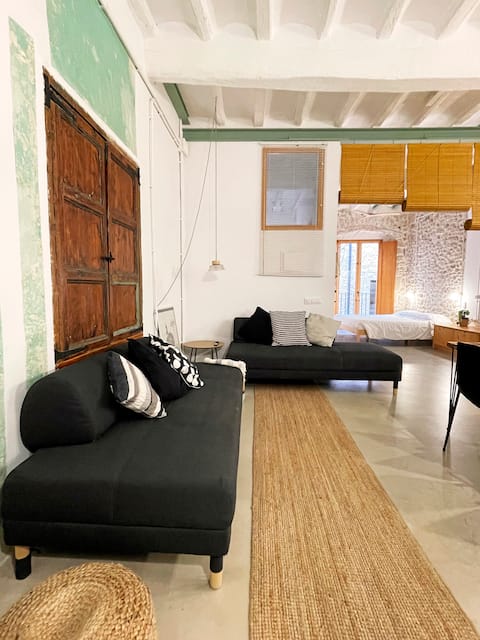
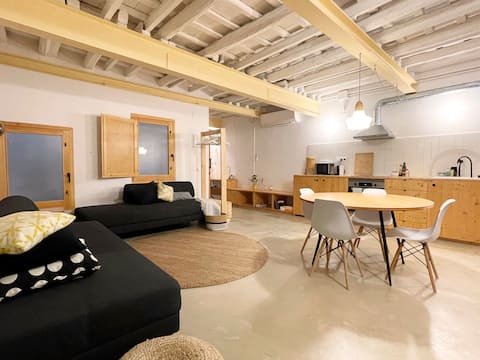
What Can You Learn from Top-Performing Airbnbs in Tarragona?
View Top Performers →Studying successful properties provides valuable insights for your own Airbnb strategy. Here are the top-performing listings in Tarragona and what makes them successful.



What Should You Charge for Your Airbnb in Tarragona?
Smart Pricing Tools →Pricing is one of the most critical decisions for Airbnb success. Let's analyze the current pricing landscape and help you understand what rates you can realistically charge.
The current average daily rate in Tarragona is €128 per night. However, pricing varies significantly based on property quality and location. Here's what different property tiers typically charge:
Airbnb Pricing Tiers in Tarragona
Premium(Top 10%) | High-performing(Top 25%) | Average(Median) | Budget(Bottom 25%) |
|---|---|---|---|
| €170per night | €125per night | €92per night | €49per night |
*Top locations, big properties, premium amenities | *Good property management, highly rated | *Standard market performance | *Basic properties, less desirable locations |
Is It Profitable to Start an Airbnb in Tarragona?
Investment Analysis →Understanding the profitability potential is crucial for any Airbnb investment decision. Let's analyze the revenue performance and profit margins in the Tarragona market to help you make informed financial decisions.
Revenue Performance
Profitability Factors
What Are the Airbnb Regulations in Tarragona?
Understanding local regulations is crucial for operating a successful Airbnb. Let's examine the compliance landscape and what you need to know about licensing requirements in Tarragona.
Rules for new hosts
New hosts can't currently open an entire-home short-term rental in this market.
Tarragona refuses every new tourist-flat application until it adapts its planning to Decreto-ley 3/2023; the special land-use plan that will set zones for tourist flats was promised for 2026 but had still not been approved by September 2026. The city has about 2,100 licences and since April 2025 has revoked dozens that were not actually being used as tourist flats, checked against the municipal population register.
- November 2023Decreto-ley 3/2023 in force: Tarragona listed; new HUT licences refused
- April 2025City starts inspecting HUT and revoking inactive licences (60 revoked by April 2026)
- TodayNext change in 24 months
- November 2028Existing HUT licences lapse unless re-licensed under adapted planning
- November 2023Decreto-ley 3/2023 in force: Tarragona listed; new HUT licences refused
- April 2025City starts inspecting HUT and revoking inactive licences (60 revoked by April 2026)
- TodayNext change in 24 months
- November 2028Existing HUT licences lapse unless re-licensed under adapted planning
- New licences
- FrozenMunicipal
- Licence
- PermitRegional
- Zoning limits
- In some areasRegional
Last checked October 20, 2026
This is a summary, not legal advice. Check with the local authority before investing.
Registration Numbers on Airbnb
98% of the active Airbnb listings we tracked last month display a registration or license number.
This reflects what hosts publish on their Airbnb listings, not the local legal requirements. Always confirm them with local authorities.
Key Regulatory Requirements
Stringent licensing requirements, frequent inspections, and comprehensive safety standards.
- Registration numbers must be displayed on listings
- Hosts must comply with local zoning laws
- Tax collection and reporting obligations apply
- Safety standards and insurance requirements must be met
Compliance Benefits
Maximum compliance ensures premium market positioning and long-term stability.
- Avoid fines and legal issues
- Build trust with guests and neighbors
- Ensure long-term business sustainability
- Maintain listing visibility on platforms
Important: Regulations can change frequently, and requirements may vary by neighborhood. Always verify current requirements with local authorities before starting your Airbnb business.
Explore Other Markets in Spain
Airbnb Occupancy Rates in Valencia, Valencian Community
Province of Valencia, Spain
3,536 Active Listings
Airbnb Occupancy Rates in Arona, Canary Islands
Santa Cruz de Tenerife Province, Spain
3,303 Active Listings
Airbnb Occupancy Rates in Torrevieja, Valencian Community
Province of Alicante, Spain
3,173 Active Listings
Airbnb Occupancy Rates in Adeje, Canary Islands
Santa Cruz de Tenerife Province, Spain
3,157 Active Listings