Airbnb Occupancy Rates in Purbeck, Dorset(September 2026)
Purbeck sits on Dorset’s Jurassic Coast — a cluster of seaside villages, heathland, and castle towns built for summer beach weeks and autumn walking breaks.
As of September 2026, the district averages £42,674 in annual revenue per listing, with 61% occupancy and a typical nightly rate of £193 across 1,143 active Airbnb listings. Coastal demand and limited supply make Purbeck one of the stronger yield pockets in Dorset, though performance varies sharply between Swanage and inland villages.
Hosts who do well here buy for the coast — Studland, Swanage, Lulworth — and price for families and walkers.
Purbeck Airbnb Market Map (September 2026)
Purbeck Market Performance
Period: September 2025 - August 2026
Is Airbnb a Good Investment in Purbeck?
YES — Purbeck is a strong coastal short-term rental market for hosts who want Dorset exposure without betting on a single resort town, provided you buy in the right village and confirm planning status with Dorset Council.
Choose Purbeck if you want a Jurassic Coast story, dual-season demand (July–August peaks plus shoulder walking weeks), and a district-wide landing that covers Studland, Swanage, Wareham, and Corfe Castle in one investment thesis.
Choose Whitby if you prefer a single iconic harbour town with 1,209 listings and a more concentrated Gothic-coast brand — higher name recognition, less internal spread.
Choose Weymouth and Portland if you want urban seafront energy next to Portland Bill, with 863 listings and a more event-driven summer calendar.
Choose Cornwall if you need national-scale inventory (17,966 listings) and are comfortable competing across a full county rather than a 400 km² district.
| Market | Avg revenue | Occupancy | Listings |
|---|---|---|---|
| Purbeck | £42,674 | 61% | 1,143 |
| Whitby | £31,200 | 57% | 1,209 |
| Weymouth & Portland | £31,702 | 56% | 863 |
| Cornwall | £36,238 | 60% | 17,966 |
Purbeck’s edge is mid-coastal yield with lower absolute competition than Cornwall; the trade-off is smaller total demand and village-level planning scrutiny in the Dorset National Landscape.
Get Live Purbeck Market Intelligence
Discover detailed Purbeck Airbnb Analytics and explore real-time market data to make accurate investment decisions.
Explore Real-time Analytics
How Often Will Your Airbnb Be Booked in Purbeck?
View Demand Patterns →Occupancy rates directly impact your revenue potential. Understanding demand patterns helps you set realistic expectations and optimize your availability strategy.
The current average occupancy rate in Purbeck is 61%, meaning properties are booked for about 221 nights per year. However, occupancy varies significantly based on property quality and management. Here's what you can expect:
Airbnb Occupancy Tiers in Purbeck
Premium(Top 10%) | High-performing(Top 25%) | Average(Median) | Low-performing(Bottom 25%) |
|---|---|---|---|
| 94% | 74% | 50% | 24% |
*High desirability & optimized availability | *Good market fit & guest satisfaction | *Standard market performance | *Higher vacancy, optimization needed |
Seasonal Occupancy Patterns in Purbeck
September, July
Highest demand and occupancy rates. Perfect for premium pricing strategies and maximizing revenue. Consider longer minimum stays and higher rates.
February, March
Moderate demand with balanced pricing opportunities. Good for attracting budget-conscious travelers while maintaining reasonable occupancy rates.
January, November
Lower demand requires competitive pricing and creative marketing. Focus on local events, extended stay discounts, and targeting specific traveler segments.
How Much Can You Earn with Airbnb in Purbeck?
Calculate Earnings →One of the most common questions for potential Airbnb hosts in Purbeck is about earning potential. Let's break down the revenue patterns and what you can realistically expect to earn.
Monthly Revenue Trends in Purbeck
Best-in-class Airbnb properties (top 10%) in Purbeck achieve around £54,833 annually, while strong performers (top 25%) earn at least £32,821. Typical properties generate about £18,780 per year, and entry-level listings (bottom 25%) see earnings near £7,650, often with room for optimization. Keep in mind, these are market averages—your actual earnings can be even higher depending on your property's location, bedrooms, guest capacity, and unique amenities.
Want to see how your listing could perform? Create a free account to unlock personalized analytics and explore exclusive insights in our app!
What Can You Learn from Top-Performing Airbnbs in Purbeck?
View Top Performers →Studying successful properties provides valuable insights for your own Airbnb strategy. Here are the top-performing listings in Purbeck and what makes them successful.
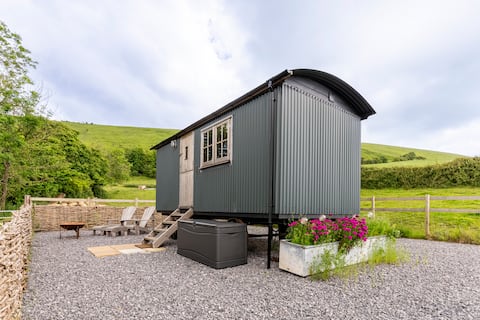
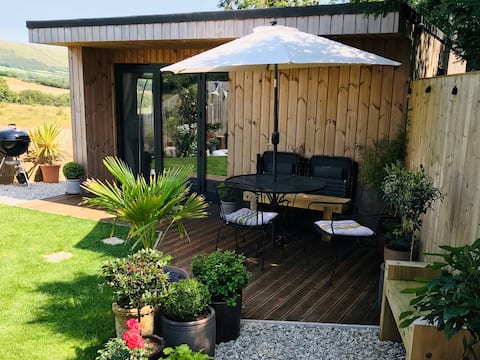
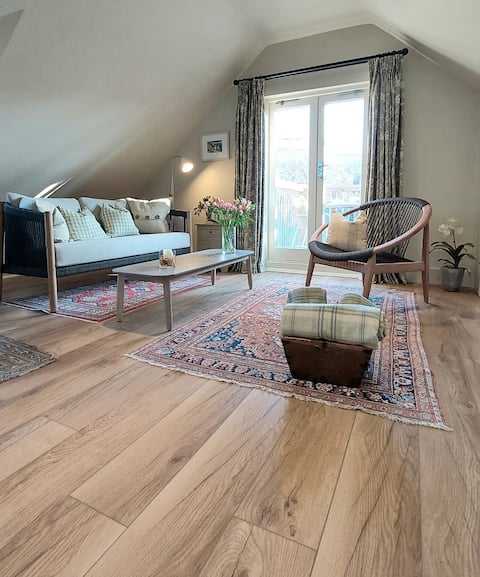
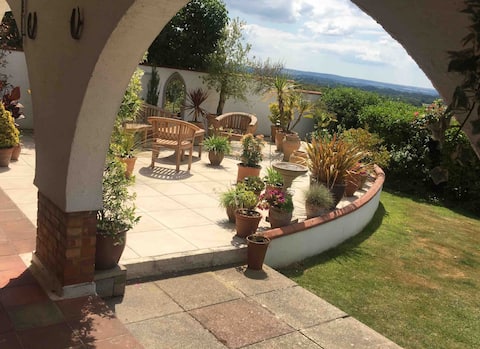
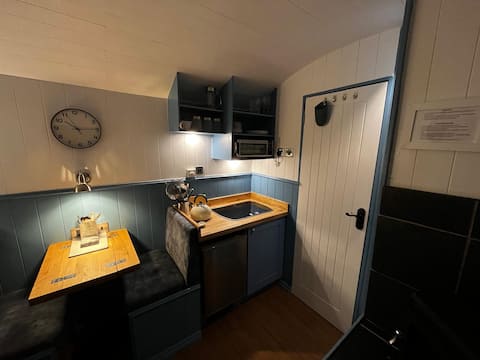
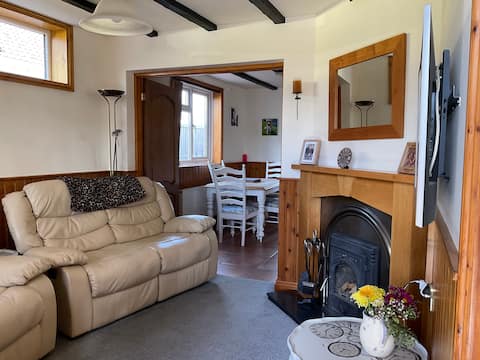
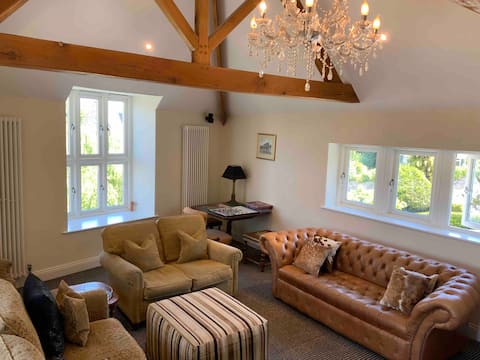
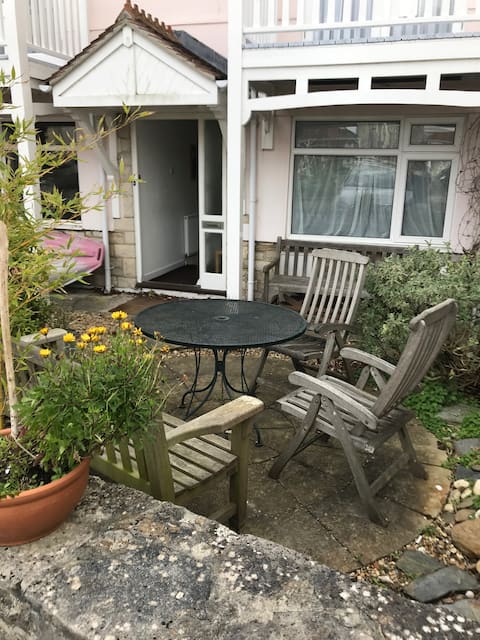
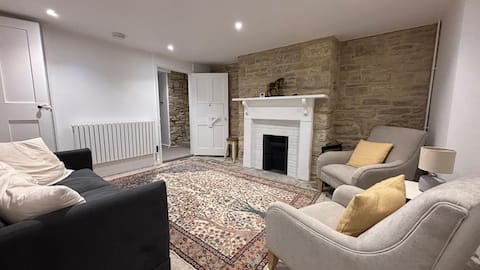
Purbeck Market Analysis
Spring (March–May)
Shoulder bookings build from Easter through half-term weeks. Walkers and fossil hunters start filling cottages near Lulworth and the South West Coast Path before nightly rates peak. Occupancy is softer than summer but ADR holds better than inland Dorset.
Summer (June–August)
Peak season for beach weeks in Studland and Swanage. Family groups drive multi-night stays; parking and beach access matter more than central location. This is when the district’s 61% average is earned — undercutting on price in July rarely fills extra nights if your property lacks sea access or a garden.
Autumn (September–November)
Coastal storms and quieter beaches pull ADR down, but Corfe Castle and Wareham villages keep weekend occupancy from Poole–Bournemouth spillover. Properties that marketed as “cozy cottage” in summer pivot to fire-pit and pub-walk positioning.
Winter (December–February)
Winter brings the district’s lowest occupancy. Hosts who stay open target short New Year breaks and remote-work mid-weeks; most underwrite assuming a seasonal dip outside July and August.
What Are the Airbnb Regulations in Purbeck?
Understanding local regulations is crucial for operating a successful Airbnb. Let's examine the compliance landscape and what you need to know about licensing requirements in Purbeck.
Current Regulatory Status
No properties have proper licensing in this market, indicating minimal regulatory enforcement.
Before listing in Purbeck, work through this checklist — rules are enforced by Dorset Council (Purbeck District Council was abolished in 2019):
Confirm planning status — Dorset decides case-by-case whether whole-property holiday use needs permission; there is no fixed night cap locally. Use the householder permitted development enquiry service before you buy or refit.
Register for the national STR scheme when live — England is rolling out a mandatory short-term let register (expected 2026). Track GOV.UK registration guidance.
Commercial waste — holiday lets must use commercial waste collection, not household bins. See Dorset Council holiday let guidance.
Business rates vs council tax — if the property is available 140+ days/year and actually let 70+ days in a rolling 12 months, it may move to business rates (same Dorset page above).
National Landscape / new builds — the adopted Purbeck Local Plan Policy H14 restricts new homes in the Dorset National Landscape to principal residence use, but commercial holiday lets are explicitly exempt — still verify on your parcel.
Safety & tax — meet fire, gas, electrical, and EPC requirements per GOV.UK self-catering rules; declare income to HMRC.
What Should You Charge for Your Airbnb in Purbeck?
Smart Pricing Tools →Pricing is one of the most critical decisions for Airbnb success. Let's analyze the current pricing landscape and help you understand what rates you can realistically charge.
The current average daily rate in Purbeck is £193 per night. However, pricing varies significantly based on property quality and location. Here's what different property tiers typically charge:
Airbnb Pricing Tiers in Purbeck
Premium(Top 10%) | High-performing(Top 25%) | Average(Median) | Budget(Bottom 25%) |
|---|---|---|---|
| £301per night | £182per night | £121per night | £66per night |
*Top locations, big properties, premium amenities | *Good property management, highly rated | *Standard market performance | *Basic properties, less desirable locations |
Is It Profitable to Start an Airbnb in Purbeck?
Investment Analysis →Understanding the profitability potential is crucial for any Airbnb investment decision. Let's analyze the revenue performance and profit margins in the Purbeck market to help you make informed financial decisions.
Revenue Performance
Profitability Factors
Which Areas in Purbeck Are Most Profitable for Airbnb?
Explore All Areas →Purbeck spans 26 civil parishes — almost all active listings cluster on the coast and in Wareham gateway villages.
Top Performing Localities
Studland: The district’s inventory leader with 19 listings. Beach and heath access drives £77,329 average annual revenue at 64% occupancy — the benchmark for coastal Purbeck.
Swanage: The main resort town (466 listings) earns £40,658 with 62% occupancy. Pier, shops, and pier-side events keep summer weeks full.
West Lulworth: Smaller but premium — 113 listings averaging £56,774 thanks to Lulworth Cove and Durdle Door demand.
Coastal & Cliff-Top Markets
Corfe Castle: 93 listings blend steam-rail tourism with village charm; £44,983 revenue at 58% occupancy.
Arne: 33 listings on the Purbeck heaths — nature-first guests, strong shoulder-week appeal (£53,711, 68% occupancy).
Worth Matravers: Quiet cliff-path village (53 listings) with £58,281 for hosts who want lower churn and repeat walkers.
Family & Village Stays (Wareham gateway)
Wareham Town and Wareham St. Martin combine 39 + 27 listings as the A351 gateway to the coast — lower ADR than Studland but steadier shoulder occupancy for larger cottages.
Bere Regis: Inland (32 listings) with £49,076 — useful for investors priced out of the coast who still want Purbeck district exposure.
Explore Other Markets in England
Airbnb Occupancy Rates in Queen's Park, Greater London
City Of Westminster, England
9,797 Active Listings
Airbnb Occupancy Rates in Windermere And Bowness, Cumbria
Westmorland And Furness, England
849 Active Listings