Airbnb Occupancy Rates in Bristol, England(August 2026)
Bristol blends harbourside culture, Clifton suspension-bridge views, and festival weekends from Balloon Fiesta to street-art tourism, with tech and creative-industry mid-weeks filling flats near Temple Meads and the Harbourside. As of August 2026, the region averages £31,645 annual revenue per listing, 63% occupancy, and £138 ADR across 1,672 active listings, concentrated in City of Bristol with thin rural fringes outside the urban core. Model the neighbourhood or ward. Clifton, Harbourside, and Bedminster run different calendars than county-wide averages suggest.
Bristol Airbnb Market Map (August 2026)
Bristol Market Performance
Period: August 2025 - July 2026
Is Airbnb a Good Investment in Bristol?
YES. Bristol suits hosts who want South West urban demand with festival and creative-industry calendars, provided you buy in a proven ward and confirm planning with Bristol City Council.
Who tends to invest well
- Walkable Harbourside or Clifton flats for weekend city breaks and Balloon Fiesta overflow weeks.
- Operators comfortable with temple-quarter event noise and apartment-block short-stay rules.
- Buyers comparing 1,672 listings against Cornwall coast seasonality before committing to urban stock.
Stronger fit elsewhere
- Cornwall for hosts who want 17,985 coastal listings and school-holiday beach weeks as the main calendar driver.
- Wiltshire for Salisbury Plain and Cotswolds-edge cottages at £33,697 county-wide revenue.
- Buyers who cannot confirm lease restrictions in harbourside apartment schemes before exchange.
| Market | Avg revenue | Occupancy | ADR |
|---|---|---|---|
| Bristol | £31,645 | 63% | £138 |
| Cornwall | £35,526 | 59% | £164 |
| Greater Manchester | £24,774 | 53% | £128 |
| Wiltshire | £33,697 | 57% | £161 |
| City of Bristol | £31,613 | 63% | £138 |
Bristol pairs leisure weekends with mid-week professional demand. Cornwall posts £164 typical ADR on coastal stock with stronger summer peaks and thinner mid-week corporate traffic than Harbourside flats.
Get Live Bristol Market Intelligence
Discover detailed Bristol Airbnb Analytics and explore real-time market data to make accurate investment decisions.
Explore Real-time Analytics
How Often Will Your Airbnb Be Booked in Bristol?
View Demand Patterns →Occupancy rates directly impact your revenue potential. Understanding demand patterns helps you set realistic expectations and optimize your availability strategy.
The current average occupancy rate in Bristol is 63%, meaning properties are booked for about 229 nights per year. However, occupancy varies significantly based on property quality and management. Here's what you can expect:
Airbnb Occupancy Tiers in Bristol
Premium(Top 10%) | High-performing(Top 25%) | Average(Median) | Low-performing(Bottom 25%) |
|---|---|---|---|
| 94% | 80% | 60% | 29% |
*High desirability & optimized availability | *Good market fit & guest satisfaction | *Standard market performance | *Higher vacancy, optimization needed |
Seasonal Occupancy Patterns in Bristol
April, August
Highest demand and occupancy rates. Perfect for premium pricing strategies and maximizing revenue. Consider longer minimum stays and higher rates.
November, October
Moderate demand with balanced pricing opportunities. Good for attracting budget-conscious travelers while maintaining reasonable occupancy rates.
January, December
Lower demand requires competitive pricing and creative marketing. Focus on local events, extended stay discounts, and targeting specific traveler segments.
How Much Can You Earn with Airbnb in Bristol?
Calculate Earnings →One of the most common questions for potential Airbnb hosts in Bristol is about earning potential. Let's break down the revenue patterns and what you can realistically expect to earn.
Monthly Revenue Trends in Bristol
Best-in-class Airbnb properties (top 10%) in Bristol achieve around £40,565 annually, while strong performers (top 25%) earn at least £28,173. Typical properties generate about £16,885 per year, and entry-level listings (bottom 25%) see earnings near £5,717, often with room for optimization. Keep in mind, these are market averages—your actual earnings can be even higher depending on your property's location, bedrooms, guest capacity, and unique amenities.
Want to see how your listing could perform? Create a free account to unlock personalized analytics and explore exclusive insights in our app!
What Can You Learn from Top-Performing Airbnbs in Bristol?
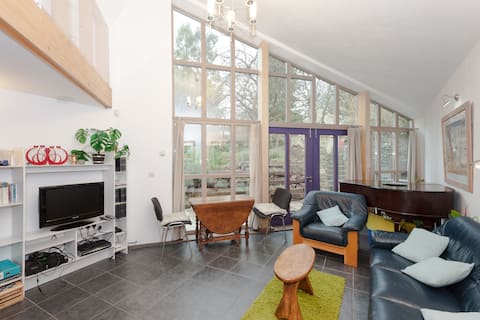
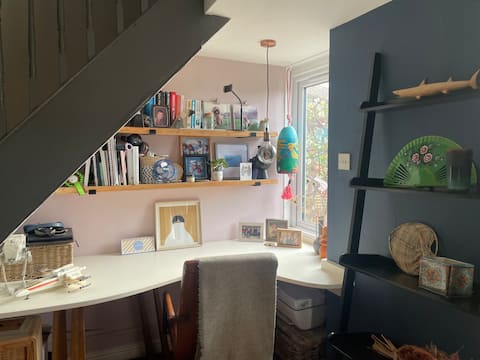
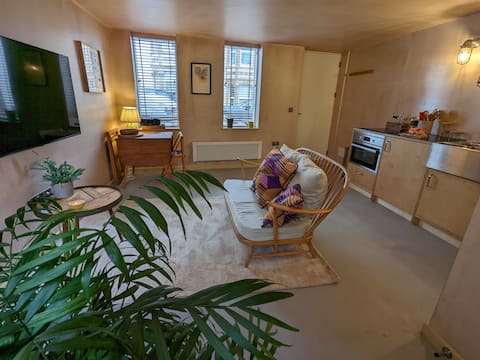
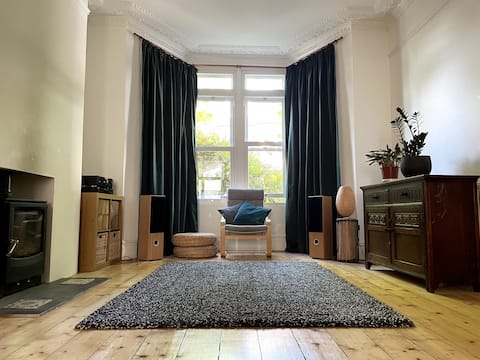
View Top Performers →Studying successful properties provides valuable insights for your own Airbnb strategy. Here are the top-performing listings in Bristol and what makes them successful.
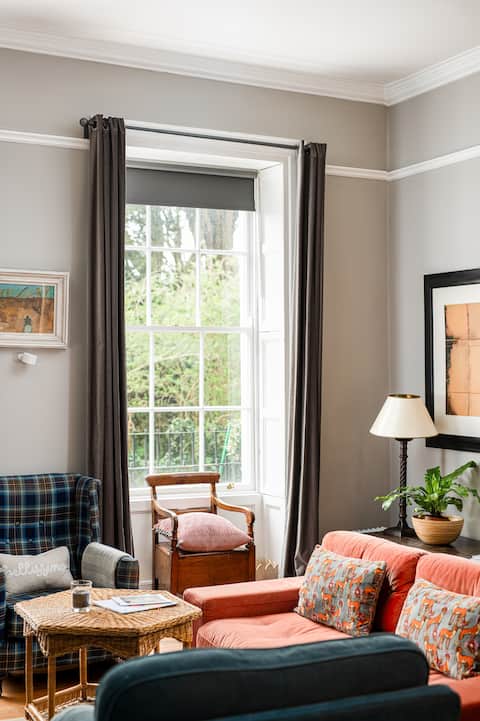
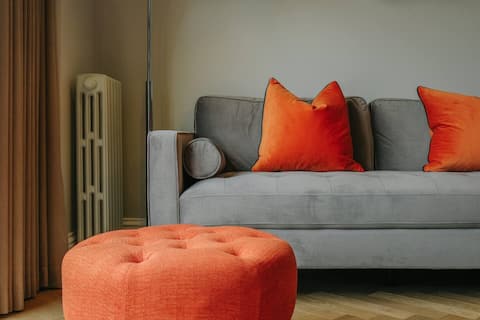
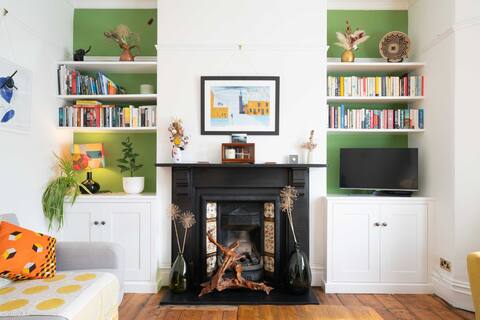
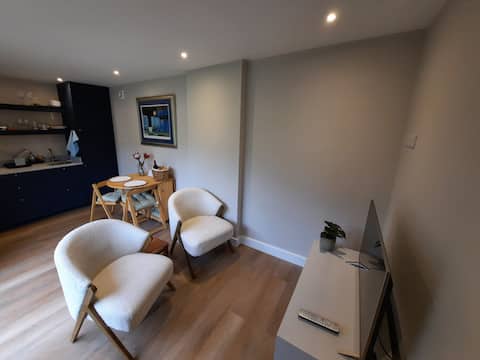
Bristol Market Analysis
Common assumptions
Bristol is often reduced to Balloon Fiesta photo spots, but most regional revenue comes from City of Bristol urban tourism, Temple Meads business travel, and creative-industry mid-stays that run Monday–Thursday alongside weekend Harbourside dining. Hosts who treat Bristol like a pure summer resort underestimate how much 63% is earned on conference weeks, university open days, and tech-contractor bookings outside school holidays.
What the numbers show
1,661 listings inside the city unitary authority average £31,613 with 63% occupancy, the default research starting point on this regional page. Wiltshire adds 2,358 listings at £33,697 for Stonehenge and Salisbury Plain day-trip spillover, while Greater Manchester posts £24,774 on 4,424 listings as a northern metro comparator. Clifton and Harbourside flats hold ADR on festival weekends; Bedminster and Stokes Croft stock trades slightly lower nightly rates for longer mid-week creative-industry stays.
Operational reality
Parking and hills beat square footage in Clifton. Guests arriving by car need honest permit or NCP guidance before booking. Harbourside apartments must manage event-week noise and waste logistics when festivals pack the waterfront. Underwrite a full-year model. August Balloon Fiesta weeks spike ADR, and £138 region-wide still depends on spring and autumn business travel that coastal counties like Cornwall capture differently.
What Are the Airbnb Regulations in Bristol?
Understanding local regulations is crucial for operating a successful Airbnb. Let's examine the compliance landscape and what you need to know about licensing requirements in Bristol.
Current Regulatory Status
No properties have proper licensing in this market, indicating minimal regulatory enforcement.
Before listing
Confirm planning status with Bristol City Council. Whole-property short-term letting may need permission depending on use class and Article 4 directions. Use the Planning Portal or apply for a Lawful Development Certificate if you need certainty.
Check lease and freeholder rules. Harbourside and city-centre apartment schemes often restrict short lets. Read the management-company policy before exchange.
First booking
Fire and guest safety. Paying-guest accommodation must meet fire, gas, electrical, and EPC standards under England’s self-catering rules.
Business rates screening. Self-catering available 140+ days/year and let 70+ days in 12 months may move the property to business rates (same GOV.UK guidance).
Ongoing compliance
National STR registration. Track GOV.UK registration scheme guidance for upcoming host duties.
Tax, waste and event noise. Declare income to HMRC; confirm commercial waste rules with Bristol City Council; manage festival-week guest communication when Harbourside events affect access and noise.
What Should You Charge for Your Airbnb in Bristol?
Smart Pricing Tools →Pricing is one of the most critical decisions for Airbnb success. Let's analyze the current pricing landscape and help you understand what rates you can realistically charge.
The current average daily rate in Bristol is £138 per night. However, pricing varies significantly based on property quality and location. Here's what different property tiers typically charge:
Airbnb Pricing Tiers in Bristol
Premium(Top 10%) | High-performing(Top 25%) | Average(Median) | Budget(Bottom 25%) |
|---|---|---|---|
| £201per night | £145per night | £105per night | £68per night |
*Top locations, big properties, premium amenities | *Good property management, highly rated | *Standard market performance | *Basic properties, less desirable locations |
Is It Profitable to Start an Airbnb in Bristol?
Investment Analysis →Understanding the profitability potential is crucial for any Airbnb investment decision. Let's analyze the revenue performance and profit margins in the Bristol market to help you make informed financial decisions.
Revenue Performance
Profitability Factors
Which Areas in Bristol Are Most Profitable for Airbnb?
Explore All Areas →Bristol region short-stay demand concentrates in City of Bristol urban wards. 1,661 listings carry most of the £31,645 regional story, with neighbouring counties offering contrast for hosts comparing South West positioning.
Harbourside & city core
- City of Bristol: 1,661 listings averaging £31,613 at 63% occupancy. Harbourside culture, Temple Meads rail access, and festival weekends anchor regional revenue.
Clifton suspension-bridge views and Harbourside warehouse conversions command premium ADR on balloon-fiesta and summer weekends when listings spell out parking reality and stair access. Flats with lift service near Millennium Square outperform terrace houses marketed to guests who expect suburban driveways.
South West comparators
Cornwall: 17,985 listings at £35,526. Coastal school-holiday volume with steadier mid-week corporate demand in Bristol urban stock.
Wiltshire: 2,358 listings earning £33,697. Salisbury Plain and Cotswolds-edge cottages for hosts who want countryside exposure near Bristol day trips.
Greater Manchester: 4,424 listings at £24,774. Northern metro scale for investors comparing festival-and-arena calendars against Bristol’s South West brand.
Bath & Somerset fringe
Guests often pair Bristol weekends with Bath spa breaks. Hosts on the Bristol side should market honest GWR train times and park-and-ride options for guests planning both city centres on the same trip.
Explore Other Markets in England
Airbnb Occupancy Rates in Queen's Park, Greater London
City Of Westminster, England
9,875 Active Listings
Airbnb Occupancy Rates in Windermere And Bowness, Cumbria
Westmorland And Furness, England
853 Active Listings