Airbnb Occupancy Rates in Fortaleza, Ceará(September 2026)
Fortaleza is the gateway to urban beaches and Ceará destinations—Beira Mar, Praia de Iracema, and waterfront districts concentrate most short-term rental demand in the city.
City averages in September 2026 sit at R$67,207 annual revenue per listing, 62% occupancy, R$296 nightly rate, and 3,750 active listings. The market rewards ocean-view or true Beira Mar proximity, salt-resistant linens, and AC sized for heat year-round.
Out-of-state investors buy here for year-round sun; local operators compete on price and response speed—whoever combines both captures last-minute bookings when cheap flights fill the city.
Fortaleza Airbnb Market Map (September 2026)
Fortaleza Market Performance
Period: January 2026 - August 2026
Is Airbnb a Good Investment in Fortaleza?
YES — Fortaleza works for an urban-beach thesis with lower acquisition cost than Rio, provided you accept lower average ADR and invest in salt-air maintenance.
Who tends to invest well
- Buyers focused on the waterfront (Meireles, Aldeota, Praia de Iracema)
- Operators selling city + Jericoacoara/Canoa Quebrada day-trip packages
- Hosts with a fast local cleaning team
Stronger fit elsewhere
- Premium beachfront ADR theses map to Rio de Janeiro
- Large-scale corporate operations include São Paulo
| Market | Revenue | Occupancy | Role |
|---|---|---|---|
| Fortaleza | R$67,207 | 62% | NE beach capital |
| Salvador | R$58,572 | 51% | Culture + BA coast |
| Rio de Janeiro | R$116,401 | 62% | Premium SE beachfront |
| São Paulo | R$58,259 | 60% | Corporate hub |
Get Live Fortaleza Market Intelligence
Discover detailed Fortaleza Airbnb Analytics and explore real-time market data to make accurate investment decisions.
Explore Real-time Analytics
How Often Will Your Airbnb Be Booked in Fortaleza?
View Demand Patterns →Occupancy rates directly impact your revenue potential. Understanding demand patterns helps you set realistic expectations and optimize your availability strategy.
The current average occupancy rate in Fortaleza is 62%, meaning properties are booked for about 227 nights per year. However, occupancy varies significantly based on property quality and management. Here's what you can expect:
Airbnb Occupancy Tiers in Fortaleza
Premium(Top 10%) | High-performing(Top 25%) | Average(Median) | Low-performing(Bottom 25%) |
|---|---|---|---|
| 91% | 79% | 53% | 14% |
*High desirability & optimized availability | *Good market fit & guest satisfaction | *Standard market performance | *Higher vacancy, optimization needed |
Seasonal Occupancy Patterns in Fortaleza
June, August
Highest demand and occupancy rates. Perfect for premium pricing strategies and maximizing revenue. Consider longer minimum stays and higher rates.
January, March
Moderate demand with balanced pricing opportunities. Good for attracting budget-conscious travelers while maintaining reasonable occupancy rates.
December, November
Lower demand requires competitive pricing and creative marketing. Focus on local events, extended stay discounts, and targeting specific traveler segments.
How Much Can You Earn with Airbnb in Fortaleza?
Calculate Earnings →One of the most common questions for potential Airbnb hosts in Fortaleza is about earning potential. Let's break down the revenue patterns and what you can realistically expect to earn.
Monthly Revenue Trends in Fortaleza
Best-in-class Airbnb properties (top 10%) in Fortaleza achieve around R$99,926 annually, while strong performers (top 25%) earn at least R$70,916. Typical properties generate about R$39,891 per year, and entry-level listings (bottom 25%) see earnings near R$7,820, often with room for optimization. Keep in mind, these are market averages—your actual earnings can be even higher depending on your property's location, bedrooms, guest capacity, and unique amenities.
Want to see how your listing could perform? Create a free account to unlock personalized analytics and explore exclusive insights in our app!
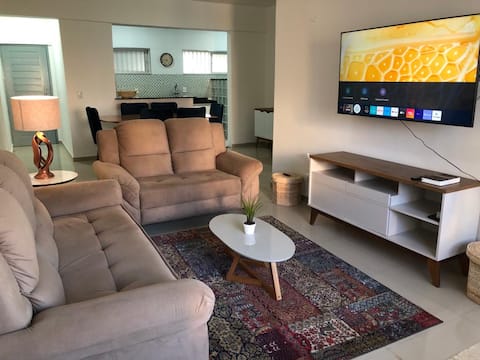
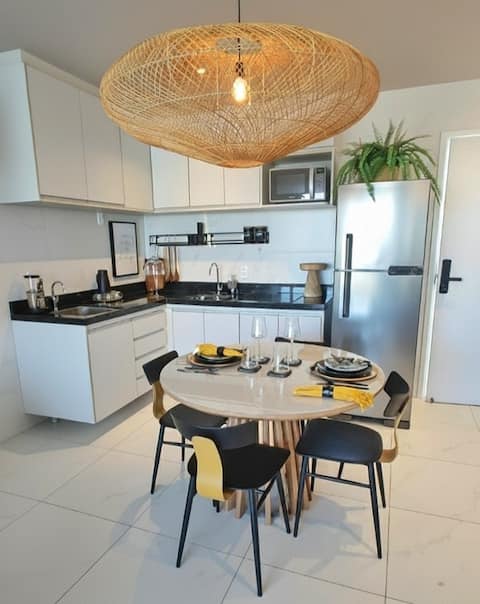
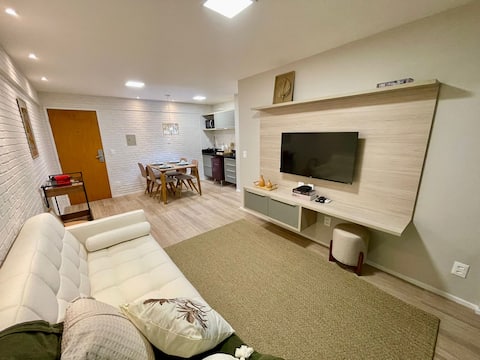
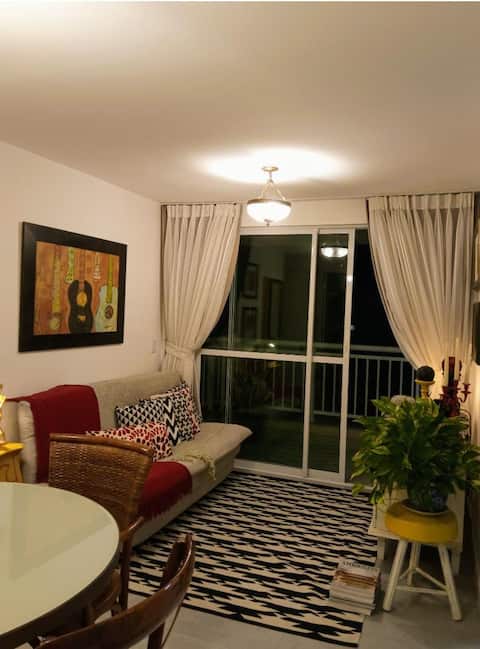
What Can You Learn from Top-Performing Airbnbs in Fortaleza?
View Top Performers →Studying successful properties provides valuable insights for your own Airbnb strategy. Here are the top-performing listings in Fortaleza and what makes them successful.
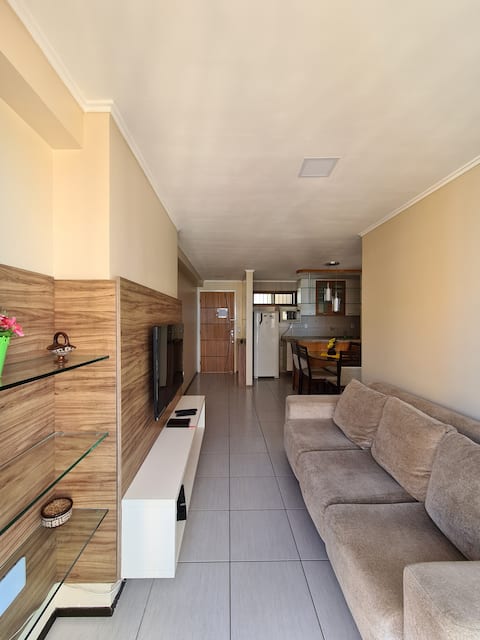
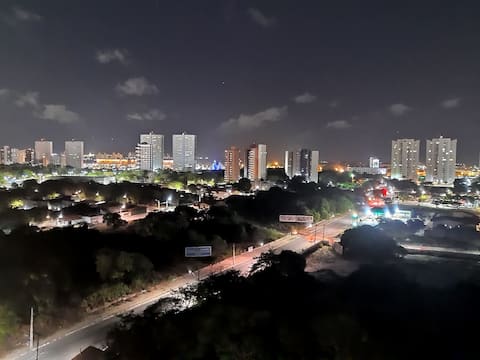
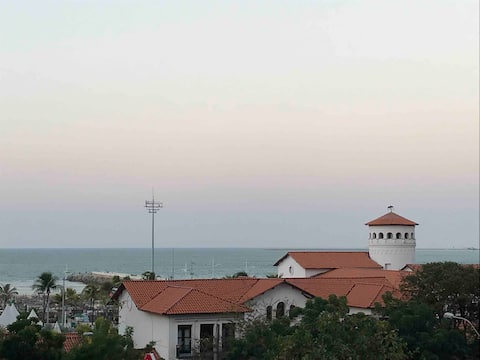
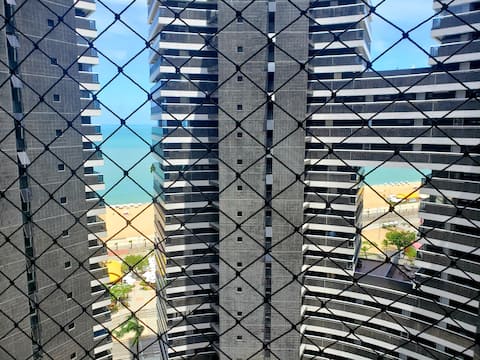
Fortaleza Market Analysis
Demand overview
Domestic family tourism from the South/Southeast in winter (escaping cold) and extended holidays. Events at the Ceará Events Center and corporate travel fill the calendar outside January/July school peaks.
Seasonality
March–May rains reduce full-beach days—adjust photos and copy for urban experience. July and December are peaks; price early.
Linens and maintenance
Salt air corrodes hardware and appliances—budget above the national average. A balcony with ocean view justifies higher ADR on Beira Mar.
What Are the Airbnb Regulations in Fortaleza?
Understanding local regulations is crucial for operating a successful Airbnb. Let's examine the compliance landscape and what you need to know about licensing requirements in Fortaleza.
Current Regulatory Status
No properties have proper licensing in this market, indicating minimal regulatory enforcement.
Do I need city registration?
Verify business registration and ISS with Fortaleza City Hall. Host-registry bills may take effect—confirm before scaling.
Can the condominium prohibit rentals?
Yes, when bylaws define exclusive residential use per STJ precedent. Read recent assembly minutes.
Foreign guests?
Keep records per condo rules and federal tourism guidance at gov.br/turismo.
Are short stays legal?
Yes, within Lei 8.245/1991 and local rules. A per-booking contract documents price, term, and responsibilities.
Income tax?
Declare revenue; multiple units typically require CNPJ—consult an accountant.
What Should You Charge for Your Airbnb in Fortaleza?
Smart Pricing Tools →Pricing is one of the most critical decisions for Airbnb success. Let's analyze the current pricing landscape and help you understand what rates you can realistically charge.
The current average daily rate in Fortaleza is R$296 per night. However, pricing varies significantly based on property quality and location. Here's what different property tiers typically charge:
Airbnb Pricing Tiers in Fortaleza
Premium(Top 10%) | High-performing(Top 25%) | Average(Median) | Budget(Bottom 25%) |
|---|---|---|---|
| R$450per night | R$333per night | R$237per night | R$75per night |
*Top locations, big properties, premium amenities | *Good property management, highly rated | *Standard market performance | *Basic properties, less desirable locations |
Is It Profitable to Start an Airbnb in Fortaleza?
Investment Analysis →Understanding the profitability potential is crucial for any Airbnb investment decision. Let's analyze the revenue performance and profit margins in the Fortaleza market to help you make informed financial decisions.
Revenue Performance
Profitability Factors
Which Areas in Fortaleza Are Most Profitable for Airbnb?
Explore All Areas →Top-performing neighborhoods
- Meireles — R$82,834, 64%, 1,460 listings; Beira Mar core, ocean views, year-round flow.
- Praia do Futuro II — R$66,515, 58%; beach kiosks, families, and oceanfront apartments.
- Mucuripe — R$66,913, 62%; port, business, and central waterfront.
- Praia de Iracema — R$63,477, 66%; cultural scene, Dragão do Mar, urban tourism.
- Aldeota — R$58,475, 64%; corporate hub, malls, steadier calendar.
Beira Mar vs Praia do Futuro
Meireles and Mucuripe reward walkability and ocean view—salt-resistant linens and powerful AC are baseline. Praia do Futuro I (R$63,728, 59%) and Praia do Futuro II attract families seeking wide beach and kiosk culture; ADR rises with ocean-facing balconies.
Iracema, Cais do Porto, and Aldeota
Praia de Iracema and Cais do Porto (R$73,710, 66%) sell urban experience and nightlife—honest photos about noise and parking filter the right guests. Aldeota and Cocó (R$44,334, 63%) capture corporate travel and families who prefer tree-lined districts over the waterfront.
Explore Other Markets in Brazil
Airbnb Occupancy Rates in Rio De Janeiro, Rio De Janeiro
Rio De Janeiro, Brazil
32,318 Active Listings
Airbnb Occupancy Rates in Cabo Frio, Rio De Janeiro
Macae Rio Das Ostras Cabo Frio, Brazil
9,092 Active Listings