Airbnb Occupancy Rates in Illes Balears, Spain(July 2026)
- Annual revenue:€88,723 per listing
- Occupancy:70%
- ADR:€347
- Active listings:18,792
Illes Balears combines Palma capital-city culture, Mallorca beach-resort weeks, and Ibiza event-season demand — one of Spain’s highest-scrutiny regulatory environments for tourist housing.
Island and municipality matter more than the regional average; model Palma, Mallorca coast, or Ibiza separately.
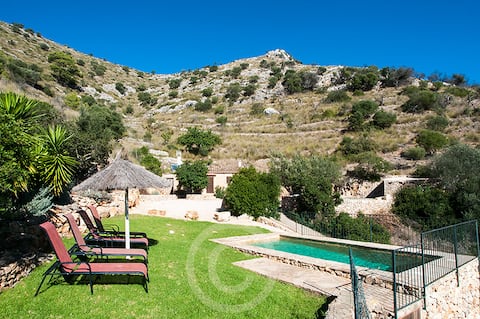
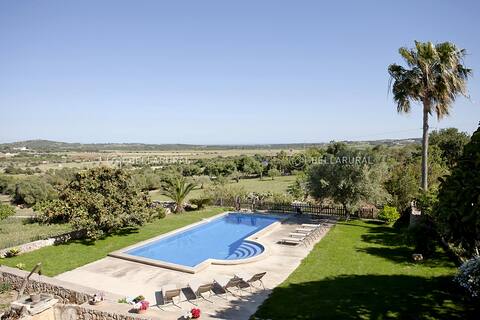
Illes Balears Airbnb Market Map (July 2026)
Illes Balears Market Performance
Period: July 2025 - June 2026
Is Airbnb a Good Investment in Illes Balears?
YES — Illes Balears suits experienced hosts who confirm Balearic licensing limits before exchange and still compete across island municipalities.
| Market | Revenue | Occupancy | vs Illes Balears |
|---|---|---|---|
| Illes Balears | €88,723 | 70% | Baseline (18,792 listings) |
| Palma | €88,746 | 73% | Capital city & airport hub |
| Catalunya | €46,597 | 62% | Mainland city-break scale |
| Canarias | €32,223 | 71% | Atlantic island alternative |
Get Live Illes Balears Market Intelligence
Discover detailed Illes Balears Airbnb Analytics and explore real-time market data to make accurate investment decisions.
Explore Real-time Analytics
How Often Will Your Airbnb Be Booked in Illes Balears?
View Demand Patterns →Occupancy rates directly impact your revenue potential. Understanding demand patterns helps you set realistic expectations and optimize your availability strategy.
The current average occupancy rate in Illes Balears is 70%, meaning properties are booked for about 256 nights per year. However, occupancy varies significantly based on property quality and management. Here's what you can expect:
Airbnb Occupancy Tiers in Illes Balears
Premium(Top 10%) | High-performing(Top 25%) | Average(Median) | Low-performing(Bottom 25%) |
|---|---|---|---|
| 96% | 73% | 45% | 22% |
*High desirability & optimized availability | *Good market fit & guest satisfaction | *Standard market performance | *Higher vacancy, optimization needed |
Seasonal Occupancy Patterns in Illes Balears
June, July
Highest demand and occupancy rates. Perfect for premium pricing strategies and maximizing revenue. Consider longer minimum stays and higher rates.
February, March
Moderate demand with balanced pricing opportunities. Good for attracting budget-conscious travelers while maintaining reasonable occupancy rates.
January, December
Lower demand requires competitive pricing and creative marketing. Focus on local events, extended stay discounts, and targeting specific traveler segments.
How Much Can You Earn with Airbnb in Illes Balears?
Calculate Earnings →One of the most common questions for potential Airbnb hosts in Illes Balears is about earning potential. Let's break down the revenue patterns and what you can realistically expect to earn.
Monthly Revenue Trends in Illes Balears
Best-in-class Airbnb properties (top 10%) in Illes Balears achieve around €99,015 annually, while strong performers (top 25%) earn at least €58,294. Typical properties generate about €28,509 per year, and entry-level listings (bottom 25%) see earnings near €10,279, often with room for optimization. Keep in mind, these are market averages—your actual earnings can be even higher depending on your property's location, bedrooms, guest capacity, and unique amenities.
Want to see how your listing could perform? Create a free account to unlock personalized analytics and explore exclusive insights in our app!
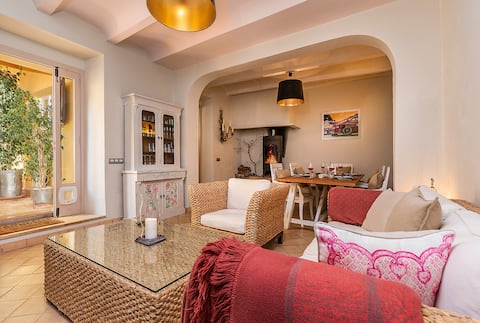
What Can You Learn from Top-Performing Airbnbs in Illes Balears?
View Top Performers →Studying successful properties provides valuable insights for your own Airbnb strategy. Here are the top-performing listings in Illes Balears and what makes them successful.


Illes Balears Market Analysis
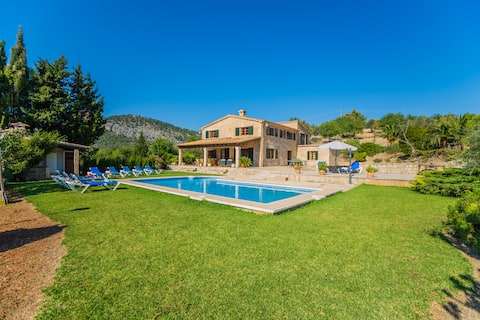
Buy — what works in Balearics STR
- Registered apartments in Palma old town with elevator access and honest parking copy
- Mallorca coast villas with pool maintenance budgets and airport transfer clarity
- Operators with legal counsel familiar with Balearic housing law changes
Avoid — common Balearics mistakes
- Unregistered tourist flats in Palma zones with active licensing moratoria
- Large Ibiza fincas without verified guest capacity and neighbour relations
- Assuming regional averages apply to Menorca’s quieter, family-oriented calendar
What Are the Airbnb Regulations in Illes Balears?
Understanding local regulations is crucial for operating a successful Airbnb. Let's examine the compliance landscape and what you need to know about licensing requirements in Illes Balears.
Current Regulatory Status
66% compliance indicates strict regulatory enforcement in this market.
Who should register: All short-stay hosts need Spain’s national tourist rental number via Ministerio de Industria, Comercio y Turismo plus Balearic regional compliance.
Private vs business hosts: Same national register; business operators must also meet VAT and invoicing rules with their tax adviser.
| Host type | National register | Balearic licence | Tourist tax |
|---|---|---|---|
| Private owner | MITUR portal | Govern Balear / municipal | Per island tariff |
| Professional manager | MITUR portal | Govern Balear / municipal | Per island tariff |
Review Govern de les Illes Balears housing and tourism guidance — Balearic Law limits tourist places in many zones.
How Competitive is the Airbnb Market in Illes Balears?
Analyze Competition →Understanding market competition is crucial for any potential Airbnb host. Let's examine the supply dynamics and what they mean for your investment strategy. The Illes Balears Airbnb market currently features 18,792 active listings with an average occupancy rate of 70%. This represents a highly competitive market environment where strong demand supports premium pricing.
Airbnb Listings: Change Over Time
Strategic Entry into Illes Balears Airbnb Market
Competitive Positioning
- Target premium segment with high-quality amenities
- Emphasize unique features and exceptional service
- Position as luxury accommodation option
Market Opportunities
- Strong demand supports premium pricing strategies
- Stable market provides predictable investment returns
- Established market with proven demand patterns
What Should You Charge for Your Airbnb in Illes Balears?
Smart Pricing Tools →Pricing is one of the most critical decisions for Airbnb success. Let's analyze the current pricing landscape and help you understand what rates you can realistically charge.
The current average daily rate in Illes Balears is €347 per night. However, pricing varies significantly based on property quality and location. Here's what different property tiers typically charge:
Airbnb Pricing Tiers in Illes Balears
Premium(Top 10%) | High-performing(Top 25%) | Average(Median) | Budget(Bottom 25%) |
|---|---|---|---|
| €506per night | €296per night | €146per night | €75per night |
*Top locations, big properties, premium amenities | *Good property management, highly rated | *Standard market performance | *Basic properties, less desirable locations |
Is It Profitable to Start an Airbnb in Illes Balears?
Investment Analysis →Understanding the profitability potential is crucial for any Airbnb investment decision. Let's analyze the revenue performance and profit margins in the Illes Balears market to help you make informed financial decisions.
Revenue Performance
Profitability Factors
Which Areas in Illes Balears Are Most Profitable for Airbnb?
Explore All Areas →Balearic demand splits across Palma, Mallorca resort coast, and Ibiza event towns.
Top performing towns & cities
Palma:591 listings at €88,746 and 73% occupancy — capital culture, airport gateway, and mid-stay demand.
Mallorca coast: Alcúdia, Calvià, and Sóller add summer beach weeks with heavy municipal licensing scrutiny.
Ibiza & Formentera: Event-season ADR spikes with stricter housing caps — verify current Govern Balear rules before purchase.
Explore Other Markets in Spain
Airbnb Occupancy Rates in Madrid, Comunidad De Madrid
Comunidad De Madrid, Spain
11,868 Active Listings
Airbnb Occupancy Rates in Valencia, Comunitat Valenciana
Valencia / Valencia, Spain
4,774 Active Listings
Airbnb Occupancy Rates in Torrevieja, Comunitat Valenciana
Alacant / Alicante, Spain
3,516 Active Listings