Airbnb Occupancy Rates in Lleida, Catalunya(July 2026)
Airbnbs in Lleida, Catalunya earn an average of €34,564 per year, with a typical occupancy rate of 43% and daily rates averaging €218. There were 2,142 listings published on Airbnb in July 2026.
This analysis will dive into the market dynamics, pricing strategies, and investment opportunities for short-term rental investors in Lleida, Spain.
Lleida Airbnb Market Map (July 2026)
Lleida Market Performance
Period: July 2025 - June 2026
Get Live Lleida Market Intelligence
Discover detailed Lleida Airbnb Analytics and explore real-time market data to make accurate investment decisions.
Explore Real-time Analytics
How Often Will Your Airbnb Be Booked in Lleida?
View Demand Patterns →Occupancy rates directly impact your revenue potential. Understanding demand patterns helps you set realistic expectations and optimize your availability strategy.
The current average occupancy rate in Lleida is 43%, meaning properties are booked for about 159 nights per year. However, occupancy varies significantly based on property quality and management. Here's what you can expect:
Airbnb Occupancy Tiers in Lleida
Premium(Top 10%) | High-performing(Top 25%) | Average(Median) | Low-performing(Bottom 25%) |
|---|---|---|---|
| 78% | 54% | 29% | 10% |
*High desirability & optimized availability | *Good market fit & guest satisfaction | *Standard market performance | *Higher vacancy, optimization needed |
Seasonal Occupancy Patterns in Lleida
July, February
Highest demand and occupancy rates. Perfect for premium pricing strategies and maximizing revenue. Consider longer minimum stays and higher rates.
April, May
Moderate demand with balanced pricing opportunities. Good for attracting budget-conscious travelers while maintaining reasonable occupancy rates.
November, October
Lower demand requires competitive pricing and creative marketing. Focus on local events, extended stay discounts, and targeting specific traveler segments.
How Much Can You Earn with Airbnb in Lleida?
Calculate Earnings →One of the most common questions for potential Airbnb hosts in Lleida is about earning potential. Let's break down the revenue patterns and what you can realistically expect to earn.
Monthly Revenue Trends in Lleida
Best-in-class Airbnb properties (top 10%) in Lleida achieve around €49,980 annually, while strong performers (top 25%) earn at least €27,703. Typical properties generate about €12,476 per year, and entry-level listings (bottom 25%) see earnings near €3,851, often with room for optimization. Keep in mind, these are market averages—your actual earnings can be even higher depending on your property's location, bedrooms, guest capacity, and unique amenities.
Want to see how your listing could perform? Create a free account to unlock personalized analytics and explore exclusive insights in our app!
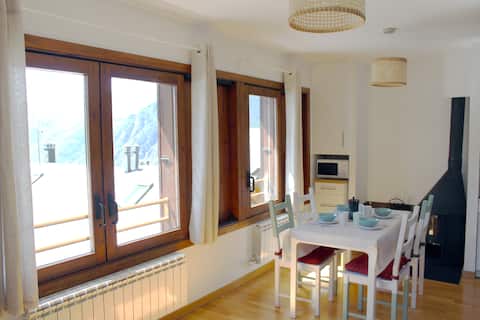
What Can You Learn from Top-Performing Airbnbs in Lleida?
View Top Performers →Studying successful properties provides valuable insights for your own Airbnb strategy. Here are the top-performing listings in Lleida and what makes them successful.
How Competitive is the Airbnb Market in Lleida?
Analyze Competition →Understanding market competition is crucial for any potential Airbnb host. Let's examine the supply dynamics and what they mean for your investment strategy. The Lleida Airbnb market currently features 2,142 active listings with an average occupancy rate of 43%. This represents a highly competitive market environment where balanced supply and demand create opportunities for strategic positioning.
Airbnb Listings: Change Over Time
Strategic Entry into Lleida Airbnb Market
Competitive Positioning
- Focus on mid-market with competitive pricing
- Emphasize unique features and exceptional service
- Position as luxury accommodation option
Market Opportunities
- High vacancy rates indicate room for new quality listings
- Stable market provides predictable investment returns
- Established market with proven demand patterns
What Should You Charge for Your Airbnb in Lleida?
Smart Pricing Tools →Pricing is one of the most critical decisions for Airbnb success. Let's analyze the current pricing landscape and help you understand what rates you can realistically charge.
The current average daily rate in Lleida is €218 per night. However, pricing varies significantly based on property quality and location. Here's what different property tiers typically charge:
Airbnb Pricing Tiers in Lleida
Premium(Top 10%) | High-performing(Top 25%) | Average(Median) | Budget(Bottom 25%) |
|---|---|---|---|
| €367per night | €228per night | €128per night | €51per night |
*Top locations, big properties, premium amenities | *Good property management, highly rated | *Standard market performance | *Basic properties, less desirable locations |
Is It Profitable to Start an Airbnb in Lleida?
Investment Analysis →Understanding the profitability potential is crucial for any Airbnb investment decision. Let's analyze the revenue performance and profit margins in the Lleida market to help you make informed financial decisions.
Revenue Performance
Profitability Factors
What Are the Airbnb Regulations in Lleida?
Understanding local regulations is crucial for operating a successful Airbnb. Let's examine the compliance landscape and what you need to know about licensing requirements in Lleida.
Current Regulatory Status
85% of properties are licensed, demonstrating very strict regulatory compliance.
Key Regulatory Requirements
Stringent licensing requirements, frequent inspections, and comprehensive safety standards.
- Registration numbers must be displayed on listings
- Hosts must comply with local zoning laws
- Tax collection and reporting obligations apply
- Safety standards and insurance requirements must be met
Compliance Benefits
Maximum compliance ensures premium market positioning and long-term stability.
- Avoid fines and legal issues
- Build trust with guests and neighbors
- Ensure long-term business sustainability
- Maintain listing visibility on platforms
Important: Regulations can change frequently, and requirements may vary by neighborhood. Always verify current requirements with local authorities before starting your Airbnb business.
Which Areas in Lleida Are Most Profitable for Airbnb?
Explore All Areas →Not all areas within Lleida perform equally. Let's analyze the performance of different neighborhoods to help you identify the most lucrative locations for your Airbnb investment.
Bellver De Cerdanya
Sort
Esterri D'àneu
Alt àneu
La Baronia De Rialb
Rialb
Odèn
Coll De Nargó
Lladurs
Tremp
Navès
Camarasa
Les
Les Valls D'aguilar
Artesa De Segre
Lleida
Espot
La Coma I La Pedra
Llavorsí
Solsona
Bossòst
La Guingueta D'àneu
Àger
Es Bòrdes
Balaguer
Sant Llorenç De Morunys
Baix Pallars
El Pont De Suert
Montferrer I Castellbò
Soriguera
La Seu D'urgell
Montellà I Martinet
Vilaller
La Torre De Cabdella
La Pobla De Segur
Sarroca De Bellera
Foradada
View All 50 submarkets
Get complete profitability analysis and investment ROI for every neighborhood.
Start Free AnalysisExplore Other Markets in Spain
Airbnb Occupancy Rates in Madrid, Comunidad De Madrid
Comunidad De Madrid, Spain
11,868 Active Listings
Airbnb Occupancy Rates in Valencia, Comunitat Valenciana
Valencia / Valencia, Spain
4,774 Active Listings
Airbnb Occupancy Rates in Torrevieja, Comunitat Valenciana
Alacant / Alicante, Spain
3,516 Active Listings