Airbnb Occupancy Rates in City Of Nottingham, Nottinghamshire(August 2026)
Lace Market bars, Motorpoint Arena nights, and University of Nottingham open days share the same Nottingham calendar as Trent-side parents and BioCity contractors.
As of August 2026, the city averages £20,373 annual revenue per listing, 53% occupancy, and £106 ADR across 1,006 active listings. Castle and Hyson Green & Arboretum hold the deepest ward inventory. St. Ann’s and Radford serve dual-university mid-stays. Mapperley and Lenton & Wollaton East add terraces with parking within a short tram ride of the centre.
Underwrite the ward first. A Castle Quarter studio and a Bulwell house with a driveway are different products even when both sit inside the Nottingham average.
City Of Nottingham Airbnb Market Map (August 2026)
City Of Nottingham Market Performance
Period: August 2025 - July 2026
Is Airbnb a Good Investment in City Of Nottingham?
YES. City of Nottingham suits hosts who want East Midlands city demand with dual-university calendars, Lace Market nightlife, and tram-linked business travel, provided you confirm planning with Nottingham City Council and buy stock that matches the guest you can serve.
Nottingham works best if:
- You target Castle or St. Ann’s flats within walking distance of Nottingham station, the arena, or the Lace Market for weekend city breaks plus Monday–Thursday corporate stays.
- You have checked HMO and Article 4 rules on student-heavy streets in Radford and Lenton & Wollaton East before exchange.
- You are ready to price graduation weekends, term-time parents, and Motorpoint Arena nights as separate calendar products.
- You have compared Broxtowe and Rushcliffe on the Nottinghamshire landing before assuming every guest wants a city-centre postcode.
Birmingham offers denser NEC and ICC mid-weeks at national scale. Derbyshire Dales captures Peak District cottage demand that sometimes uses Nottingham as a rail hub. Nottingham’s edge is the pairing of two universities, a compact walkable core, and tram links that keep mid-week occupancy steadier than many comparable Midlands cities.
| Market | Avg revenue | Occupancy | Listings |
|---|---|---|---|
| City of Nottingham | £20,373 | 53% | 1,006 |
| Nottinghamshire | £23,400 | 54% | 2,146 |
| Broxtowe | £23,255 | 60% | 133 |
| Rushcliffe | £23,367 | 51% | 227 |
| Birmingham | £22,003 | 54% | 2,263 |
Confirm planning with Nottingham City Council before you list. England has no automatic 90-night cap outside Greater London; permission depends on material change of use, and many city-centre leases restrict sub-letting.
Who tends to invest well
- Hosts buying Castle or Hyson Green & Arboretum flats with lift access, fast Wi-Fi, and honest Lace Market noise disclaimers.
- Operators with Mapperley or Basford terraces who can compete on parking and tram times to the centre.
Stronger fit elsewhere
- Broxtowe for Beeston and university-fringe demand with suburban parking.
- Derbyshire Dales for cottage and walking-week calendars at £36,651 district revenue.
- Rushcliffe for West Bridgford family houses priced out of the Castle ward core.
Get Live City Of Nottingham Market Intelligence
Discover detailed City Of Nottingham Airbnb Analytics and explore real-time market data to make accurate investment decisions.
Explore Real-time Analytics
How Often Will Your Airbnb Be Booked in City Of Nottingham?
View Demand Patterns →Occupancy rates directly impact your revenue potential. Understanding demand patterns helps you set realistic expectations and optimize your availability strategy.
The current average occupancy rate in City Of Nottingham is 53%, meaning properties are booked for about 192 nights per year. However, occupancy varies significantly based on property quality and management. Here's what you can expect:
Airbnb Occupancy Tiers in City Of Nottingham
Premium(Top 10%) | High-performing(Top 25%) | Average(Median) | Low-performing(Bottom 25%) |
|---|---|---|---|
| 87% | 70% | 45% | 8% |
*High desirability & optimized availability | *Good market fit & guest satisfaction | *Standard market performance | *Higher vacancy, optimization needed |
Seasonal Occupancy Patterns in City Of Nottingham
August, September
Highest demand and occupancy rates. Perfect for premium pricing strategies and maximizing revenue. Consider longer minimum stays and higher rates.
November, October
Moderate demand with balanced pricing opportunities. Good for attracting budget-conscious travelers while maintaining reasonable occupancy rates.
January, February
Lower demand requires competitive pricing and creative marketing. Focus on local events, extended stay discounts, and targeting specific traveler segments.
How Much Can You Earn with Airbnb in City Of Nottingham?
Calculate Earnings →One of the most common questions for potential Airbnb hosts in City Of Nottingham is about earning potential. Let's break down the revenue patterns and what you can realistically expect to earn.
Monthly Revenue Trends in City Of Nottingham
Best-in-class Airbnb properties (top 10%) in City Of Nottingham achieve around £29,516 annually, while strong performers (top 25%) earn at least £19,602. Typical properties generate about £9,964 per year, and entry-level listings (bottom 25%) see earnings near £1,777, often with room for optimization. Keep in mind, these are market averages—your actual earnings can be even higher depending on your property's location, bedrooms, guest capacity, and unique amenities.
Want to see how your listing could perform? Create a free account to unlock personalized analytics and explore exclusive insights in our app!
What Can You Learn from Top-Performing Airbnbs in City Of Nottingham?
View Top Performers →Studying successful properties provides valuable insights for your own Airbnb strategy. Here are the top-performing listings in City Of Nottingham and what makes them successful.
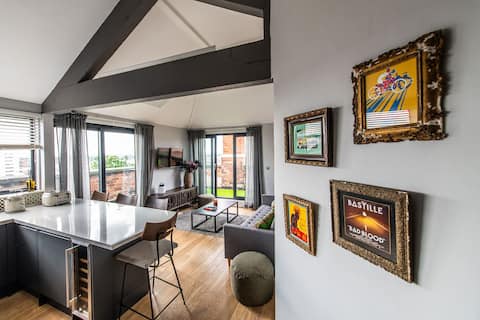
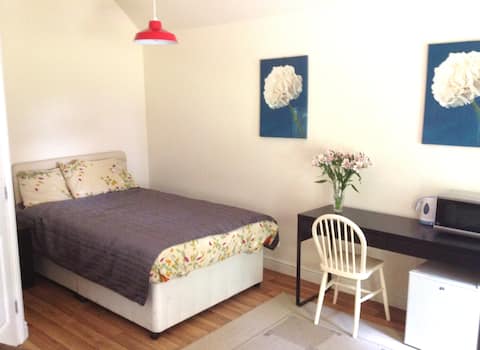
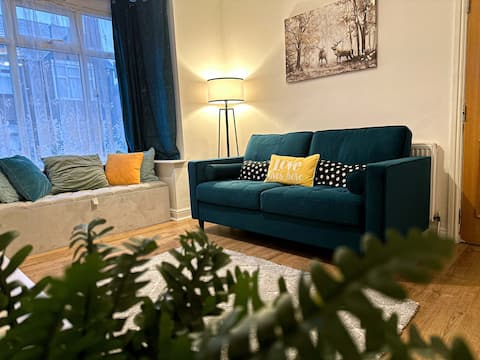
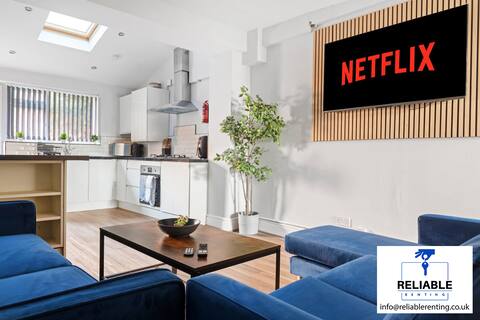
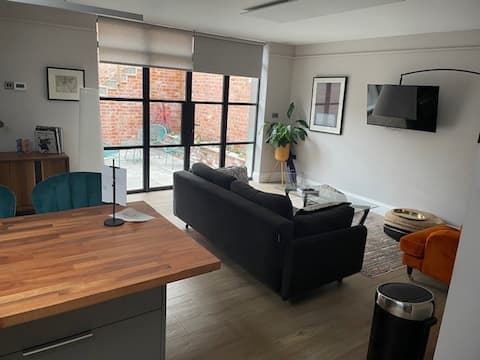
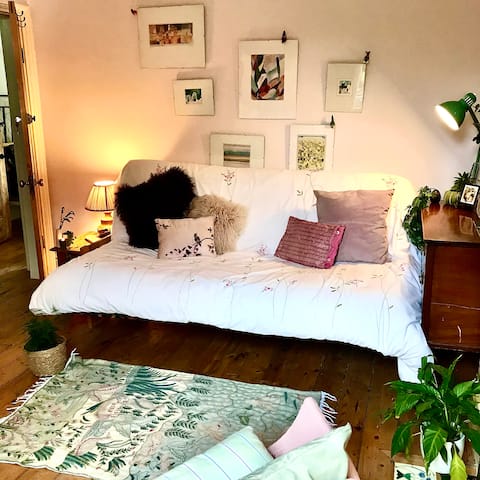
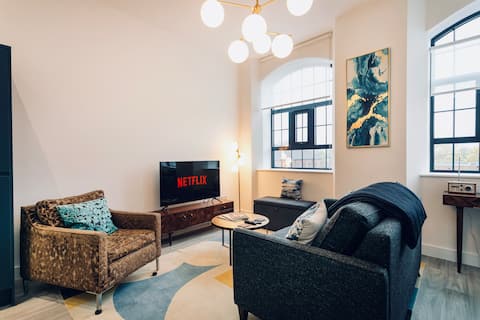
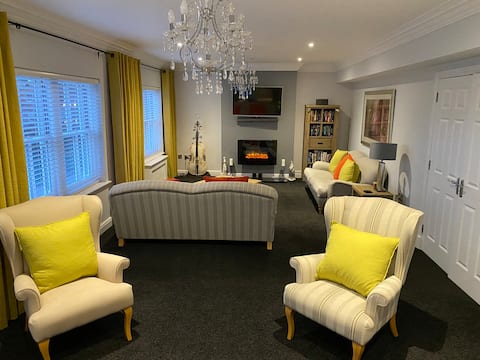
City Of Nottingham Market Analysis
Lace Market, the arena, and the university calendar
Nottingham’s short-stay demand clusters around the Castle ward core, dual-university term traffic, and Motorpoint Arena event nights. Castle (264 listings) absorbs Lace Market bar weekends, Nottingham Castle quarter sightseeing, and Monday–Thursday arrivals into the station. Hyson Green & Arboretum (134 listings) and St. Ann’s (117 listings) sit on the inner north-east approach with walkable independent cafes and a shorter hop to the Forest Recreation Ground event calendar than southern terraces.
Spring and autumn bring open days, dissertation-season extended stays, and the first run of arena concerts. Summer adds city-break leisure from the East Midlands rail network. Winter still fills when listings offer reliable heating, workspace, and invoice-ready hosting for BioCity and NHS contractor mid-weeks. Price graduation weekends separately from pure leisure weeks. A Castle one-bed that sells out on a Saturday arena night will not automatically fill a wet Tuesday in February without a desk and fast Wi-Fi in the listing photos.
Radford, Lenton, and the tram corridors
Radford (47 listings), Lenton & Wollaton East (55 listings), and Berridge (50 listings) serve University of Nottingham and NTU spillover with slightly lower weekend ADR than Castle but steadier mid-week calendars when the listing shows a real tram time to Old Market Square. Mapperley (76 listings) and Sherwood (22 listings) add leafy Victorian terraces for guests who want quiet bedrooms with a 15-minute bus to the Lace Market. Meadows (41 listings) and Clifton West cover the south-of-the-river parks and Trent-side footfall.
What Are the Airbnb Regulations in City Of Nottingham?
Understanding local regulations is crucial for operating a successful Airbnb. Let's examine the compliance landscape and what you need to know about licensing requirements in City Of Nottingham.
Current Regulatory Status
No properties have proper licensing in this market, indicating minimal regulatory enforcement.
Nottingham City Council handles planning and licensing for properties inside the city boundary. Start there before you list.
Whole-property short-term letting may require planning permission depending on prior use class, Article 4 directions, and whether the building is a house in multiple occupation. Nottingham has historically scrutinised concentrated student-area conversions. Check the council’s current short-stay and HMO guidance before exchange.
| Host type | Typical implication |
|---|---|
| Home sharer (spare room) | Often within permitted development if within council limits. Confirm current Nottingham SPD guidance. |
| Whole-property host | Planning permission may be required. Article 4 areas remove permitted development rights on student streets. |
| Professional operator | Business rates, fire safety, and registration duties apply at full commercial standard. |
Self-catering stock available 140+ days a year and actually let 70+ days may move onto business rates under GOV.UK self-catering rules. Track the forthcoming short-term let registration scheme. Declare income to HMRC. Confirm fire, gas, electrical, and EPC compliance for paying guests, and read lease or freeholder rules in apartment blocks before the first booking.
What Should You Charge for Your Airbnb in City Of Nottingham?
Smart Pricing Tools →Pricing is one of the most critical decisions for Airbnb success. Let's analyze the current pricing landscape and help you understand what rates you can realistically charge.
The current average daily rate in City Of Nottingham is £106 per night. However, pricing varies significantly based on property quality and location. Here's what different property tiers typically charge:
Airbnb Pricing Tiers in City Of Nottingham
Premium(Top 10%) | High-performing(Top 25%) | Average(Median) | Budget(Bottom 25%) |
|---|---|---|---|
| £155per night | £115per night | £82per night | £39per night |
*Top locations, big properties, premium amenities | *Good property management, highly rated | *Standard market performance | *Basic properties, less desirable locations |
Is It Profitable to Start an Airbnb in City Of Nottingham?
Investment Analysis →Understanding the profitability potential is crucial for any Airbnb investment decision. Let's analyze the revenue performance and profit margins in the City Of Nottingham market to help you make informed financial decisions.
Revenue Performance
Profitability Factors
Which Areas in City Of Nottingham Are Most Profitable for Airbnb?
Explore All Areas →Nottingham’s 1,006 listings now spread across 20 electoral wards. The city average of £20,373 blends a dense Castle core with tram-linked inner wards and quieter northern and western residential belts. Rank the wards below by inventory first, then compare occupancy and nightly rates on each ward page.
Top Performing Neighborhoods
Castle: 264 listings averaging £23,878 at 57% occupancy. Lace Market, Nottingham station, and the arena corridor concentrate here. Lift access and a stated walking time to the station outperform generic “city centre” titles.
Hyson Green & Arboretum: 134 listings at £16,355 with 50% occupancy. Inner north-west streets with Arboretum park access and walkable multicultural high streets.
St. Ann’s: 117 listings earning £19,129 at 47% occupancy. Inner north-east terraces with a shorter walk to the Creative Quarter than southern suburbs.
Mapperley: 76 listings at £15,344 and 45% occupancy. Elevated residential streets with family city-break demand and parking.
Berridge: 50 listings averaging £17,569. Inner north terraces linking Radford student traffic with Mapperley residential calm.
Lenton & Wollaton East: 55 listings at £24,445 with 52% occupancy. University of Nottingham fringe with larger houses and driveways.
Castle core and Lace Market
Castle is the default research starting point on this page: station arrivals, arena events, and Lace Market nightlife. Converted warehouses and modern blocks with lifts, reliable heating, and honest weekend noise notes hold reviews through winter. Allocated parking is scarce, so listings that explain the nearest tram stop or NCP convert better than listings that promise “free parking” without detail.
Universities and inner north
Radford (47 listings, £17,410 revenue), Lenton & Wollaton East, and Dales (49 listings) serve term-time parents, dissertation-season stays, and mid-week contractors linked to the universities and QMC. Confirm HMO and Article 4 status on the exact street before exchange. Basford (33 listings) and Sherwood add tram-linked residential stock north of the core.
South, west, and outer wards
Meadows (41 listings), Clifton West (14 listings), Aspley (26 listings), Bestwood (15 listings), and Wollaton West (11 listings) serve guests who want lower entry prices with bus or tram links into the Lace Market. Bulwell and Bulwell Forest sit on the northern belt with more parking and family-oriented city breaks.
Nottinghamshire peers
Hosts comparing the city should also read Broxtowe (133 listings, £23,255 revenue), Rushcliffe (227 listings), Gedling, and the Nottinghamshire region page before fixing on a ward alone.
Explore Other Markets in England
Airbnb Occupancy Rates in Queen's Park, Greater London
City Of Westminster, England
9,875 Active Listings
Airbnb Occupancy Rates in Windermere And Bowness, Cumbria
Westmorland And Furness, England
853 Active Listings