Airbnb Occupancy Rates in Birmingham, West Midlands(September 2026)
Conference, arena & NEC demand
Birmingham’s short-term rental calendar runs on ICC congress weeks, Utilita Arena concerts, and NEC exhibition traffic at the airport fringe, plus Midlands city-break weekends when guests want canals, Jewellery Quarter dining, and New Street rail links. City Centre flats fill on business mid-weeks. Sutton Coldfield offers suburban houses with parking and gardens and a longer commute to the core.
Midlands hub metrics
As of September 2026, the borough records £22,289 average annual revenue, 55% occupancy, and £112 ADR across 2,291 active listings. 602 listings sit in City Centre alone, enough depth to compare neighborhoods before you match the Birmingham average. Coastal counties such as Cornwall run a different seasonal calendar.
Birmingham Airbnb Market Map (September 2026)
Birmingham Market Performance
Period: September 2025 - August 2026
Is Airbnb a Good Investment in Birmingham?
YES. Birmingham rewards hosts who underwrite a specific neighborhood and compete on parking, lift access, and honest NEC or arena transfer times across 2,291 active listings.
Who tends to invest well
- Buyers targeting City Centre or Jewellery Quarter apartments within walking distance of New Street or tram links for business mid-weeks and concert weekends.
- Operators comfortable with West Midlands combined-authority planning checks and apartment block short-stay rules.
- Hosts comparing Midlands scale against Worcestershire countryside yields before committing to urban stock.
Stronger fit elsewhere
- Cornwall for hosts who want surf-and-beach seasonality as the main booking driver.
- Worcestershire for Malvern Hills spa breaks and Cotswolds-edge cottages at £32,245 county-wide revenue.
- Buyers who cannot confirm lease, freeholder, and building-management short-let policies before exchange.
| Market | Avg revenue | Occupancy | Listings |
|---|---|---|---|
| Birmingham | £22,289 | 55% | 2,291 |
| City Centre | £22,501 | 56% | 602 |
| Manchester | £27,146 | 53% | 1,979 |
| Bristol | £31,380 | 63% | 1,693 |
| Worcestershire | £32,245 | 58% | 1,608 |
Digbeth & Eastside posts £25,414 on 324 listings for NEC-adjacent and creative-quarter demand. Worcestershire trades urban ADR for countryside cottages when guests want hills and market towns over Jewellery Quarter weekends.
Get Live Birmingham Market Intelligence
Discover detailed Birmingham Airbnb Analytics and explore real-time market data to make accurate investment decisions.
Explore Real-time Analytics
How Often Will Your Airbnb Be Booked in Birmingham?
View Demand Patterns →Occupancy rates directly impact your revenue potential. Understanding demand patterns helps you set realistic expectations and optimize your availability strategy.
The current average occupancy rate in Birmingham is 55%, meaning properties are booked for about 199 nights per year. However, occupancy varies significantly based on property quality and management. Here's what you can expect:
Airbnb Occupancy Tiers in Birmingham
Premium(Top 10%) | High-performing(Top 25%) | Average(Median) | Low-performing(Bottom 25%) |
|---|---|---|---|
| 88% | 70% | 41% | 1% |
*High desirability & optimized availability | *Good market fit & guest satisfaction | *Standard market performance | *Higher vacancy, optimization needed |
Seasonal Occupancy Patterns in Birmingham
September, August
Highest demand and occupancy rates. Perfect for premium pricing strategies and maximizing revenue. Consider longer minimum stays and higher rates.
March, November
Moderate demand with balanced pricing opportunities. Good for attracting budget-conscious travelers while maintaining reasonable occupancy rates.
January, December
Lower demand requires competitive pricing and creative marketing. Focus on local events, extended stay discounts, and targeting specific traveler segments.
How Much Can You Earn with Airbnb in Birmingham?
Calculate Earnings →One of the most common questions for potential Airbnb hosts in Birmingham is about earning potential. Let's break down the revenue patterns and what you can realistically expect to earn.
Monthly Revenue Trends in Birmingham
Best-in-class Airbnb properties (top 10%) in Birmingham achieve around £30,391 annually, while strong performers (top 25%) earn at least £20,251. Typical properties generate about £9,622 per year, and entry-level listings (bottom 25%) see earnings near £197, often with room for optimization. Keep in mind, these are market averages—your actual earnings can be even higher depending on your property's location, bedrooms, guest capacity, and unique amenities.
Want to see how your listing could perform? Create a free account to unlock personalized analytics and explore exclusive insights in our app!
What Can You Learn from Top-Performing Airbnbs in Birmingham?
View Top Performers →Studying successful properties provides valuable insights for your own Airbnb strategy. Here are the top-performing listings in Birmingham and what makes them successful.
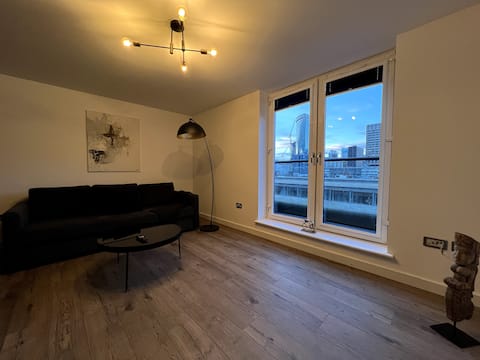
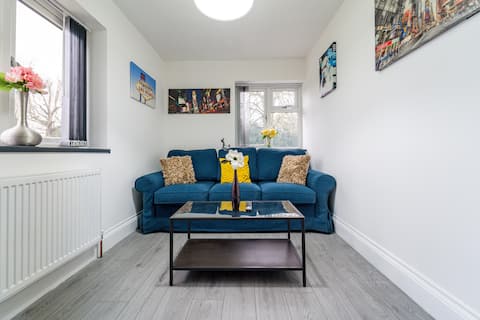
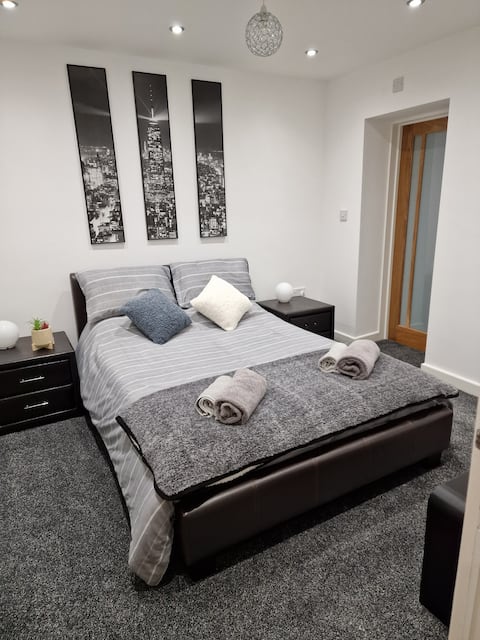
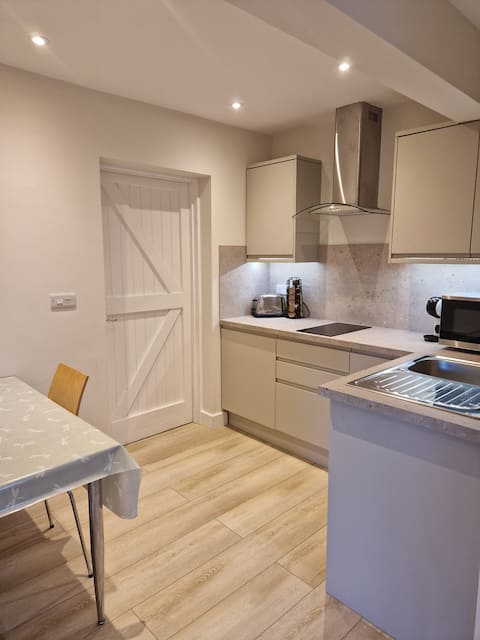
Birmingham Market Analysis
Birmingham packs ICC congress traffic, arena concerts, university open days, and NEC exhibition weeks into a single West Midlands calendar, and each guest type books different neighborhoods with different amenity expectations. City Centre and Jewellery Quarter flats near New Street fill on business mid-weeks when Wi-Fi, desk space, and 24-hour check-in are baseline. Sutton Coldfield and Northfield & Kings Norton carry family houses with driveways and longer commutes to the core. As of September 2026, the borough averages £22,289 annual revenue, 55% occupancy, and £112 ADR across 2,291 active listings.
Seasonality & event windows
Spring lifts occupancy around conference season at the ICC and graduate weekends near Selly Oak and Edgbaston. Summer brings family city breaks tied to school holidays plus outdoor events at Cannon Hill Park and Edgbaston cricket. Autumn exhibition weeks at the NEC and Christmas-market traffic in the German Market quarter keep Digbeth & Eastside active. Winter is softer borough-wide, but arena tours and January sales conferences still book airport-fringe apartments when hosts price parking and late checkout clearly.
Investor checklist before you list
- Confirm building rules. Many city-centre blocks restrict short lets; read the lease and management-company policy before exchange.
- Map guest intent to neighborhood. NEC and airport guests need different copy than Jewellery Quarter food-weekend couples.
- Price parking explicitly. Sutton Coldfield and outer neighborhoods win on driveways; City Centre flats should state nearest NCP or on-street permit reality.
- Model full-year cash flow. Arena and exhibition peaks pair with steady mid-week corporate demand when you buy in the right zone.
- Check Birmingham City Council planning posture. Whole-property short stays may need permission depending on prior use class and Article 4 coverage.
- Budget for business-rates eligibility. Self-catering available 140+ days/year and let 70+ days may move the property to business rates.
- Register for the national STR scheme when live. Track GOV.UK registration guidance.
What Are the Airbnb Regulations in Birmingham?
Understanding local regulations is crucial for operating a successful Airbnb. Let's examine the compliance landscape and what you need to know about licensing requirements in Birmingham.
Current Regulatory Status
No properties have proper licensing in this market, indicating minimal regulatory enforcement.
Identify your planning authority. Birmingham City Council handles residential planning for the metropolitan borough. Use the Planning Portal “Do you need permission?” tool before listing a whole property on a short-term basis.
Check Article 4 and use-class rules. Concentrated short-let streets may face additional scrutiny; apply for a Lawful Development Certificate if deeds or prior permissions are unclear.
Lease and freeholder consent. Apartment buildings often require landlord approval for short lets; some city-centre schemes ban them outright.
Fire and guest safety. Paying-guest accommodation must meet fire, gas, electrical, and EPC standards under England’s self-catering rules.
Business rates vs council tax. Properties available 140+ days/year and actually let 70+ days in 12 months may be rated by the Valuation Office Agency (same GOV.UK guidance).
National STR registration. Track GOV.UK registration scheme guidance for upcoming host duties.
Tax and waste. Declare rental income to HMRC; confirm commercial waste collection rules with Birmingham City Council for holiday lets.
What Should You Charge for Your Airbnb in Birmingham?
Smart Pricing Tools →Pricing is one of the most critical decisions for Airbnb success. Let's analyze the current pricing landscape and help you understand what rates you can realistically charge.
The current average daily rate in Birmingham is £112 per night. However, pricing varies significantly based on property quality and location. Here's what different property tiers typically charge:
Airbnb Pricing Tiers in Birmingham
Premium(Top 10%) | High-performing(Top 25%) | Average(Median) | Budget(Bottom 25%) |
|---|---|---|---|
| £152per night | £115per night | £85per night | £4per night |
*Top locations, big properties, premium amenities | *Good property management, highly rated | *Standard market performance | *Basic properties, less desirable locations |
Is It Profitable to Start an Airbnb in Birmingham?
Investment Analysis →Understanding the profitability potential is crucial for any Airbnb investment decision. Let's analyze the revenue performance and profit margins in the Birmingham market to help you make informed financial decisions.
Revenue Performance
Profitability Factors
Which Areas in Birmingham Are Most Profitable for Airbnb?
Explore All Areas →Birmingham inventory spans 22 neighborhoods. £22,289 borough-wide revenue blends City Centre conference weeks, Jewellery Quarter dining weekends, and suburban family stock in Sutton Coldfield and the south-west fringe.
Top Performing Neighborhoods
City Centre: 602 listings averaging £22,501 at 56% occupancy. ICC congress weeks, arena concerts, and New Street rail access drive mid-week corporate stays.
Jewellery Quarter: 348 listings at £23,740 with 52% occupancy. Food-and-drink weekends and creative-industry guests south of the core.
Digbeth & Eastside: 324 listings earning £25,414 at 59% occupancy. NEC spillover, airport fringe, and regeneration-quarter demand.
Edgbaston: 121 listings at £19,613. University open days and Edgbaston cricket event weekends.
Harborne: 45 listings at £26,154 with 59% occupancy. One of the borough’s stronger revenue pockets on the western fringe.
Sutton Coldfield: 47 listings averaging £23,665 at 52% occupancy. Parkland, golf, and family parking that City Centre flats rarely match.
Student & creative south
Selly Oak (100 listings, £17,984 revenue) and Moseley (58 listings) attract university families and food-and-pub weekends. Kings Heath adds £21,372 average revenue on 34 listings with strong summer occupancy for guests who want village-high-street charm inside the city boundary.
North & east belt
Erdington (79 listings), Perry Barr (51 listings), and Sheldon (115 listings) split NEC-adjacent airport demand from inner-city leisure weekends. Yardley & Acocks Green posts £25,947 on 75 listings east of the core.
South-west fringe
Northfield & Kings Norton (40 listings, £19,713 revenue) carries outer-fringe houses and semis. Aston & Handsworth, Hall Green, and Bournville & Stirchley hold smaller pools for hosts who want quieter residential streets once polygon coverage expands.
West Midlands comparators
Coventry (615 listings, £19,682 revenue) and Solihull (329 listings) split NEC-adjacent airport demand and airport-business travel differently from Jewellery Quarter leisure weekends. Compare transfer times before you buy on the borough average alone.
Explore Other Markets in England
Airbnb Occupancy Rates in Queen's Park, Greater London
City Of Westminster, England
9,797 Active Listings
Airbnb Occupancy Rates in Windermere And Bowness, Cumbria
Westmorland And Furness, England
849 Active Listings