Airbnb Occupancy Rates in Sheffield, South Yorkshire(September 2026)
Sheffield sits on the edge of the Peak District with Kelham Island food halls, two universities, and Meadowhall retail traffic that together keep short-stay calendars active through the week.
Hospital research visitors, outdoor groups heading for the Dark Peak, and Hallam conference delegates book different neighborhoods with different parking and amenity expectations. City Centre flats serve arena and station guests. Broomhill and Nether Edge carry leafy Victorian stock for longer mid-stays.
As of September 2026, the district records £20,674 average annual revenue, 53% occupancy, and £106 ADR across 915 active listings. Underwrite each ward separately because hills, conservation areas, and tram links change the guest story block by block.
Sheffield Airbnb Market Map (September 2026)
Sheffield Market Performance
Period: September 2025 - August 2026
Is Airbnb a Good Investment in Sheffield?
YES. Sheffield suits hosts who want northern city demand with Peak District spillover, provided you confirm Sheffield City Council planning on your street and compete on honest hill and parking descriptions across 915 listings.
Yorkshire core cities:Leeds posts £23,204 on 1,703 listings with heavier financial-district mid-week volume. Sheffield trades some of that corporate scale for outdoor tourism, hospital research, and dual-university calendars at £20,674 average revenue. Choose Leeds when arena and legal-sector Monday blocks dominate your model. Choose Sheffield when Peak District day trips and Western Bank hospital traffic fit your guest mix.
Northern peers:Manchester at £27,146 on 1,979 listings carries larger arena and exhibition calendars. York at £33,968 leans heritage city breaks. Birmingham at £22,289 mirrors Midlands conference scale with a different event map.
Who tends to invest well
- Hosts buying City Centre or Nether Edge stock with clear tram, parking, and hill-walking copy.
- Operators comfortable with conservation-area checks in Broomhill and Crookes before exchange.
Stronger fit elsewhere
- Leeds for larger inventory depth and financial-district mid-week demand.
- Peak District cottage markets when rural walking weeks are your primary calendar (Derbyshire Dales district revenue £36,764).
- Greater London for national corporate volume at £52,447 region-wide revenue.
| Market | Avg revenue | Occupancy | What rules imply |
|---|---|---|---|
| Sheffield | £20,674 | 53% | Case-by-case planning; conservation areas in west wards |
| Leeds | £23,204 | 53% | Selective licensing wards; STR exempt but planning still applies |
| Manchester | £27,146 | 53% | City-centre Article 4 pockets |
| York | £33,968 | 57% | Heritage city; tighter core parking |
| South Yorkshire | £21,815 | 54% | County mix of city and former mining towns |
Synthesis: Sheffield rewards hosts who write copy for outdoor guests and hospital visitors, then pick a ward that matches that story. Use the South Yorkshire landing when comparing Rotherham, Barnsley, and Doncaster stock before fixing on a Sheffield postcode.
Get Live Sheffield Market Intelligence
Discover detailed Sheffield Airbnb Analytics and explore real-time market data to make accurate investment decisions.
Explore Real-time Analytics
How Often Will Your Airbnb Be Booked in Sheffield?
View Demand Patterns →Occupancy rates directly impact your revenue potential. Understanding demand patterns helps you set realistic expectations and optimize your availability strategy.
The current average occupancy rate in Sheffield is 53%, meaning properties are booked for about 195 nights per year. However, occupancy varies significantly based on property quality and management. Here's what you can expect:
Airbnb Occupancy Tiers in Sheffield
Premium(Top 10%) | High-performing(Top 25%) | Average(Median) | Low-performing(Bottom 25%) |
|---|---|---|---|
| 88% | 71% | 49% | 22% |
*High desirability & optimized availability | *Good market fit & guest satisfaction | *Standard market performance | *Higher vacancy, optimization needed |
Seasonal Occupancy Patterns in Sheffield
April, August
Highest demand and occupancy rates. Perfect for premium pricing strategies and maximizing revenue. Consider longer minimum stays and higher rates.
December, November
Moderate demand with balanced pricing opportunities. Good for attracting budget-conscious travelers while maintaining reasonable occupancy rates.
January, March
Lower demand requires competitive pricing and creative marketing. Focus on local events, extended stay discounts, and targeting specific traveler segments.
How Much Can You Earn with Airbnb in Sheffield?
Calculate Earnings →One of the most common questions for potential Airbnb hosts in Sheffield is about earning potential. Let's break down the revenue patterns and what you can realistically expect to earn.
Monthly Revenue Trends in Sheffield
Best-in-class Airbnb properties (top 10%) in Sheffield achieve around £29,862 annually, while strong performers (top 25%) earn at least £20,510. Typical properties generate about £12,166 per year, and entry-level listings (bottom 25%) see earnings near £4,411, often with room for optimization. Keep in mind, these are market averages—your actual earnings can be even higher depending on your property's location, bedrooms, guest capacity, and unique amenities.
Want to see how your listing could perform? Create a free account to unlock personalized analytics and explore exclusive insights in our app!
What Can You Learn from Top-Performing Airbnbs in Sheffield?
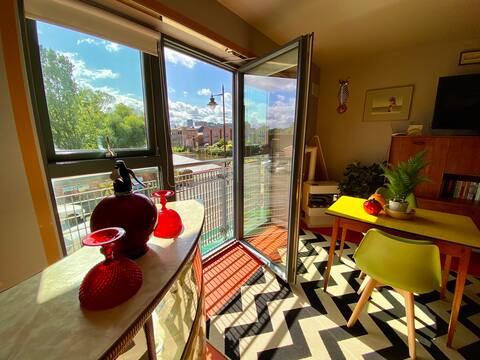
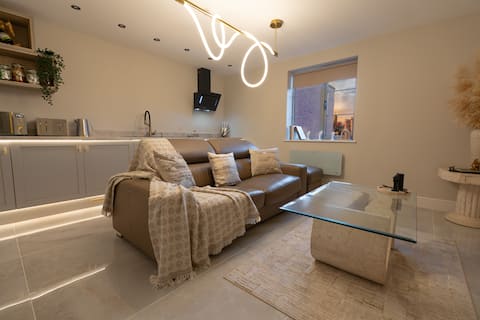
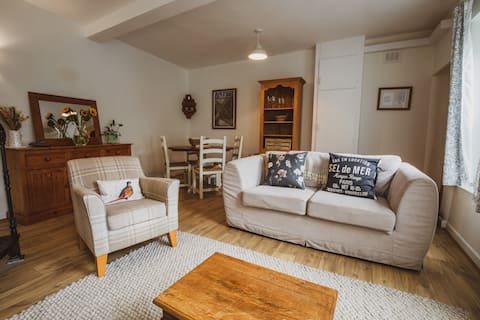
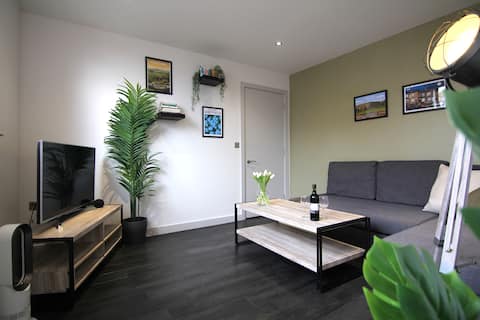
View Top Performers →Studying successful properties provides valuable insights for your own Airbnb strategy. Here are the top-performing listings in Sheffield and what makes them successful.
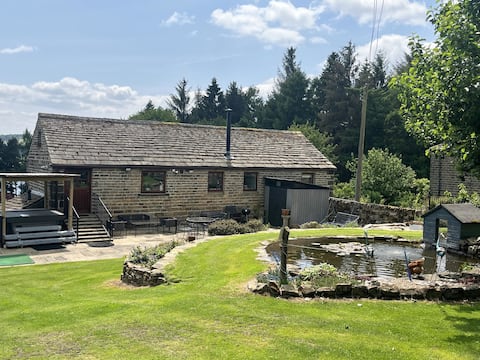
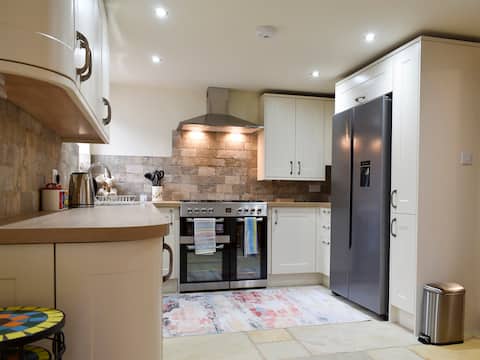
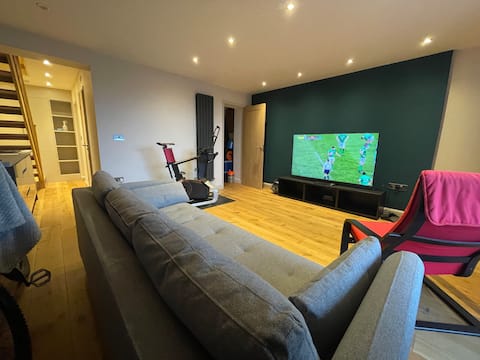
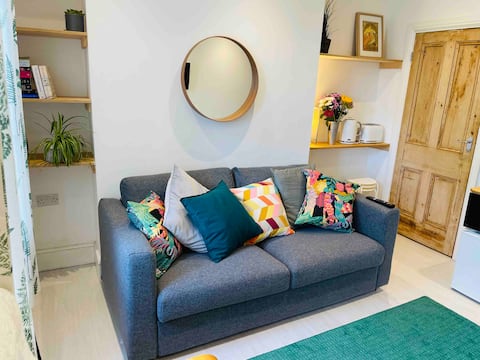
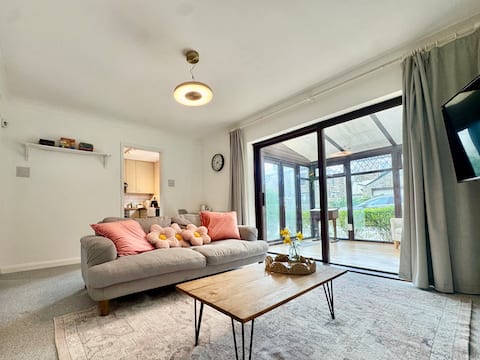
Sheffield Market Analysis
Business, healthcare & events
Corporate guests and NHS research visitors book City Centre and Nether Edge for mid-week blocks when fast Wi-Fi, desk space, and tram links to Sheffield Station are explicit. Utilita Arena concerts and Tramlines festival weeks spike nightly rates in the core. Meadowhall exhibition spillover reaches Hillsborough and Manor Castle when listings state honest drive or tram times.
Outdoor & Peak District guests
Walkers and cyclists use Sheffield as a base for Dark Peak day trips. Dore & Totley, Fulwood, and Graves Park houses with parking and boot-storage space convert better than city-centre studios marketed as “Peak District” without a car. Minimum-night rules can flex for Friday–Sunday hiking clusters while keeping mid-week corporate pricing on separate calendars.
University & creative stays
University of Sheffield and Sheffield Hallam open days, graduation weekends, and term-time parents fill Broomhill, Crookes, and Walkley. Kelham Island food-and-brewery tourism pulls creative-industry guests who want independent dining within a short tram ride. Two-bedroom houses with spare sofa beds outperform one-beds when families arrive for multiple-day campus visits.
What Are the Airbnb Regulations in Sheffield?
Understanding local regulations is crucial for operating a successful Airbnb. Let's examine the compliance landscape and what you need to know about licensing requirements in Sheffield.
Current Regulatory Status
No properties have proper licensing in this market, indicating minimal regulatory enforcement.
Planning first. Sheffield City Council states that hosts may need planning permission before advertising a whole-property holiday let. Conservation areas in Broomhill, Nether Edge, and across 38 designated zones add design and change-of-use scrutiny. Confirm status before exchange, not after your first booking.
Read council host guidance. Start with Sheffield holiday-let advice, then search Public Access for comparable decisions on your street.
Use pre-application advice. The pre-application enquiry service covers change-of-use questions before you commit to a purchase.
Separate HMO rules from STR. Article 4 directions on HMOs in student-heavy areas restrict shared-house conversions. They are distinct from whole-property holiday lets but overlap on the same streets. See HMO planning permission.
Selective licensing history. Previous selective licensing pilots in London Road and Abbeydale ended in October 2023. Monitor the council site if a new scheme launches in your ward.
Lease and building consent. Many apartment schemes restrict short lets regardless of council policy.
Fire, gas, electrical, and EPC standards under England’s self-catering rules.
Business rates test when available 140+ days/year and let 70+ days in 12 months (same GOV.UK guidance).
National STR registration when live. Track GOV.UK registration guidance.
Tax and waste. Declare rental income to HMRC. Confirm waste collection rules with Sheffield City Council for holiday lets.
What Should You Charge for Your Airbnb in Sheffield?
Smart Pricing Tools →Pricing is one of the most critical decisions for Airbnb success. Let's analyze the current pricing landscape and help you understand what rates you can realistically charge.
The current average daily rate in Sheffield is £106 per night. However, pricing varies significantly based on property quality and location. Here's what different property tiers typically charge:
Airbnb Pricing Tiers in Sheffield
Premium(Top 10%) | High-performing(Top 25%) | Average(Median) | Budget(Bottom 25%) |
|---|---|---|---|
| £160per night | £119per night | £86per night | £61per night |
*Top locations, big properties, premium amenities | *Good property management, highly rated | *Standard market performance | *Basic properties, less desirable locations |
Is It Profitable to Start an Airbnb in Sheffield?
Investment Analysis →Understanding the profitability potential is crucial for any Airbnb investment decision. Let's analyze the revenue performance and profit margins in the Sheffield market to help you make informed financial decisions.
Revenue Performance
Profitability Factors
Which Areas in Sheffield Are Most Profitable for Airbnb?
Explore All Areas →Sheffield inventory spans 915 listings across 15 neighborhoods, from City Centre to Dore & Totley on the south-west hills. District revenue of £20,674 blends arena weekends with westward outdoor tourism when hosts price each ward on its own calendar.
Top Performing Neighborhoods
City Centre:331 listings averaging £18,975 at 53% occupancy. Station, arena, and corporate Monday–Thursday demand with lift access as the main constraint.
Broomhill:80 listings at £19,989 with 56% occupancy. University and hospital adjacency with leafy Victorian terraces.
Nether Edge:63 listings earning £19,566 at 52% occupancy. Independent cafés and tram links for longer mid-stays.
Hillsborough:73 listings at £24,721. North-west families and Meadowhall spillover with stronger parking than the core towers.
Walkley:38 listings at £18,541 with 51% occupancy. Steep streets reward honest hill and parking copy in listings.
Manor Castle:42 listings at £23,002. East Sheffield value stock with steady mid-week demand when priced for tram access.
Western hills & outdoor access
Dore & Totley (27 listings, £29,372 revenue), Ecclesall (20 listings), and Fulwood (19 listings) serve Peak District day-trippers who need driveways and early breakfast flexibility. Crookes (22 listings) and Park Hill (21 listings) split hillside views from regeneration-quarter appeal.
East & south corridors
Burngreave (28 listings), Brightside (23 listings), and Gleadless Valley (28 listings) offer lower entry prices with contractor and value-seeking guest demand. Graves Park (19 listings) adds family parkland appeal on the south-east fringe.
South Yorkshire context
Read Leeds (1,703 listings), Wakefield (221 listings), and the South Yorkshire region page (1,436 listings) before you treat the Sheffield average as your purchase benchmark. County revenue blends city, former mining towns, and different commute patterns.
Explore Other Markets in England
Airbnb Occupancy Rates in Queen's Park, Greater London
City Of Westminster, England
9,797 Active Listings
Airbnb Occupancy Rates in Windermere And Bowness, Cumbria
Westmorland And Furness, England
849 Active Listings