Airbnb Occupancy Rates in Canterbury, Kent(October 2026)
Canterbury district pairs a UNESCO cathedral city with Whitstable harbour weekends and Herne Bay beach weeks on the north Kent coast. Coach tourism, university events, and London commuter fringe demand each book different parishes.
As of October 2026, the district averages £31,146 in annual revenue per listing with 55% occupancy and £155 ADR across 1,187 active listings. Whitstable leads inventory with 543 listings, followed by Canterbury and Herne Bay.
Underwrite the parish and guest type before you match the district average.
Canterbury Airbnb Market Map (October 2026)
Canterbury Market Performance
England average: 59% occupancy, £168 per night.
Airbnb occupancy rates by city in EnglandPeriod: October 2025 - September 2026
Is Airbnb a Good Investment in Canterbury?
YES. Canterbury district suits hosts who want Kent cathedral-city branding plus north-coast parish options, provided you confirm planning with Canterbury City Council and buy where guests actually search.
| Market | Avg revenue | Occupancy | What rules imply |
|---|---|---|---|
| Canterbury | £31,146 | 55% | Single district council; holiday use decided case-by-case |
| Whitstable | £32,470 | 54% | Oyster-town coast; highest district inventory |
| Canterbury city | £30,220 | 57% | Cathedral precinct and university weekends |
| Thanet | £31,454 | 51% | Margate and Broadstairs volume; higher coastal inventory |
| Kent | £30,900 | 53% | Full county scale for context |
Who tends to invest well
- Hosts buying in Whitstable or Herne Bay for coast-first calendars with cathedral city day trips.
- Operators targeting Canterbury city walls, theatre weekends, and university event traffic.
- Buyers who want a single district council covering coast and cathedral in one investment thesis.
Stronger fit elsewhere
- Thanet for pure seaside volume in Margate and Broadstairs (1,336 listings).
- Whitby for a named North Sea harbour town brand at £31,039 revenue.
- Dover for Channel-port and cliff-walk demand at £30,094.
Canterbury lists 1,187 properties across many civil parishes. 543 Whitstable listings and 281 in the cathedral city anchor the district. Budget time for a Lawful Development Certificate if title deeds are ambiguous in conservation areas.
Get Live Canterbury Market Intelligence
Discover detailed Canterbury Airbnb Analytics and explore real-time market data to make accurate investment decisions.
Explore Real-time Analytics
How Often Will Your Airbnb Be Booked in Canterbury?
View Demand Patterns →Occupancy rates directly impact your revenue potential. Understanding demand patterns helps you set realistic expectations and optimize your availability strategy.
The current average occupancy rate in Canterbury is 55%, meaning properties are booked for about 201 nights per year. However, occupancy varies significantly based on property quality and management. Here's what you can expect:
Airbnb Occupancy Tiers in Canterbury
Premium(Top 10%) | High-performing(Top 25%) | Average(Median) | Low-performing(Bottom 25%) |
|---|---|---|---|
| 88% | 70% | 47% | 19% |
*High desirability & optimized availability | *Good market fit & guest satisfaction | *Standard market performance | *Higher vacancy, optimization needed |
Seasonal Occupancy Patterns in Canterbury
September, July
Highest demand and occupancy rates. Perfect for premium pricing strategies and maximizing revenue. Consider longer minimum stays and higher rates.
February, December
Moderate demand with balanced pricing opportunities. Good for attracting budget-conscious travelers while maintaining reasonable occupancy rates.
January, March
Lower demand requires competitive pricing and creative marketing. Focus on local events, extended stay discounts, and targeting specific traveler segments.
How Much Can You Earn with Airbnb in Canterbury?
Calculate Earnings →One of the most common questions for potential Airbnb hosts in Canterbury is about earning potential. Let's break down the revenue patterns and what you can realistically expect to earn.
Monthly Revenue Trends in Canterbury
Best-in-class Airbnb properties (top 10%) in Canterbury achieve around £42,590 annually, while strong performers (top 25%) earn at least £28,308. Typical properties generate about £17,058 per year, and entry-level listings (bottom 25%) see earnings near £6,169, often with room for optimization. Keep in mind, these are market averages—your actual earnings can be even higher depending on your property's location, bedrooms, guest capacity, and unique amenities.
Want to see how your listing could perform? Create a free account to unlock personalized analytics and explore exclusive insights in our app!
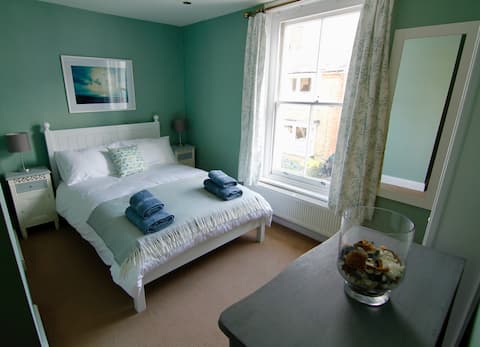
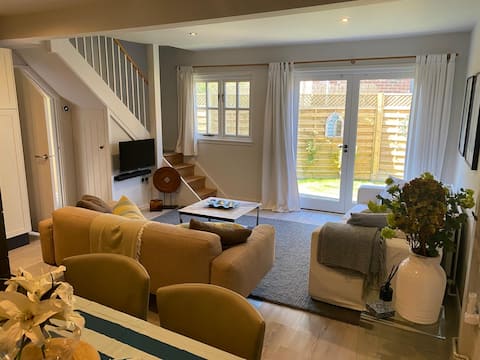
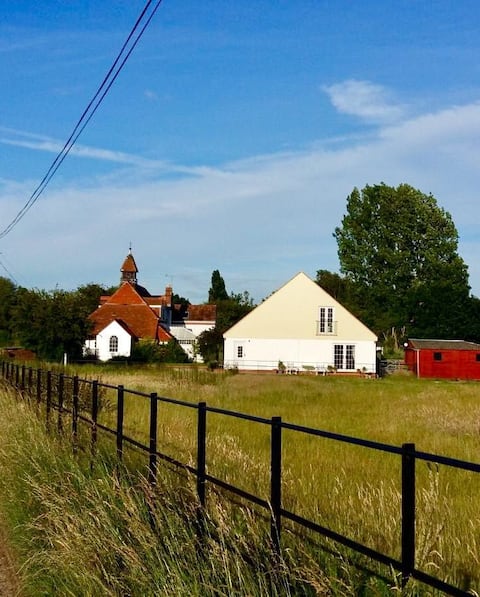
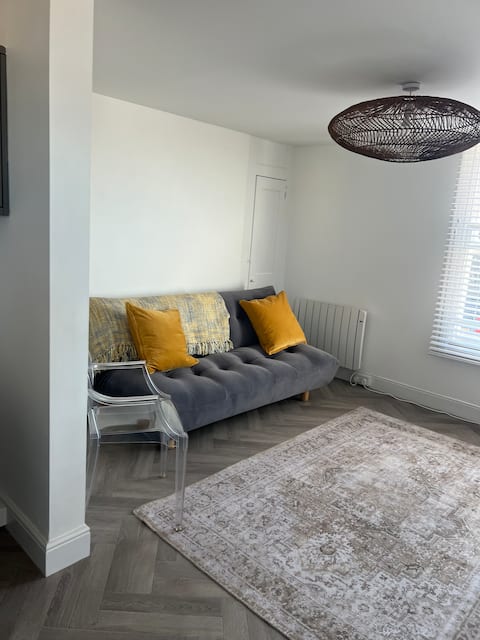
What Can You Learn from Top-Performing Airbnbs in Canterbury?
View Top Performers →Studying successful properties provides valuable insights for your own Airbnb strategy. Here are the top-performing listings in Canterbury and what makes them successful.
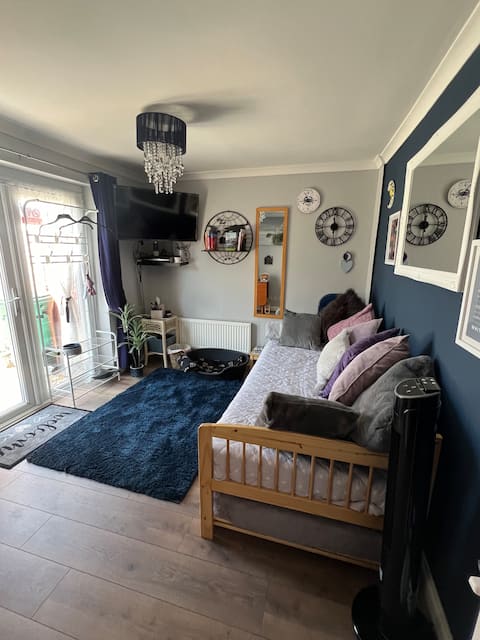
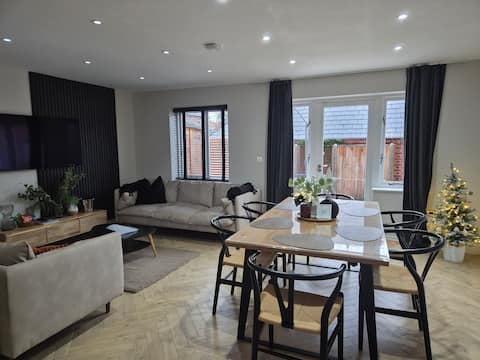
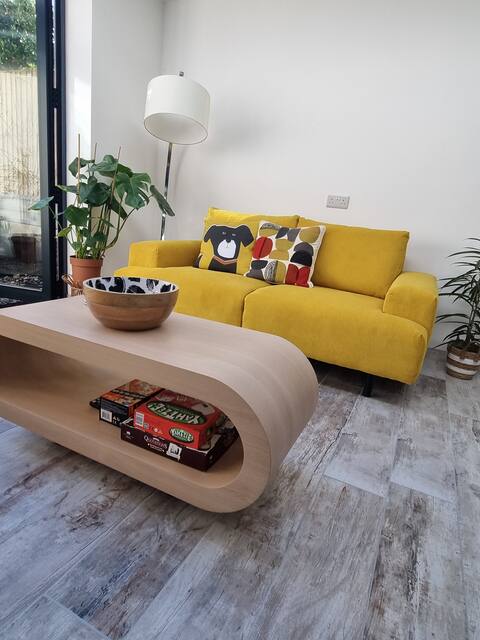
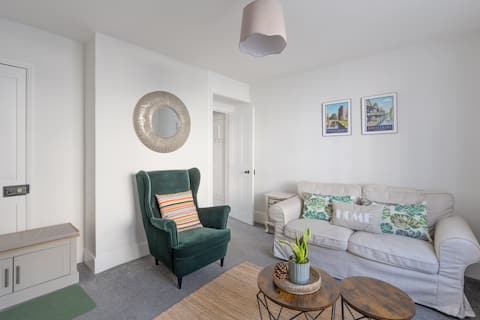
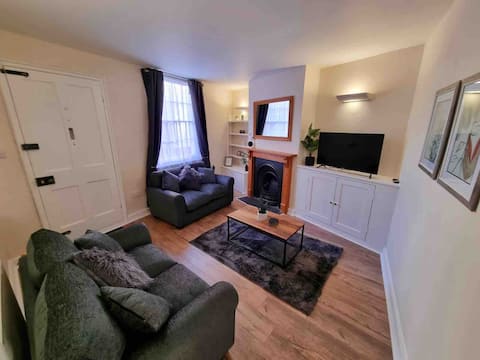
Canterbury Market Analysis
Cathedral precinct, pilgrimage traffic, and university weekends
St Augustine’s legacy, the UNESCO cathedral precinct, and year-round coach tourism keep mid-week and shoulder-season bookings alive outside pure summer coast weeks. Canterbury properties within walking distance of the city walls or Westgate Towers hold nightly rates on theatre and concert weekends. Harbledown and Hackington cottages trade walkability for parking and garden space when priced for honest city-fringe access.
Whitstable harbour and oyster-town weekends
Whitstable drives the district’s deepest inventory pool with harbour dining, gallery weekends, and London day-trip traffic. Parking and sea-view consistency matter on peak summer weeks when 54% occupancy is earned.
Herne Bay and north-coast family weeks
Herne Bay (158 listings, £29,968 revenue) suits family beach weeks with lower nightly rates than central Whitstable but easier entry prices. Sturry, Herne and Broomfield, and Littlebourne add village-fringe stock for hosts who want coast access with a quieter parish address.
What Are the Airbnb Regulations in Canterbury?
Understanding local regulations is crucial for operating a successful Airbnb. Let's examine the compliance landscape and what you need to know about licensing requirements in Canterbury.
Registration Numbers on Airbnb
None of the active Airbnb listings we tracked last month display a registration or license number.
This reflects what hosts publish on their Airbnb listings, not the local legal requirements. Always confirm them with local authorities.
Canterbury City Council is the single planning authority for the whole district. Holiday-let change of use is decided case-by-case. There is no fixed night cap in local policy, but conservation areas and listed buildings face tighter scrutiny.
| Host type | Planning and tax | Practical note |
|---|---|---|
| Occasional home sharer | May qualify as permitted development if criteria met | Use Canterbury planning portal before first booking |
| Whole-property holiday let | Often needs explicit permission or lawful existing use | Apply for a Lawful Development Certificate if deeds are unclear |
| Professional operator | Business rates if 140+ days available and 70+ days let | See GOV.UK self-catering rules |
Register when England’s national STR scheme goes live. Track GOV.UK registration guidance. Meet fire, gas, electrical, and EPC standards for paying guests. Declare rental income to HMRC regardless of council tax versus business rates outcome.
What Should You Charge for Your Airbnb in Canterbury?
Smart Pricing Tools →Pricing is one of the most critical decisions for Airbnb success. Let's analyze the current pricing landscape and help you understand what rates you can realistically charge.
The current average daily rate in Canterbury is £155 per night. However, pricing varies significantly based on property quality and location. Here's what different property tiers typically charge:
Airbnb Pricing Tiers in Canterbury
Premium(Top 10%) | High-performing(Top 25%) | Average(Median) | Budget(Bottom 25%) |
|---|---|---|---|
| £247per night | £165per night | £115per night | £57per night |
*Top locations, big properties, premium amenities | *Good property management, highly rated | *Standard market performance | *Basic properties, less desirable locations |
Is It Profitable to Start an Airbnb in Canterbury?
Investment Analysis →Understanding the profitability potential is crucial for any Airbnb investment decision. Let's analyze the revenue performance and profit margins in the Canterbury market to help you make informed financial decisions.
Revenue Performance
Profitability Factors
Which Areas in Canterbury Are Most Profitable for Airbnb?
Explore All Areas →Canterbury district spans 50+ civil parishes. £31,146 district-wide revenue blends cathedral-city weekends, Whitstable harbour traffic, and Herne Bay beach weeks.
Top Performing Localities
Whitstable: 543 listings averaging £32,470 at 54% occupancy. The district’s inventory leader with harbour, oysters, and London spillover demand.
Canterbury: 281 listings at £30,220 with 57% occupancy. Cathedral precinct, coach tourism, and university event weekends.
Herne Bay: 158 listings earning £29,968 at 55% occupancy. Family beach weeks on the north Kent coast.
Harbledown And Rough Common: 10 listings at £58,951. Hill-side cottages above the city with moors-and-city dual appeal.
Hackington: 10 listings averaging £54,924 at 66% occupancy. City-adjacent demand for cathedral weekends.
Thanet coast comparison
Broadstairs And St. Peters (522 listings, £32,998 revenue) and Ramsgate (258 listings) in neighbouring Thanet offer a more concentrated seaside calendar if you want pure beach volume over cathedral-city mix.
Explore Other Markets in England
Airbnb Occupancy Rates in Queen's Park, Greater London
City Of Westminster, England
9,798 Active Listings
Airbnb Occupancy Rates in Windermere And Bowness, Cumbria
Westmorland And Furness, England
858 Active Listings