Airbnb Occupancy Rates in Como, Lombardia(September 2026)
Como is where Italian lake luxury still earns premium nightly rates when the villa has a terrace, a boat dock, and check-in that matches five-star expectations—not when you import Milano corporate playbooks onto Lario waterfront stock.
Citywide data as of September 2026 shows €41,077 in average annual revenue per listing, 61% occupancy, €186 per night, and 1,889 active Airbnb listings. Those figures blend Bellagio–Menaggio weekenders, villa weddings on the western shore, and apartments booked by Milan executives who want twenty minutes to Linate without sleeping in a fair-week tower.
The tradeoff is deliberate: Como often posts higher ADR than Milano on headline averages but thinner mid-week corporate floors and sharper summer–winter swings. Investors who underwrite lake views, ferry logistics, and Lombardy registration before they buy waterfront trophies usually read the market more clearly than those chasing only revenue rank.
Como Airbnb Market Map (September 2026)
Como Market Performance
Period: September 2025 - August 2026
Is Airbnb a Good Investment in Como?
YES — Como rewards operators who can sell lakefront luxury, shoulder-season lake breaks, and Milan spillover weekends while completing SUAP, CIR, CIN, and Como tourist-tax flows before they scale inventory.
Choose Milano if… you need year-round corporate nights, fair-calendar repricing, and the deepest northern-Italy listing pool (€35,351, 65%, 17,308 listings). Milan trades lake premiums for repeatable mid-week occupancy.
Choose Como if… you are underwriting Lario ADR, villa terraces, boat-week guests, and wedding or retreat groups who pay for views and privacy. Citywide €186 often clears Milan on rate while 61% can look softer outside July—price the calendar, not only the annual average.
Choose Bergamo if… you want lower acquisition costs and Orio al Serio / Brembo valley spillover without lakefront capex (€28,171, 67%). Bergamo is an airport-and-hills play, not a substitute for Bellagio positioning.
Choose Varese if… you prefer pre-Alps quiet, smaller inventory, and lake-adjacent day trips without Como’s global luxury brand (€22,469, 60%, 173 listings). Varese rarely matches Como on nightly rate; it can win on simplicity.
| Market | Avg revenue | Occupancy | Listings |
|---|---|---|---|
| Como | €41,077 | 61% | 1,889 |
| Milano | €35,351 | 65% | 17,308 |
| Bergamo | €28,171 | 67% | 1,248 |
| Varese | €22,469 | 60% | 173 |
Get Live Como Market Intelligence
Discover detailed Como Airbnb Analytics and explore real-time market data to make accurate investment decisions.
Explore Real-time Analytics
How Often Will Your Airbnb Be Booked in Como?
View Demand Patterns →Occupancy rates directly impact your revenue potential. Understanding demand patterns helps you set realistic expectations and optimize your availability strategy.
The current average occupancy rate in Como is 61%, meaning properties are booked for about 221 nights per year. However, occupancy varies significantly based on property quality and management. Here's what you can expect:
Airbnb Occupancy Tiers in Como
Premium(Top 10%) | High-performing(Top 25%) | Average(Median) | Low-performing(Bottom 25%) |
|---|---|---|---|
| 89% | 73% | 54% | 32% |
*High desirability & optimized availability | *Good market fit & guest satisfaction | *Standard market performance | *Higher vacancy, optimization needed |
Seasonal Occupancy Patterns in Como
September, July
Highest demand and occupancy rates. Perfect for premium pricing strategies and maximizing revenue. Consider longer minimum stays and higher rates.
February, March
Moderate demand with balanced pricing opportunities. Good for attracting budget-conscious travelers while maintaining reasonable occupancy rates.
January, December
Lower demand requires competitive pricing and creative marketing. Focus on local events, extended stay discounts, and targeting specific traveler segments.
How Much Can You Earn with Airbnb in Como?
Calculate Earnings →One of the most common questions for potential Airbnb hosts in Como is about earning potential. Let's break down the revenue patterns and what you can realistically expect to earn.
Monthly Revenue Trends in Como
Best-in-class Airbnb properties (top 10%) in Como achieve around €58,647 annually, while strong performers (top 25%) earn at least €38,015. Typical properties generate about €24,169 per year, and entry-level listings (bottom 25%) see earnings near €13,382, often with room for optimization. Keep in mind, these are market averages—your actual earnings can be even higher depending on your property's location, bedrooms, guest capacity, and unique amenities.
Want to see how your listing could perform? Create a free account to unlock personalized analytics and explore exclusive insights in our app!
What Can You Learn from Top-Performing Airbnbs in Como?
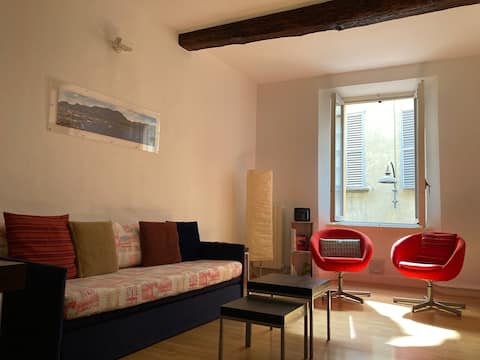
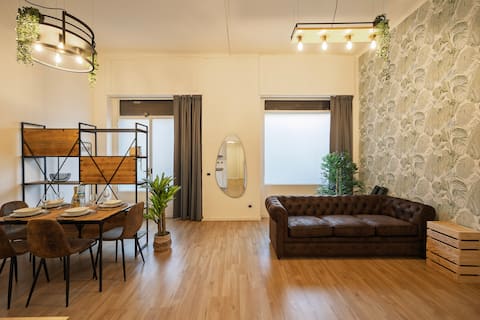
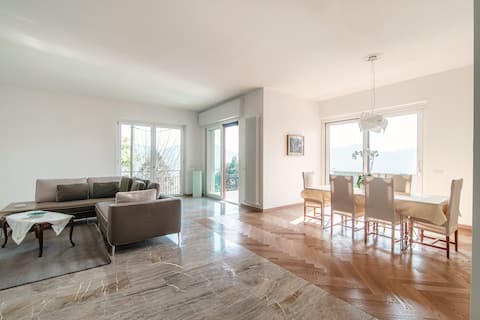
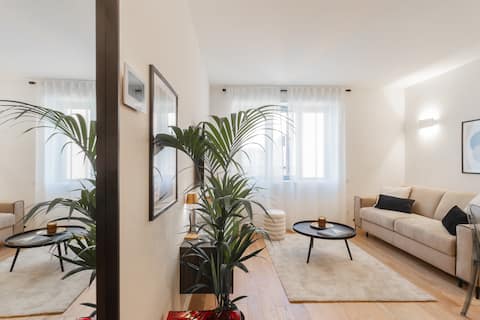
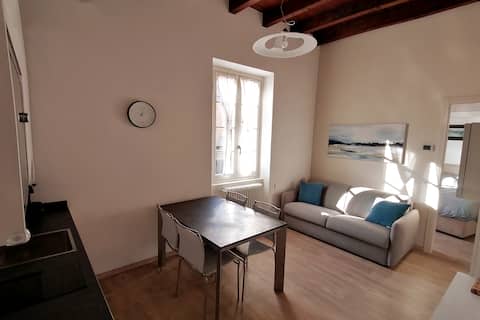
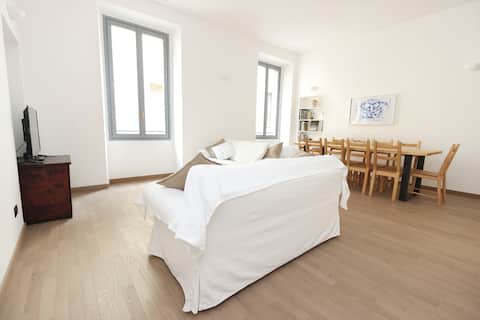
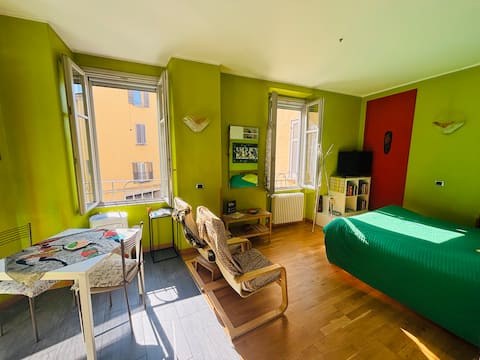
View Top Performers →Studying successful properties provides valuable insights for your own Airbnb strategy. Here are the top-performing listings in Como and what makes them successful.


Como Market Analysis
Spring on Lake Como
March through May reopens the lake after winter: ferry timetables expand, villa gardens return, and Milan professionals book long weekends before summer heat. Shoulder weeks often deliver a better occupancy-to-ADR balance than August—especially for walkable Como centro, Cernobbio, and Tremezzina stock with lake glimpses rather than full private docks. Design-week and spring fair spillover from Milano can lift specific April–May windows without requiring Fashion Week pricing every night.
Summer: peak lake season
June through August is when boat days, wedding parties, and international villa weeks dominate. Waterfront terraces, air conditioning, private parking, and clear ferry or boat-transfer instructions matter more than square metres alone. Premium ADR weeks cluster around July; operators without docks or heat management often discount while lake-view villas hold rate. Compare summer underwriting with Bergamo airport traffic—Como sells scenery and exclusivity, not transit convenience alone.
Autumn: foliage and slower luxury
September and October attract couples, food-and-wine itineraries, and retreat groups who want quieter lake days after the summer crush. Occupancy can soften versus July, but ADR on renovated lake-view one- and two-bedrooms often stays resilient when reviews and photography justify the tariff. Investors who only model August peak miss how autumn rewards professionally managed stock with flexible minimum stays.
Winter: Alps gateway and city breaks
November through February is the honest low season for pure leisure lake stock—yet Christmas markets, short Milan escapes, and ski-weekend routing toward the Alps still book well-located apartments near Como San Giovanni, funicular access, or quick highway links. Winter punishes trophy villas with poor heating and steep stairs; it rewards compact luxury flats with reliable climate control and transparent access in rain or fog. Against Varese, Como keeps the stronger global “Lake Como” search brand even when raw occupancy dips.
What Are the Airbnb Regulations in Como?
Understanding local regulations is crucial for operating a successful Airbnb. Let's examine the compliance landscape and what you need to know about licensing requirements in Como.
Current Regulatory Status
63% compliance indicates strict regulatory enforcement in this market.
Do I need CIA or SCIA to list in Como?
Most self-catered lake apartments file a CIA (non-business) or SCIA (business) through Como SUAP depending on whether you run locazione turistica, locazione breve, or classified vacation lodging (casa/appartamento vacanze). Start on the municipal sportello: locazione turistica and CAV / residence. Online filing also runs through Impresa in un giorno — Como.
When do I obtain CIR and CIN?
After SUAP acceptance, Provincia di Como activates the unit on ROSS1000 and issues the regional CIR (Provincia guidance). Request the national CIN on BDSR and display it on every platform listing and at the property entrance (BDSR FAQ). National D.L. 145/2023 art. 13-ter ties CIN to safety hardware (gas/CO detection, portable extinguishers).
How does Como’s imposta di soggiorno work?
Hosts collect the municipal tourist tax from qualifying guests, declare on StayTour, and remit to the Comune (imposta di soggiorno service). Published schedules from 1 January 2024 typically place case vacanza, B&B, affittacamere, and locazioni brevi at €3 per person per night, with a maximum of four consecutive nights per guest under the updated tariff sheet (MEF tariff publication; confirm against the regolamento).
How many apartments can I run as a private host?
Italy caps each stay at 30 days and does not apply a uniform national night limit like France or Spain. From 2026, many private hosts use cedolare secca on at most two apartments before crossing into business taxation—additional units generally require the entrepreneurial path and SCIA (Agenzia delle Entrate — locazioni brevi). Como’s SUAP pages note up to three occasional casa vacanza units for certain non-business classifications—verify your exact track before marketing a portfolio.
What about condominiums and guest police reporting?
Condominium consent is not issued at SUAP; disputes are typically civil. Guest identification must follow TULPS rules—Como republishes the Interior circular on in-person ID and Alloggiati Web within 24 hours (Comune guest-ID notice). Monthly tourist-flow statistics also flow through ROSS1000 Lombardia separately from Alloggiati.
Where do Lombardy regional rules fit?
L.R. 27/2015 and L.R. 7/2018 govern extra-alberghiero registration, CIR advertising, and reporting (L.R. 27/2015, Regione Lombardia CIR hub). Treat SUAP → CIR → CIN → Alloggiati → tourist tax as one chain before you scale lakefront inventory.
What Should You Charge for Your Airbnb in Como?
Smart Pricing Tools →Pricing is one of the most critical decisions for Airbnb success. Let's analyze the current pricing landscape and help you understand what rates you can realistically charge.
The current average daily rate in Como is €186 per night. However, pricing varies significantly based on property quality and location. Here's what different property tiers typically charge:
Airbnb Pricing Tiers in Como
Premium(Top 10%) | High-performing(Top 25%) | Average(Median) | Budget(Bottom 25%) |
|---|---|---|---|
| €285per night | €188per night | €130per night | €85per night |
*Top locations, big properties, premium amenities | *Good property management, highly rated | *Standard market performance | *Basic properties, less desirable locations |
Is It Profitable to Start an Airbnb in Como?
Investment Analysis →Understanding the profitability potential is crucial for any Airbnb investment decision. Let's analyze the revenue performance and profit margins in the Como market to help you make informed financial decisions.