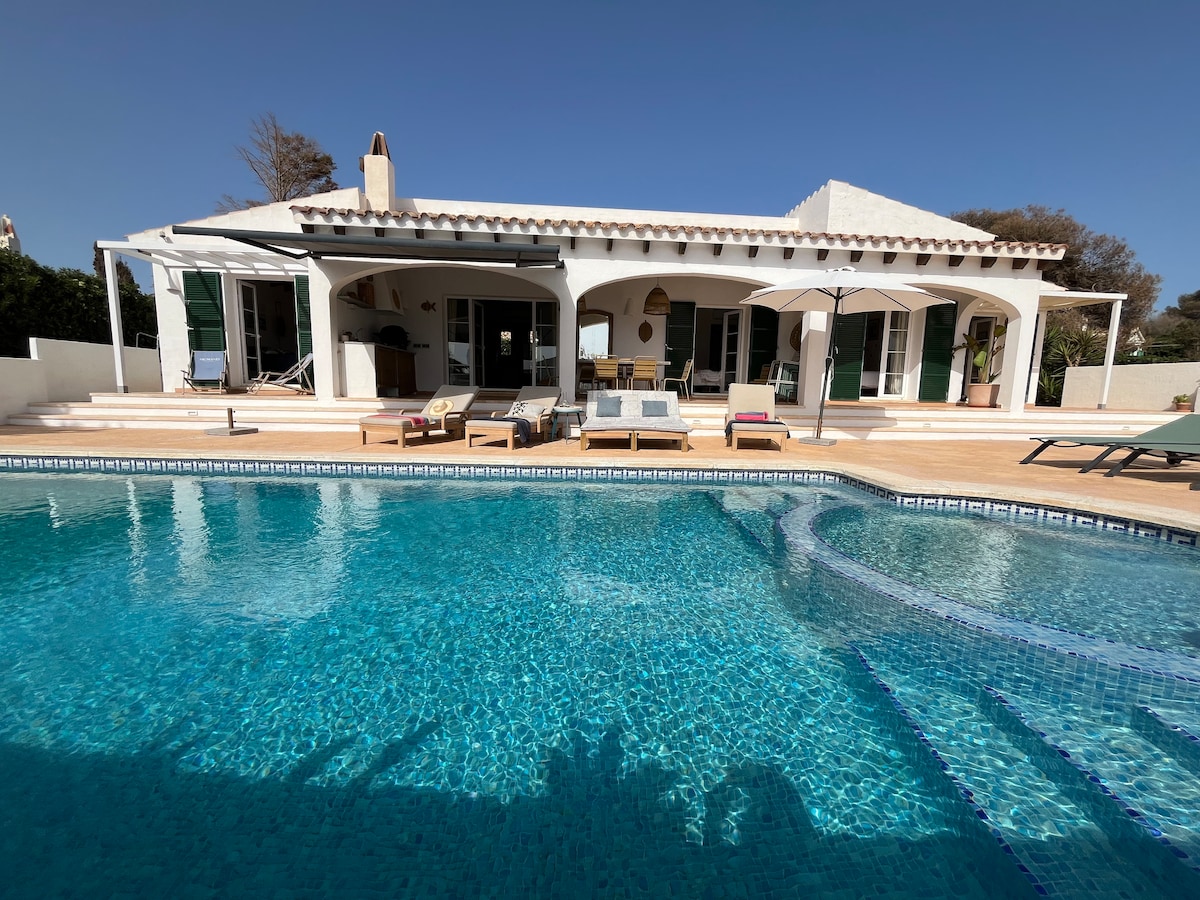
Best Airbnb Markets in Illes Balears, Spain
Maximizing your returns in Illes Balears, Spain depends on choosing the right location with proven demand. We have carefully reviewed the top 10 markets to help you spot emerging trends and high-performing zones for your Airbnb portfolio.
While this data gives you a solid market-wide perspective, successful investing requires property-specific due diligence. For the most accurate filters, occupancy heatmaps, and revenue breakdowns, use GuestFavorites.
Illes Balears Airbnb Market Map (June 2026)
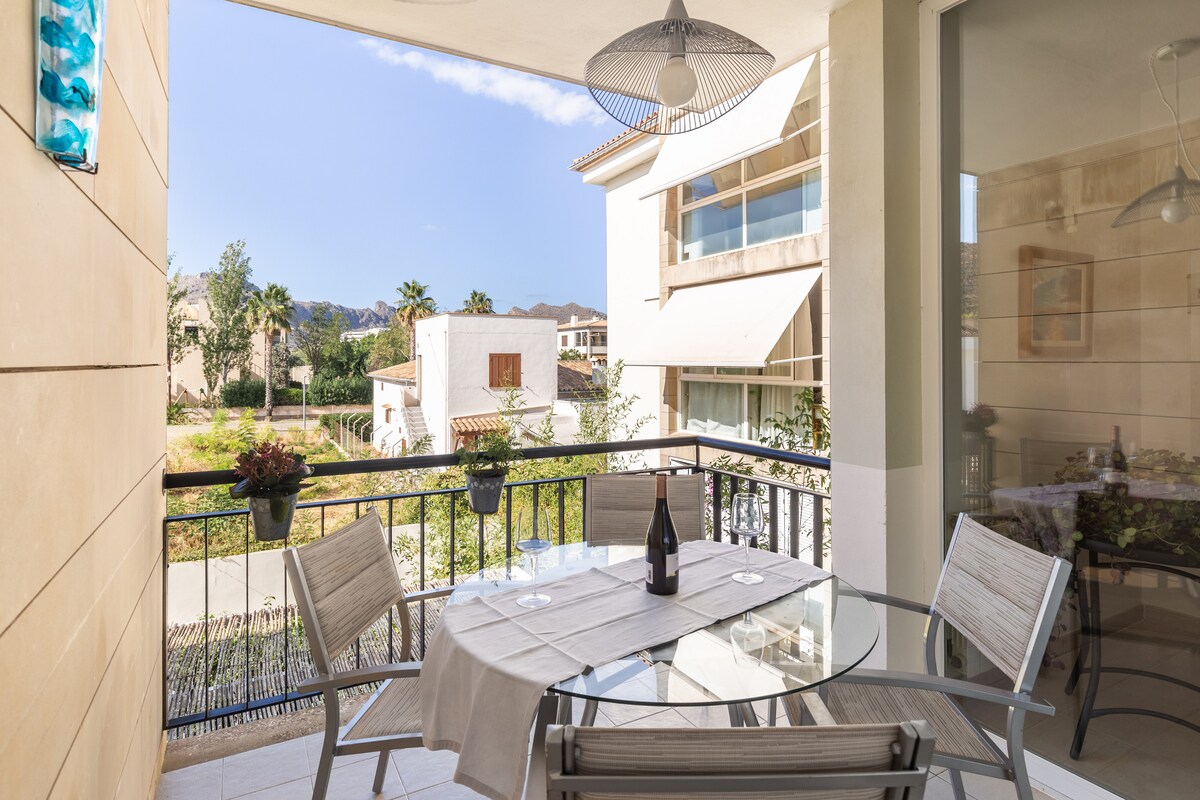
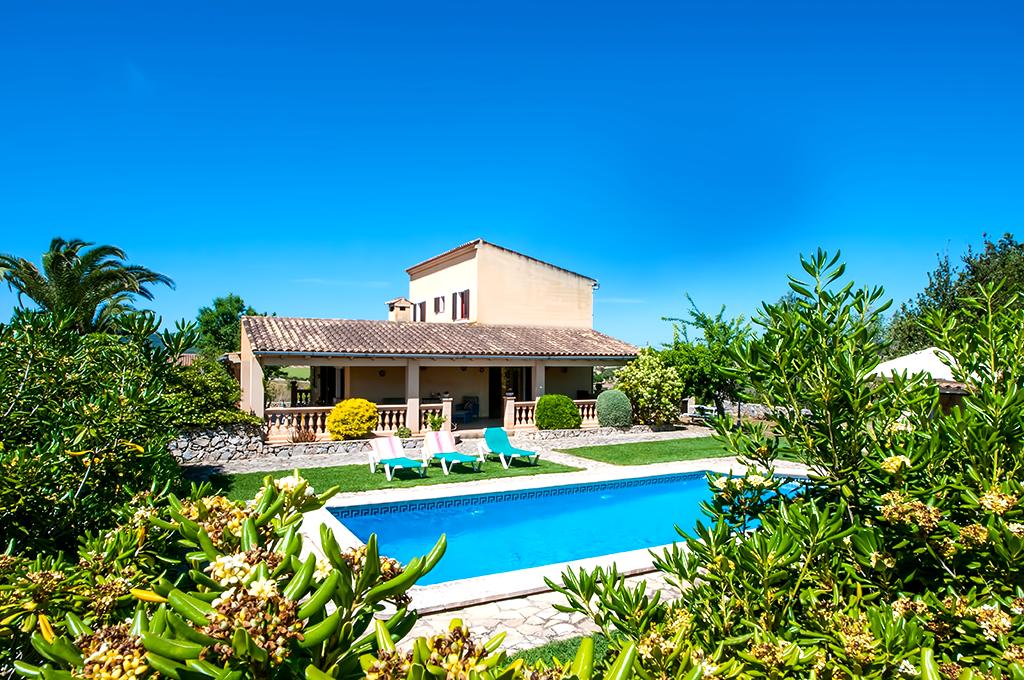
Pollença, located in northern Mallorca, is a destination of singular beauty that blends history, culture, and spectacular landscapes between the Serra de Tramuntana and the sea. Its picturesque old town and Port de Pollença attract high-quality European tourism seeking authenticity and tranquility. The vacation rental market is extraordinarily profitable here, featuring an average daily rate of €337. Visitors value traditional estates with pools and modern bay-front apartments, resulting in an impressive annual revenue of €92,430.
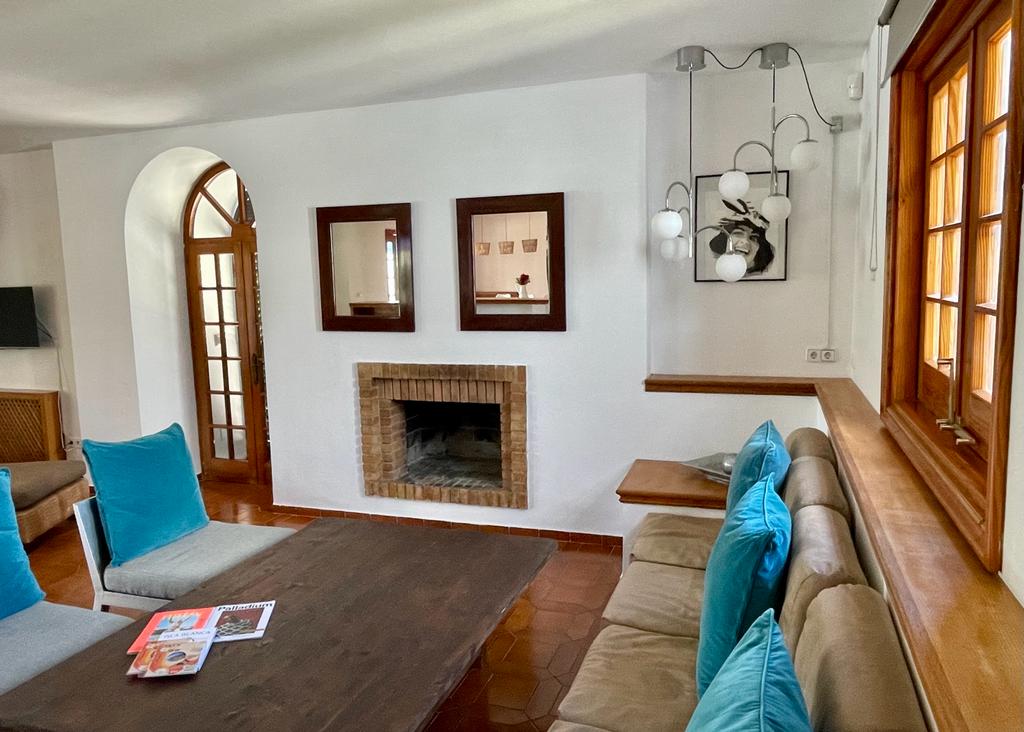
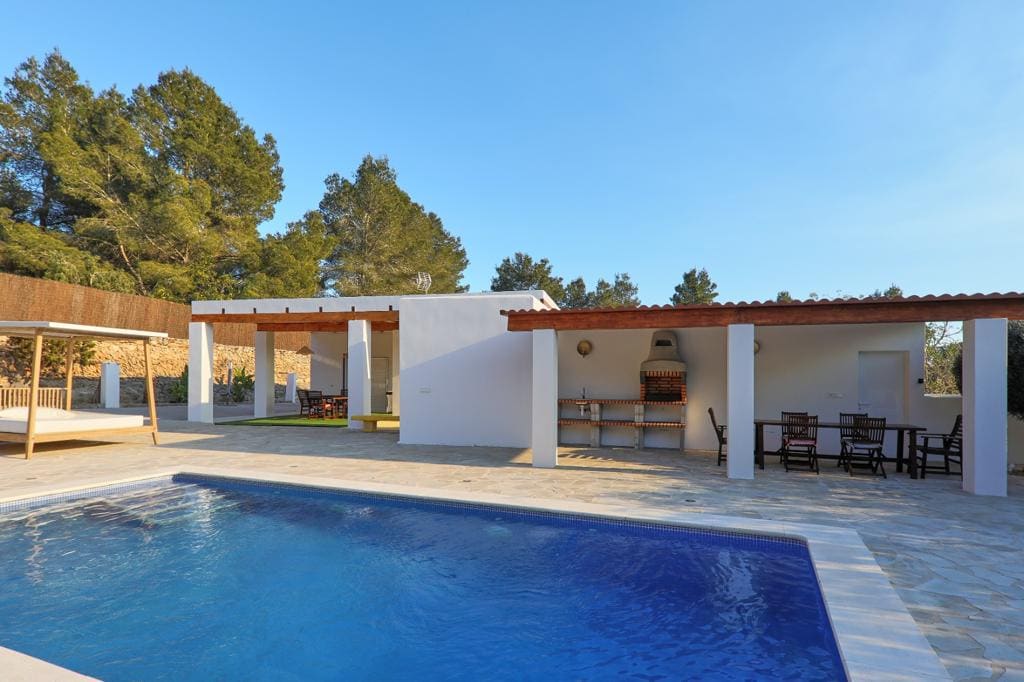
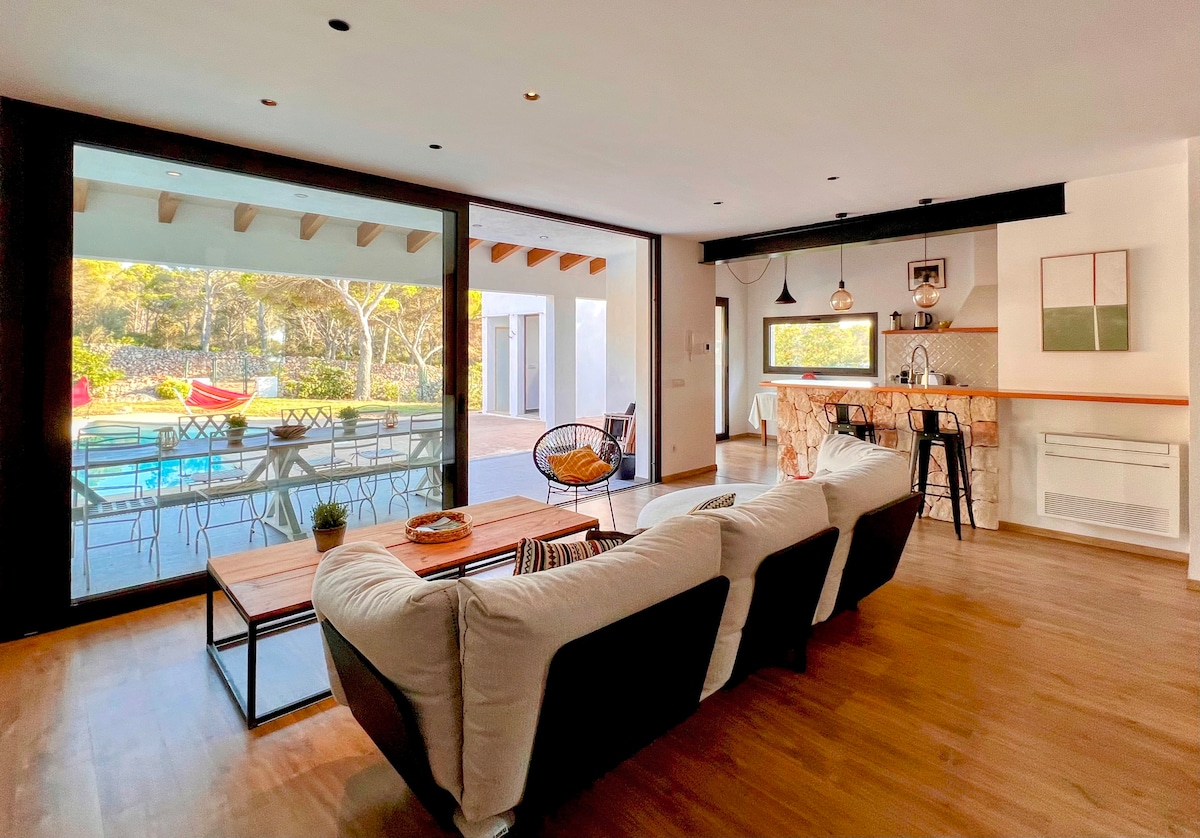
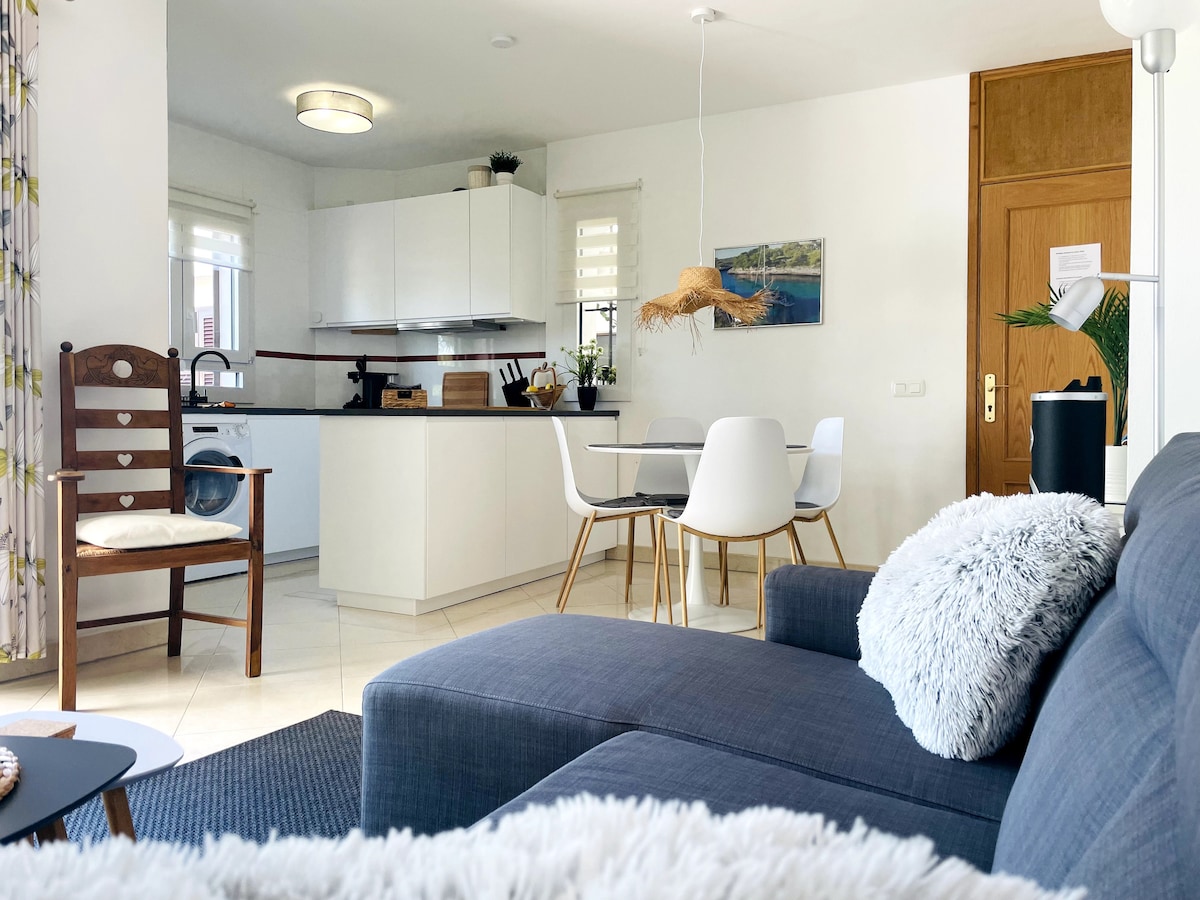
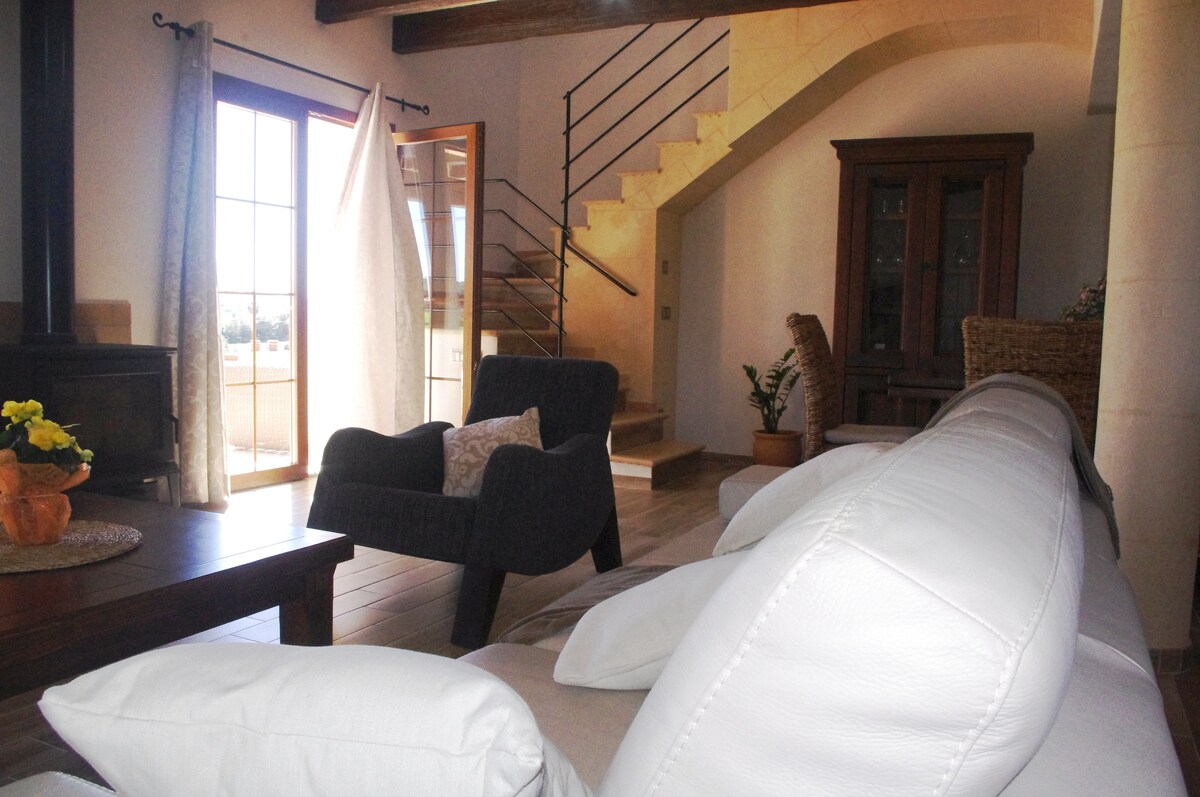
Featured Listings
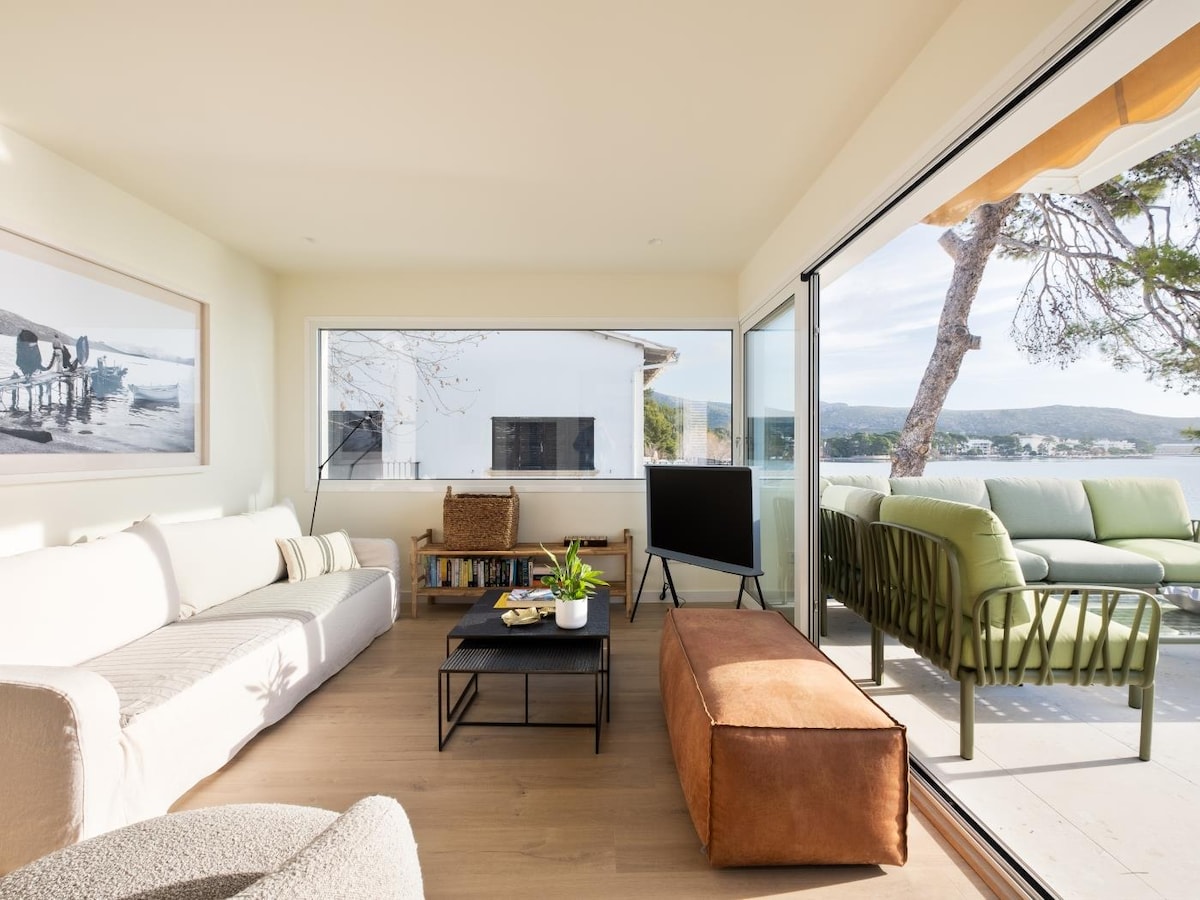
Sant Josep de sa Talaia, the largest municipality in Ibiza, is home to some of the island’s most iconic coves, such as Cala Comte and Cala Bassa. It is a premier luxury market where exclusivity and nature converge. Vacation rentals feature spectacular villas with sunset views and high-end properties, reaching a record-breaking average daily rate of €787. Visitors seek privacy and authentic Ibizan style, ensuring exceptional profitability with an annual revenue per listing of €183,355 in this privileged Mediterranean corner.
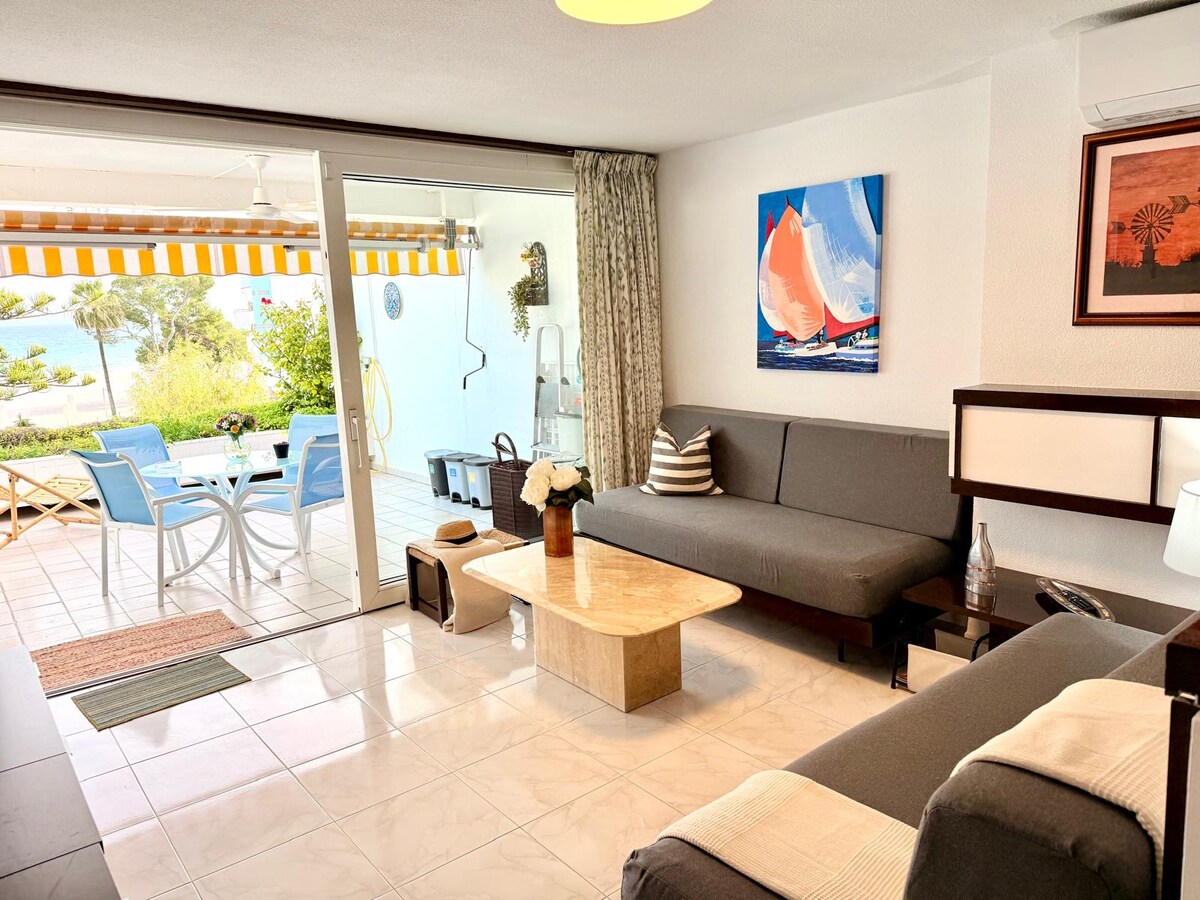
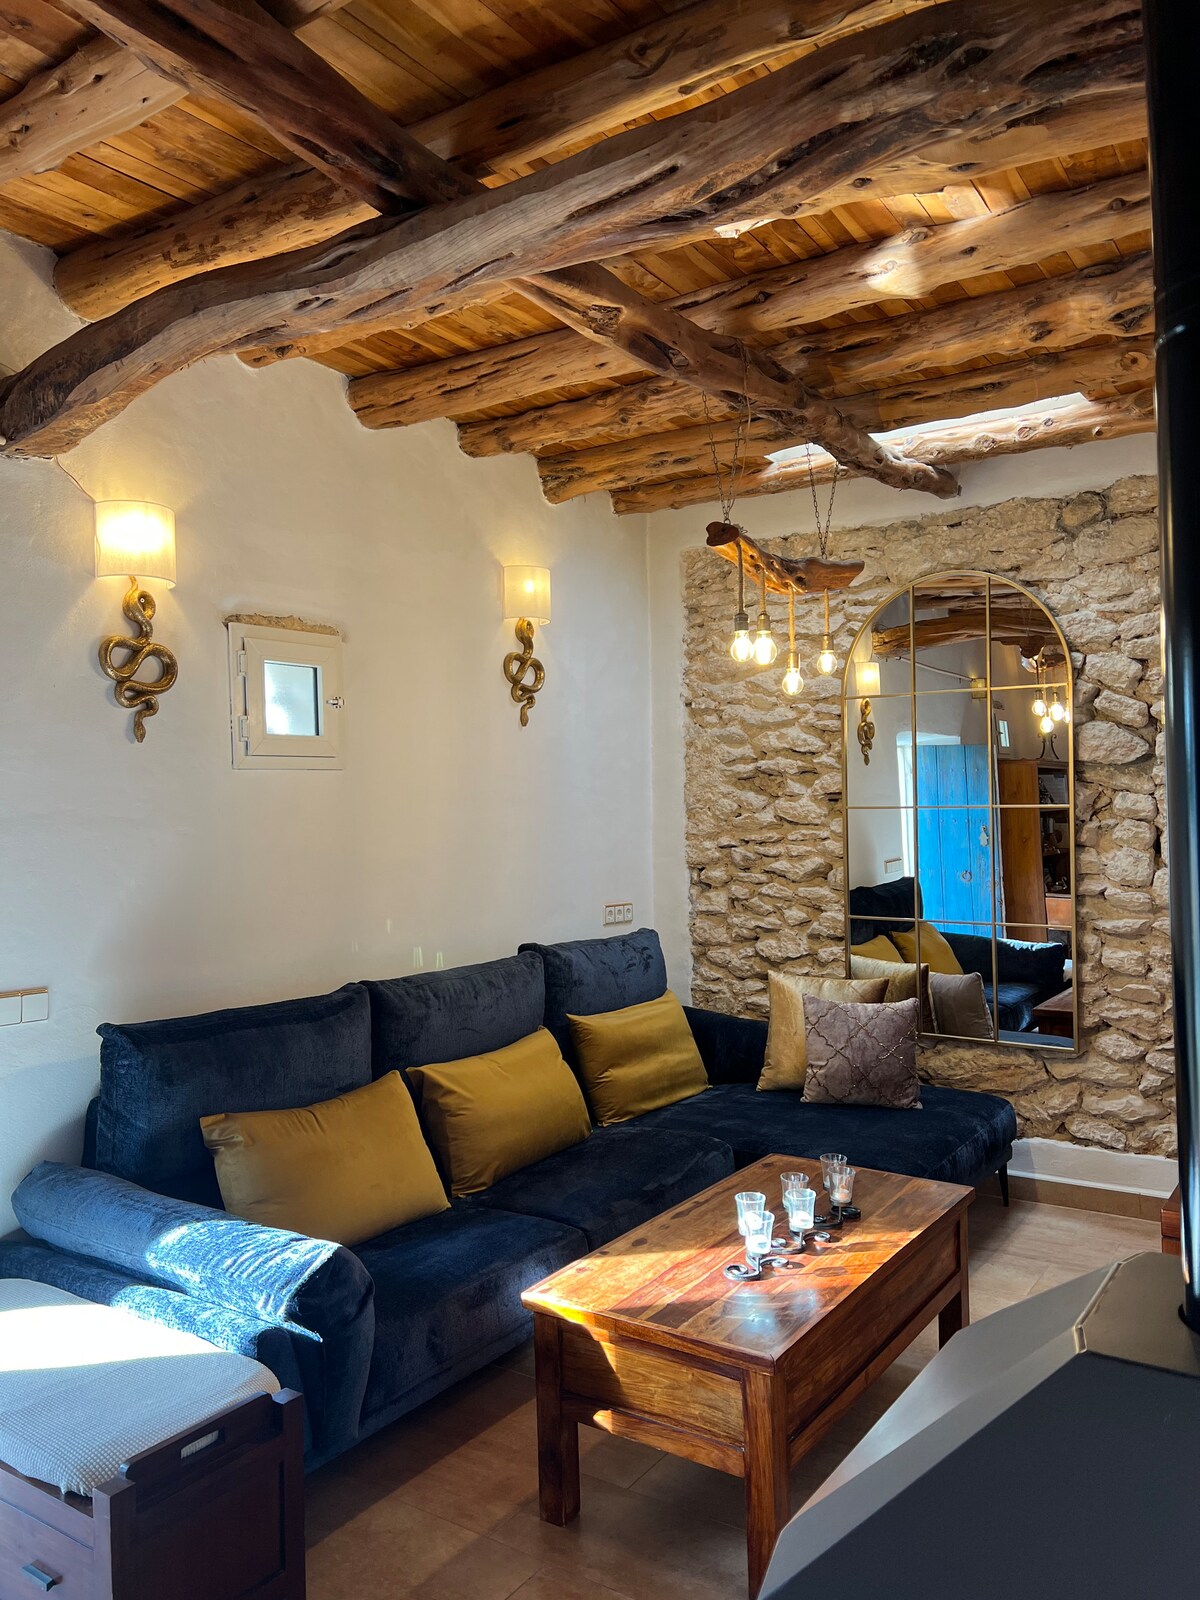
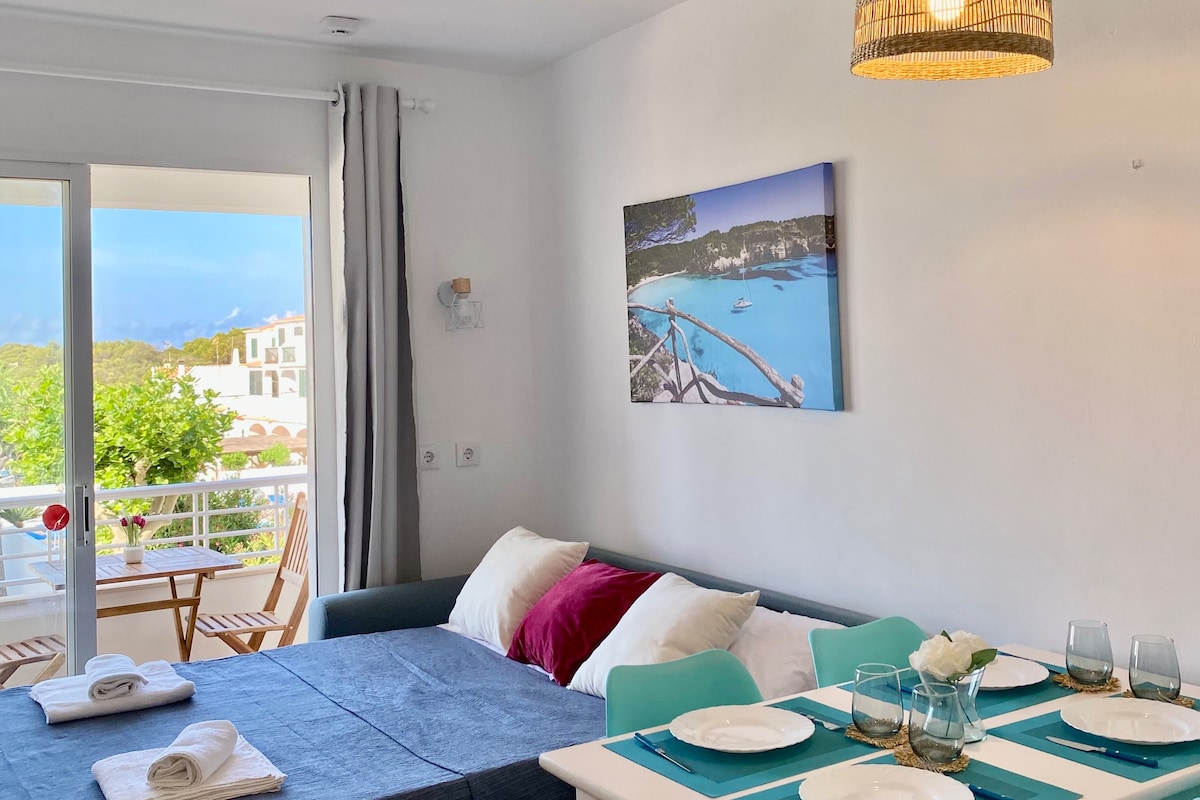
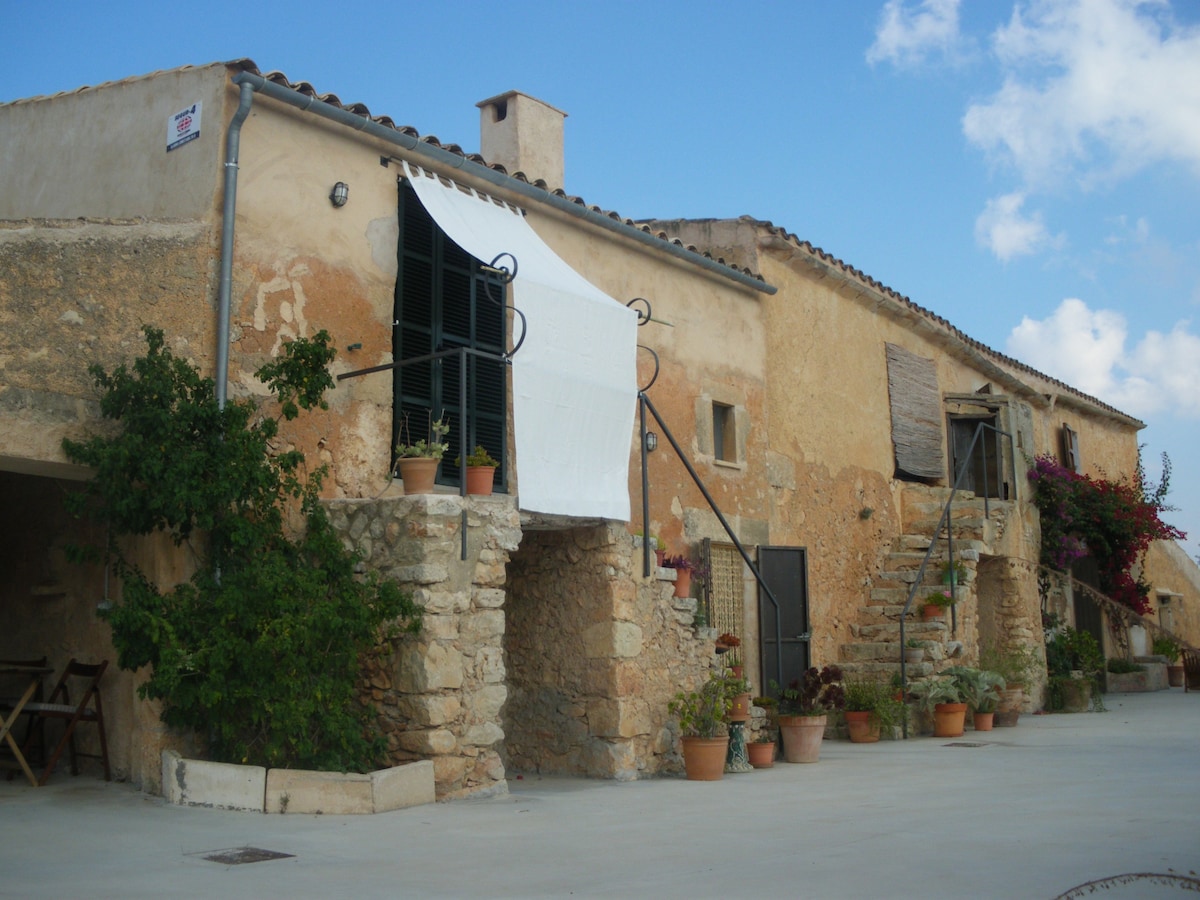
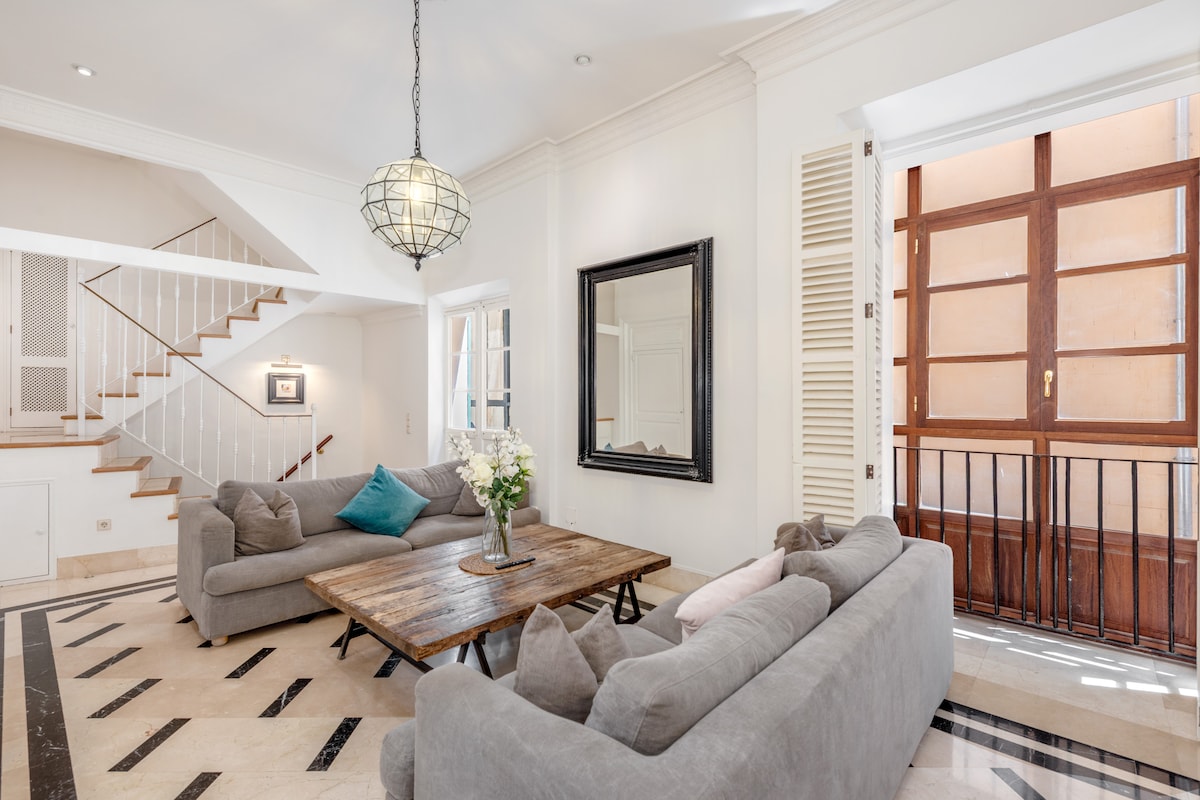
Featured Listings

Alcúdia, with its medieval walled town and spectacular white-sand bay, is one of Mallorca’s primary tourism drivers. It is a versatile destination attracting families, sports enthusiasts, and history lovers alike. The Airbnb market is very dynamic, boasting an occupancy rate of 71%. Visitors value historic homes within the town and holiday apartments near the beach, generating an annual revenue of €74,107. Its reputation as a safe and well-rounded destination ensures steady demand throughout the summer season.
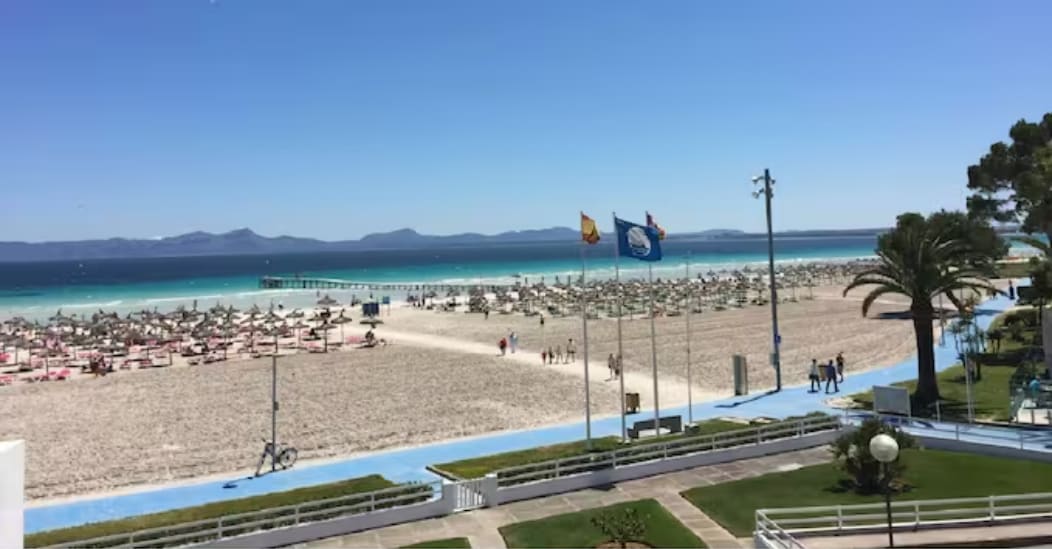
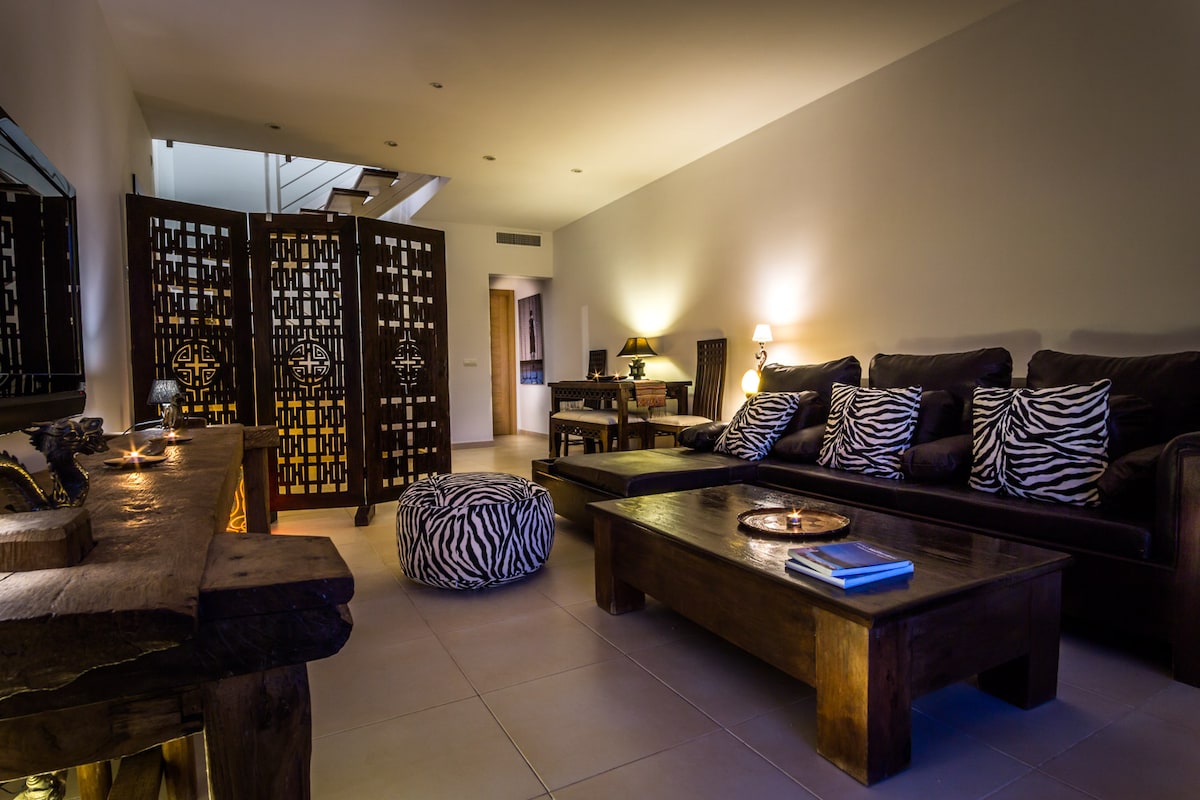
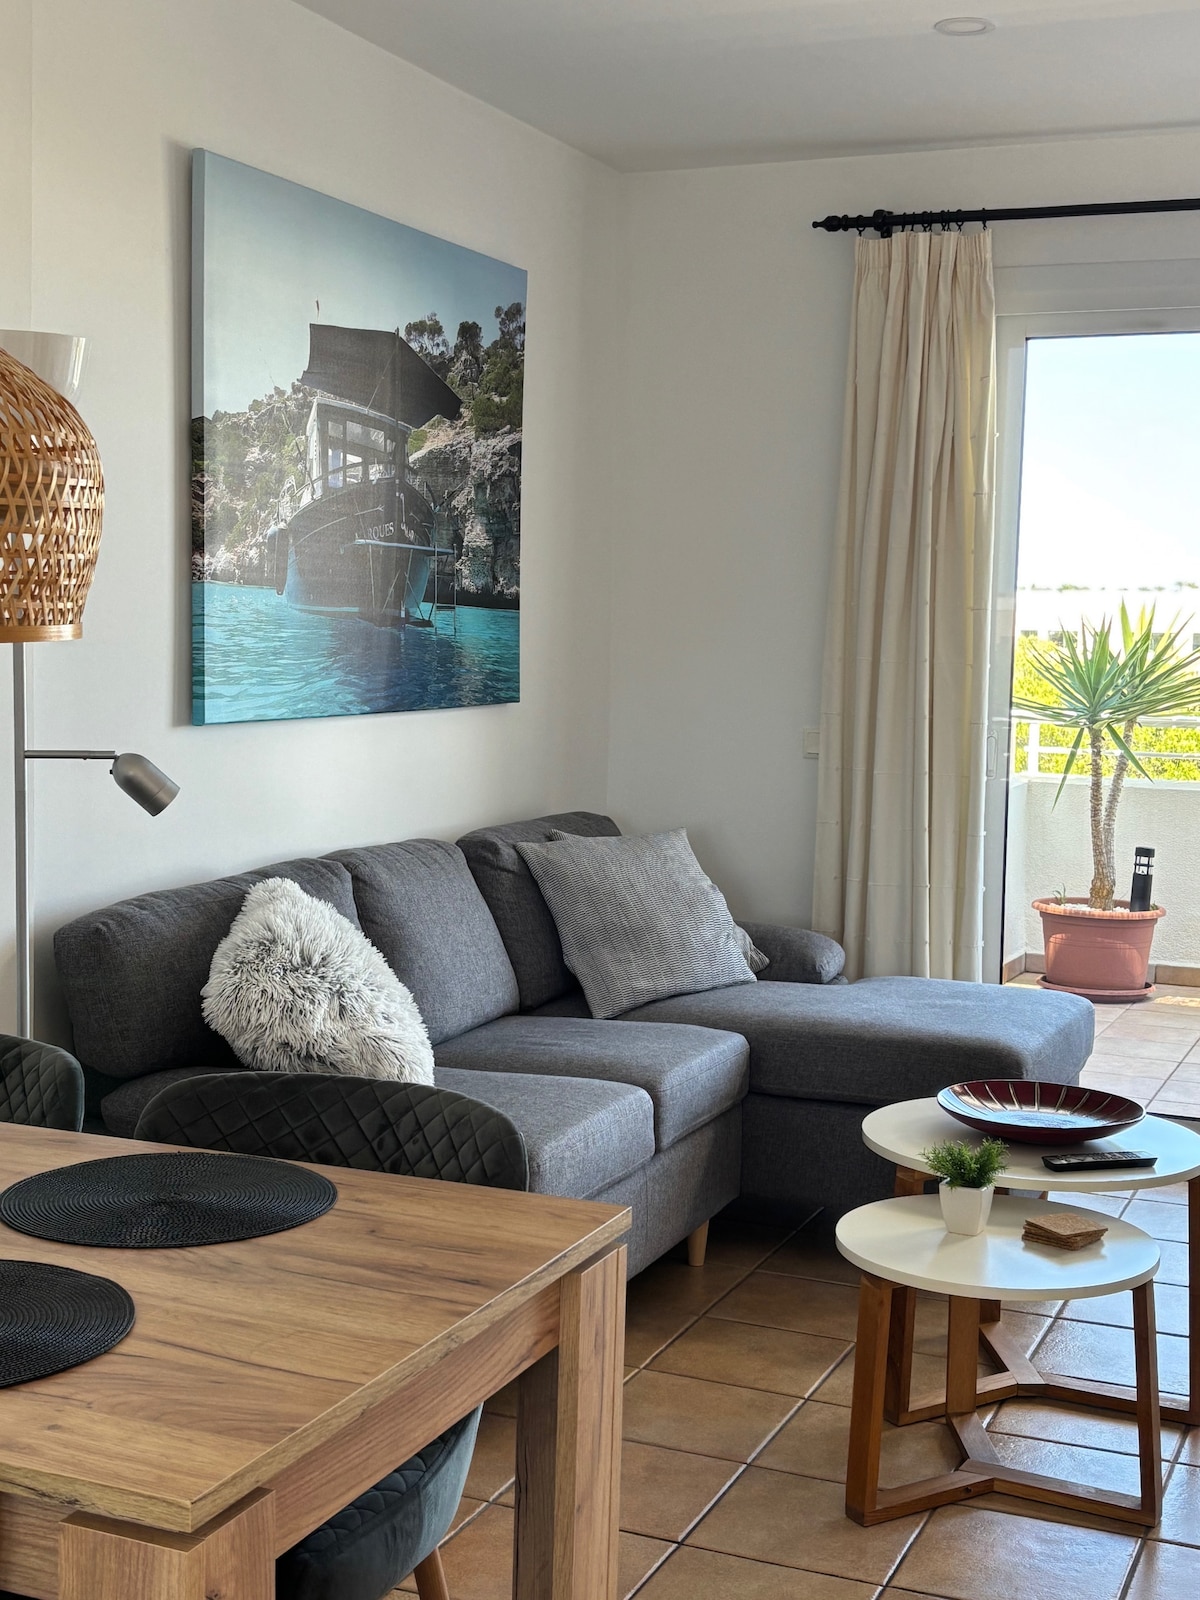
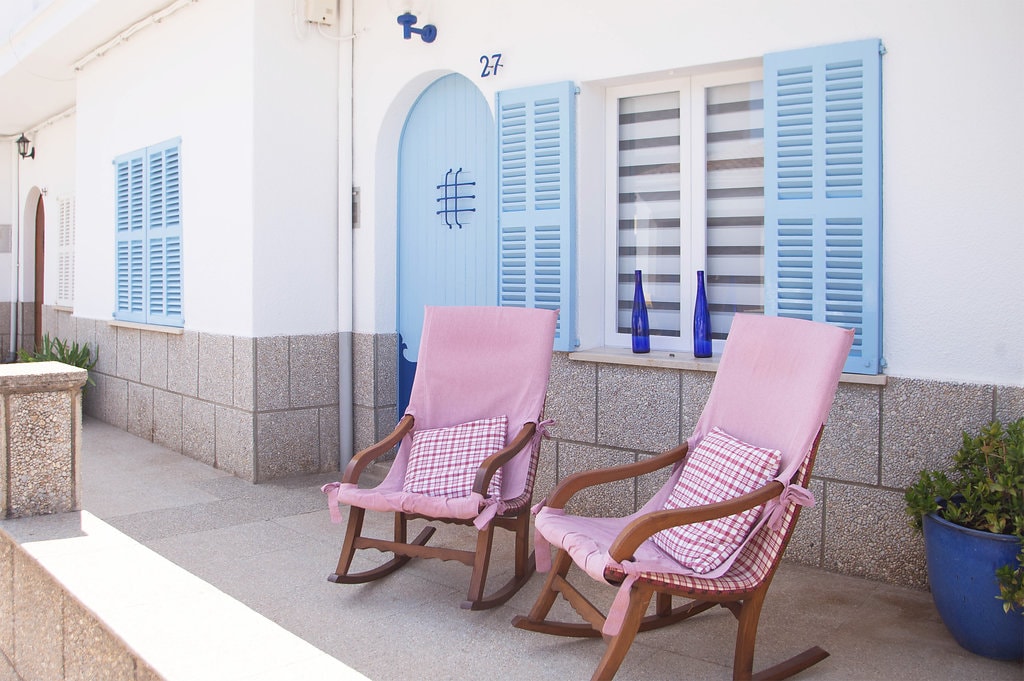
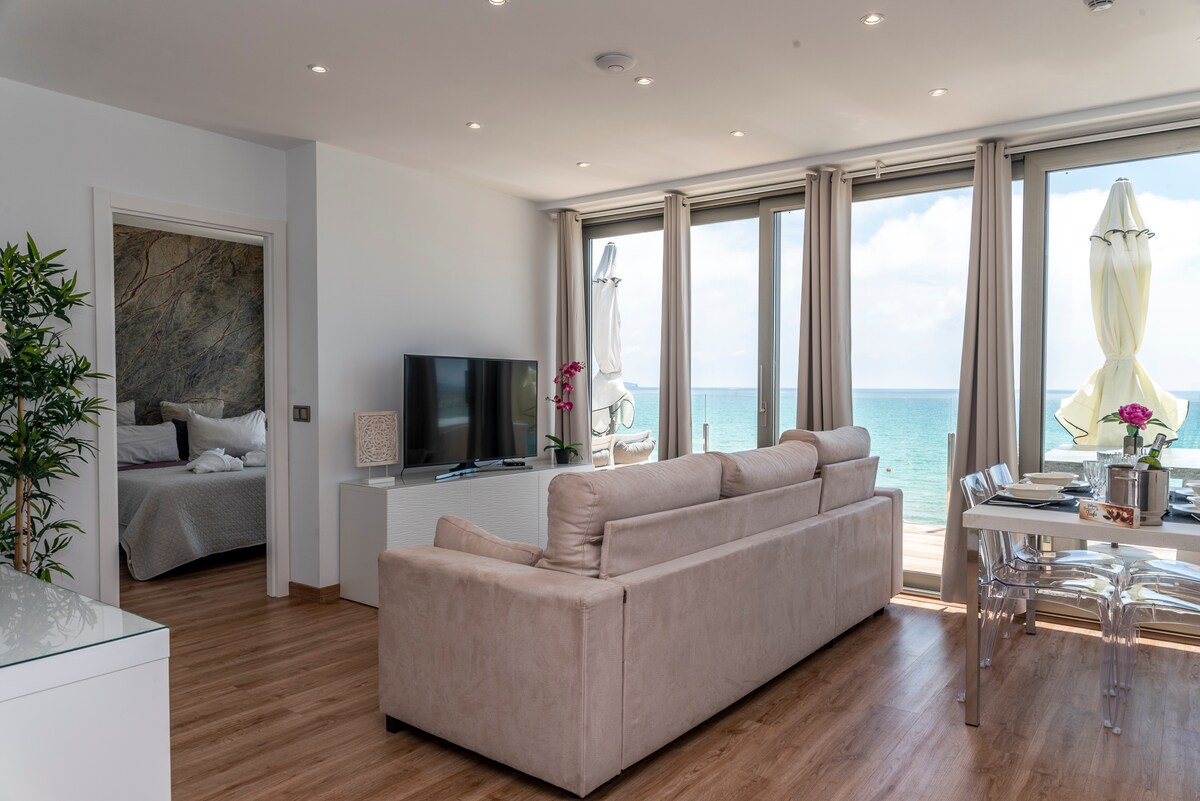
Featured Listings
Santa Eulària des Riu is known as Ibiza’s most family-friendly and peaceful destination, offering a relaxed atmosphere with excellent dining and cultural options. Its exclusive marina and pristine beaches attract an international clientele seeking the island’s charm away from the crowds. The vacation rental market is very solid here, with an average daily rate of €742. The most sought-after properties include high-quality city-center apartments and renovated rural villas, delivering an annual revenue of €167,030 for hosts in this chic and calm destination.
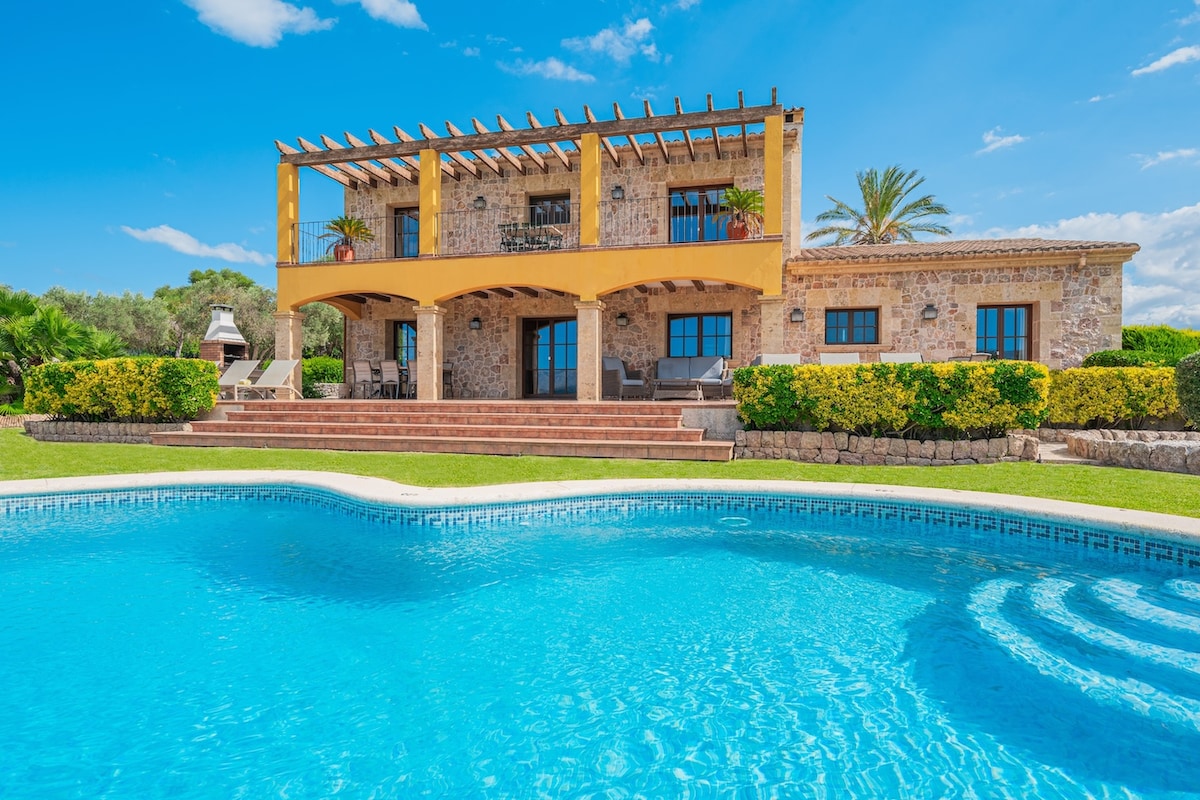
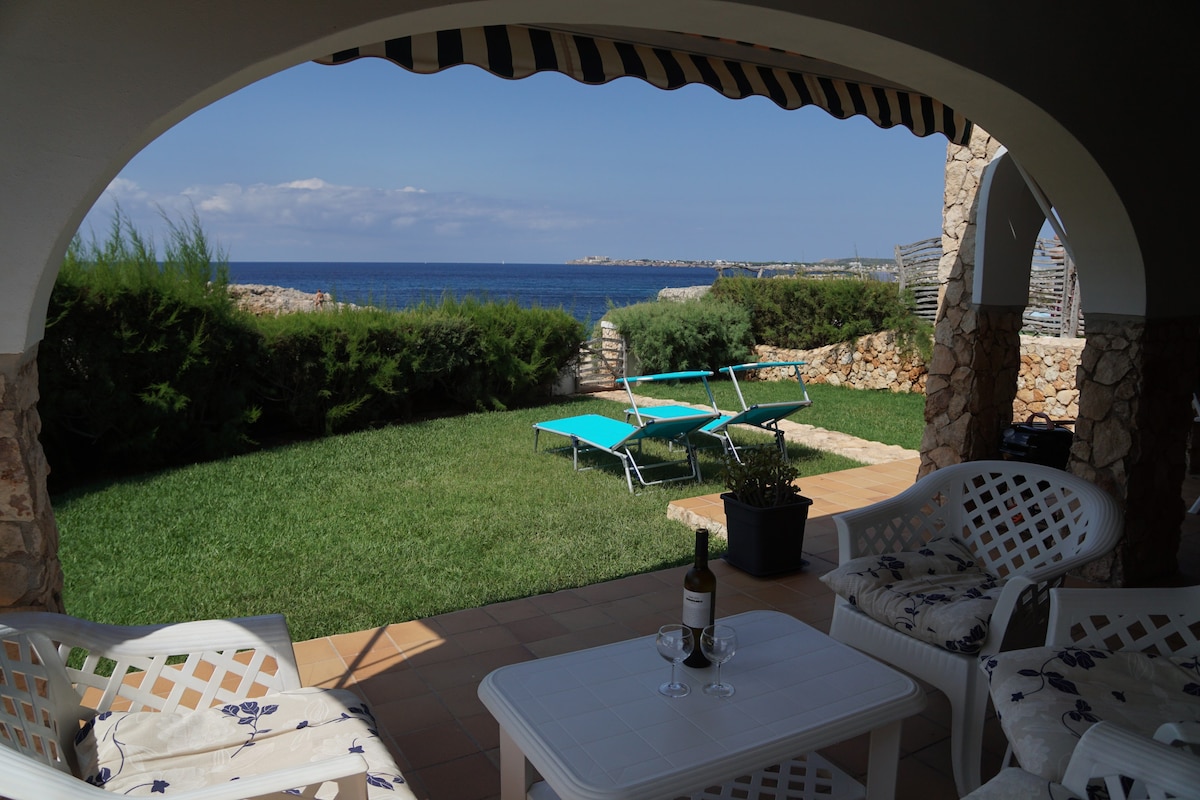
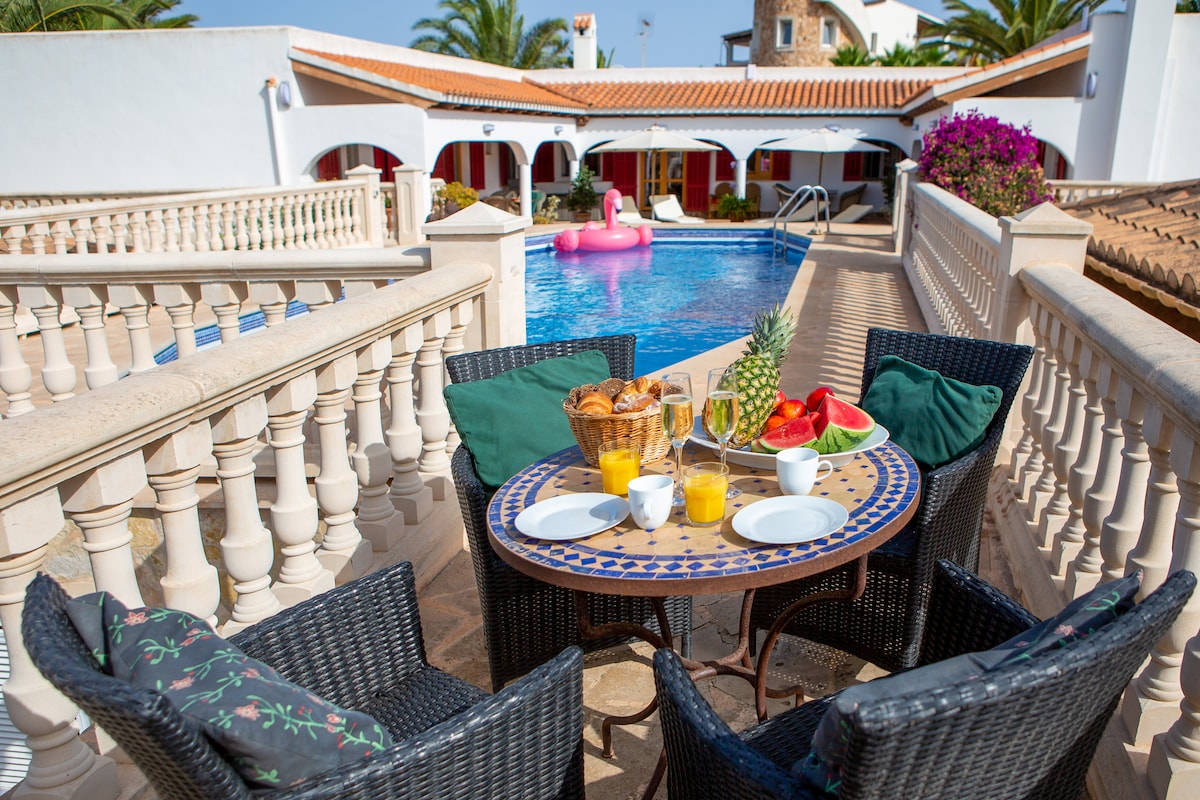
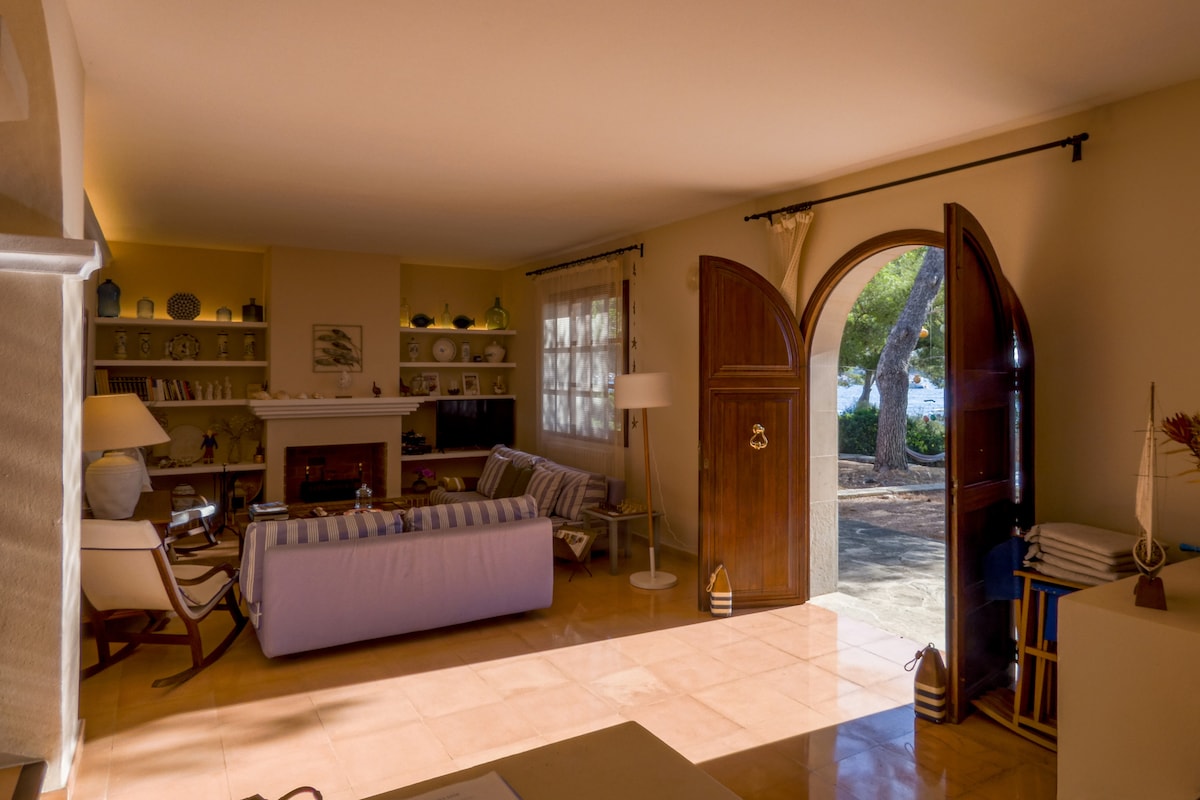
Featured Listings
Ciutadella, the former capital of Menorca, exudes nobility and elegance through its cobbled streets and palaces. Its historic harbor and crystal-clear coves make it the island’s most coveted destination. The vacation rental market is very solid here, with an occupancy rate of 71%. Visitors seek the local flavor in stately city-center homes or the convenience of villas in nearby coastal developments, generating an annual revenue of €63,076 in a destination that prioritizes sustainability and high-quality tourism.
Featured Listings
Santanyí, in southeastern Mallorca, is a charming village known for its golden stone houses and artistic atmosphere. It is the gateway to pristine beaches like Cala Llombards and the Mondragó Natural Park. This market attracts a sophisticated European crowd seeking the most authentic and unhurried Mallorca. Vacation rentals are upscale here, reaching an average daily rate of €335. Rural estates and village houses with courtyards are the star properties, ensuring exceptional profitability with an annual revenue of €87,712 in one of the island’s most beautiful municipalities.
Featured Listings
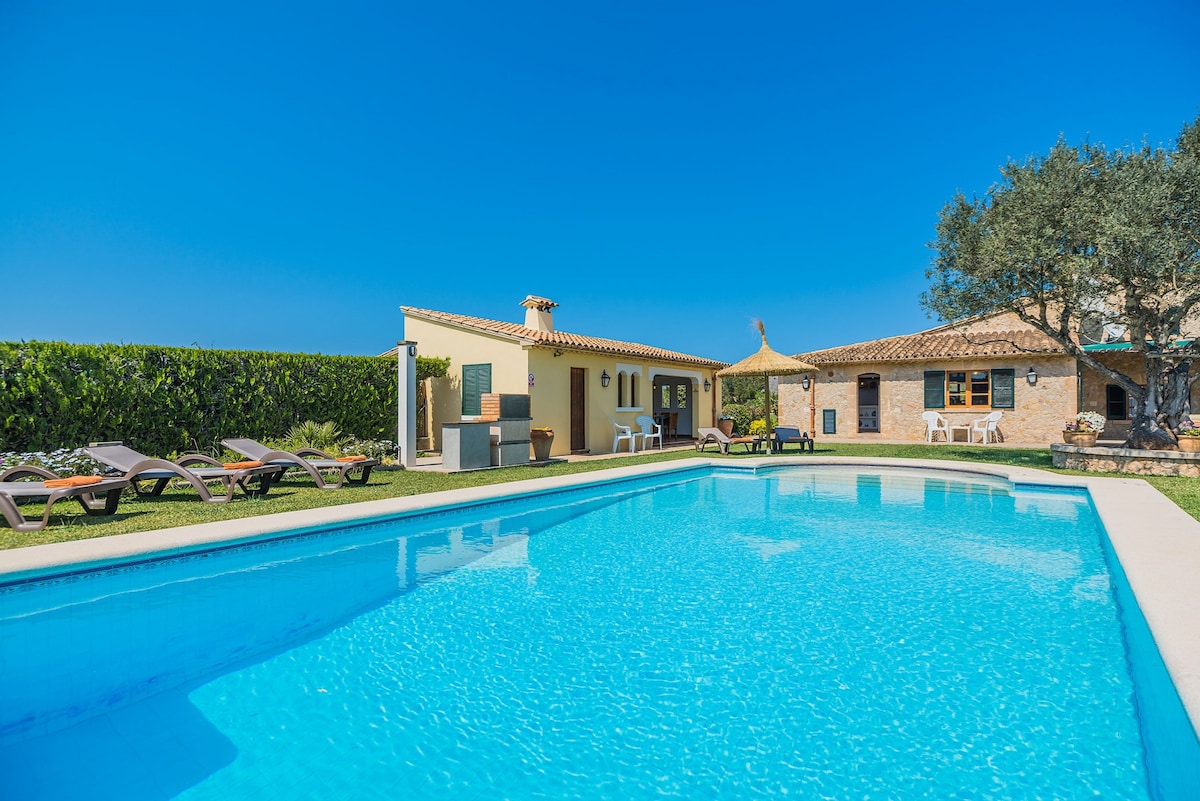
Felanitx, in the heart of eastern Mallorca’s countryside, offers an authentic rural tourism experience surrounded by vineyards and featuring the spectacular San Salvador Monastery on its heights. It is a market that attracts travelers seeking peace and local culture, just minutes from the beaches of Portocolom. Vacation rentals focus on high-character rustic estates, reaching an average daily rate of €342. These properties, highly valued by Central European tourists, ensure an annual revenue of €83,349, making Felanitx a strategic destination for agritourism investment.
Featured Listings
Manacor, more than just the home of Rafa Nadal, offers a spectacular coastline with pristine coves like Cala Varques and an interior rich in tradition. It is a diverse market attracting tourists who want to combine relaxation, sports, and nature. Vacation rentals are highly profitable here, featuring an average daily rate of €292. The most sought-after properties are traditional-style country houses and modern villas with sea views, delivering an annual revenue of €72,021. Its authenticity and strategic location in eastern Mallorca ensure growing demand from international travelers.
Featured Listings

Palma, the vibrant capital of Mallorca, is a Mediterranean jewel offering world-class culture, shopping, and dining year-round. Its old town, dominated by La Seu cathedral, and trendy neighborhoods like Santa Catalina, attract a cosmopolitan crowd. The vacation rental market is highly competitive and lucrative, with an average daily rate of €323. Visitors seek the character of renovated apartments in historic buildings or the modern appeal of penthouses with views, leveraging the city’s excellent connectivity for both city breaks and extended stays.
Featured Listings

Featured Listings
Get Live Illes Balears, Spain Market Intelligence
Discover detailed Illes Balears, Spain Airbnb Analytics and explore real-time market data to make accurate investment decisions.
Explore Real-time Analytics
Explore Other Markets in Spain
Airbnb Occupancy Rates in Madrid, Comunidad De Madrid
Comunidad De Madrid, Spain
11,548 Active Listings
Airbnb Occupancy Rates in Valencia, Comunitat Valenciana
Valencia / Valencia, Spain
4,692 Active Listings