Best Airbnb Markets in Las Palmas, Canarias
Maximizing your returns in Las Palmas, Canarias depends on choosing the right location with proven demand. We have carefully reviewed the top 10 markets to help you spot emerging trends and high-performing zones for your Airbnb portfolio.
While this data gives you a solid market-wide perspective, successful investing requires property-specific due diligence. For the most accurate filters, occupancy heatmaps, and revenue breakdowns, use GuestFavorites.
Las Palmas Airbnb Market Map (June 2026)
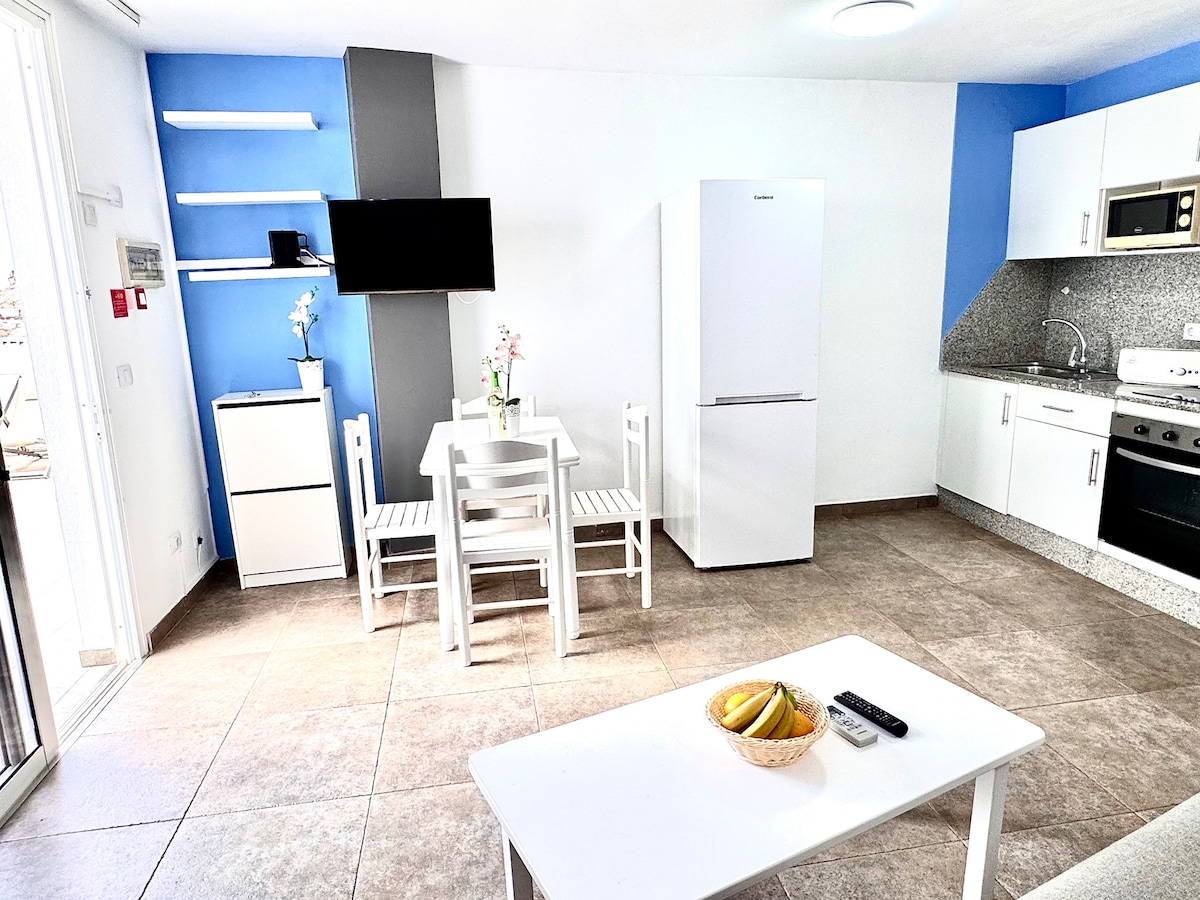
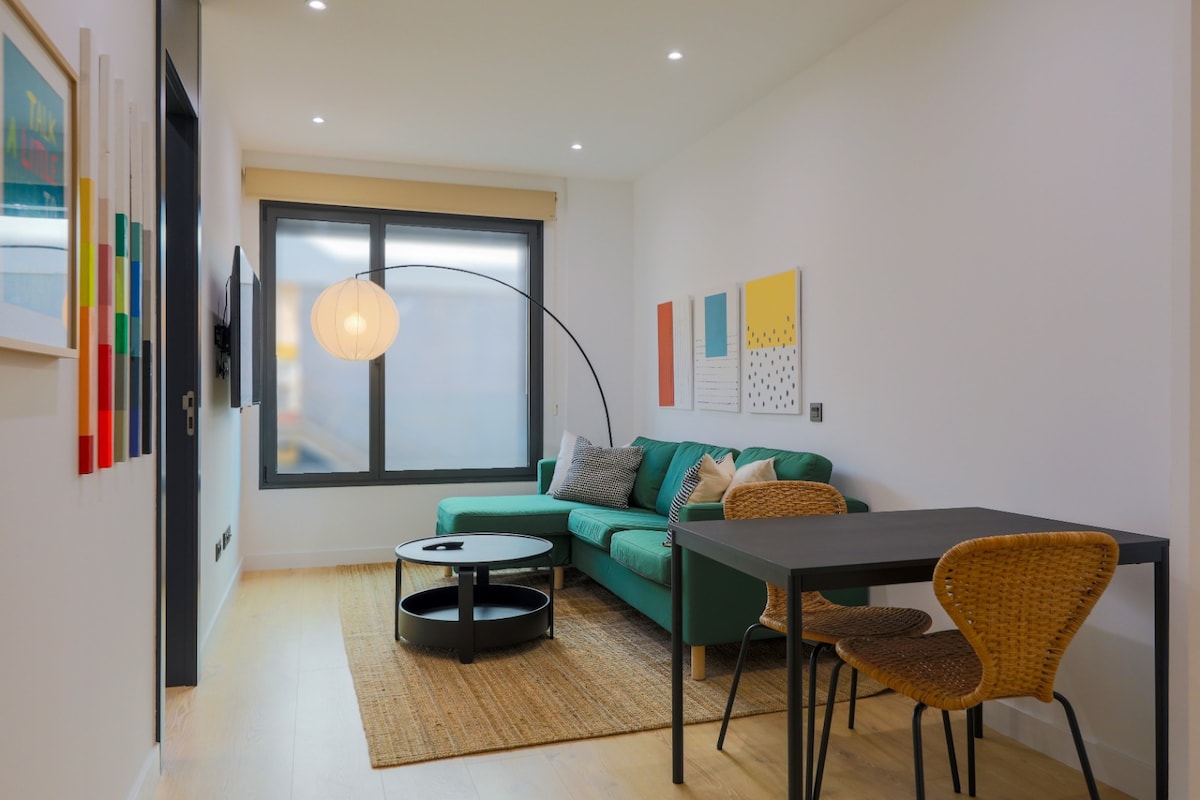
San Bartolomé de Tirajana, the epicenter of tourism in Gran Canaria, captivates visitors with the iconic Maspalomas Dunes and the vibrant atmosphere of Playa del Inglés. This mature and diversified market attracts families and the international LGBTQ+ community, especially during major events like Pride. Properties near the coast or with dune views enjoy exceptionally high demand. Boasting an annual revenue per listing of €37,256, it remains one of the most lucrative destinations for owners seeking stability and high booking volumes.
Featured Listings


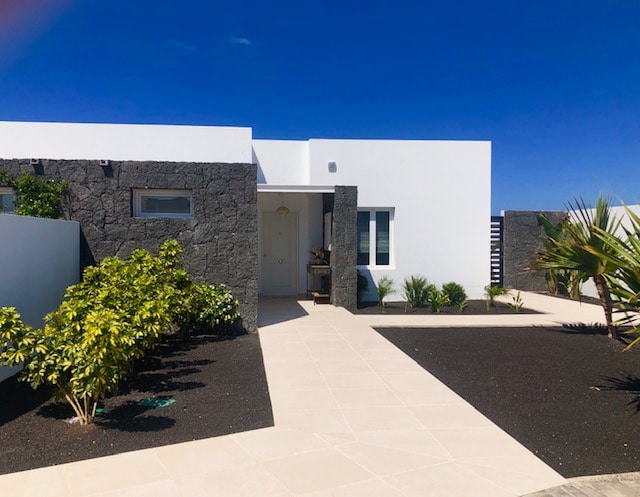
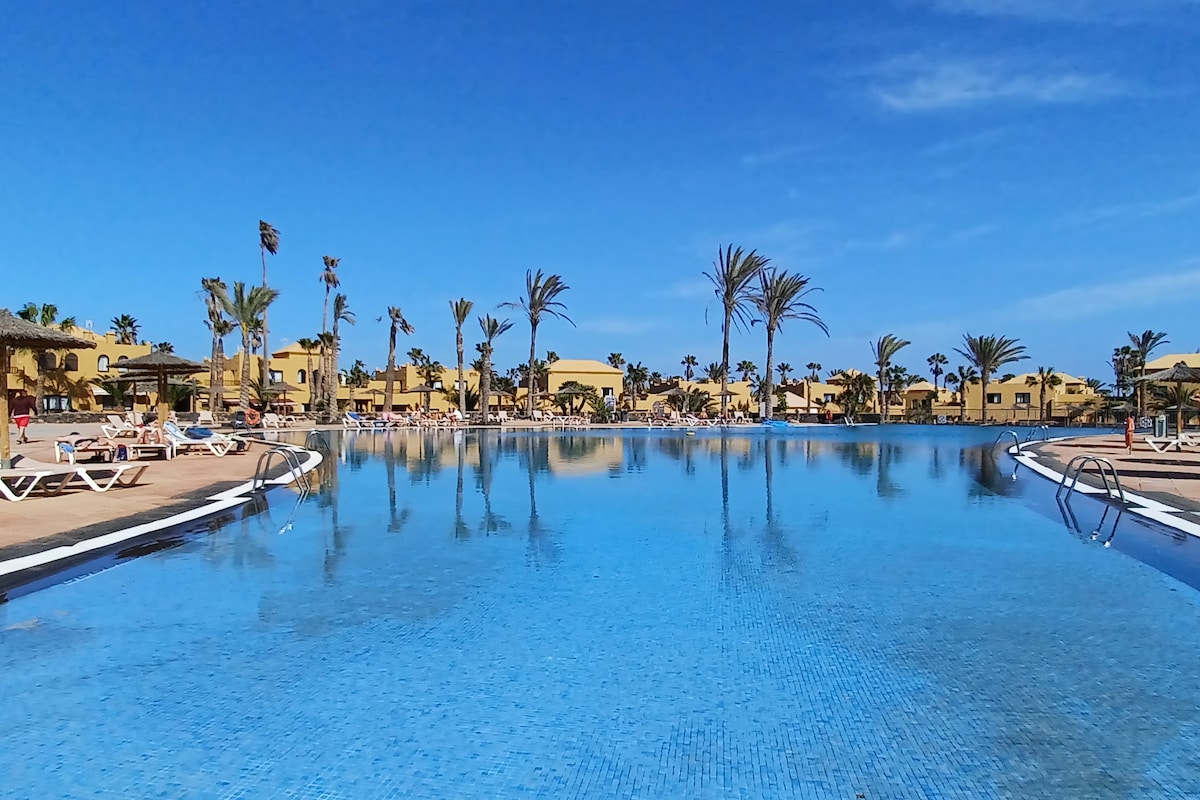
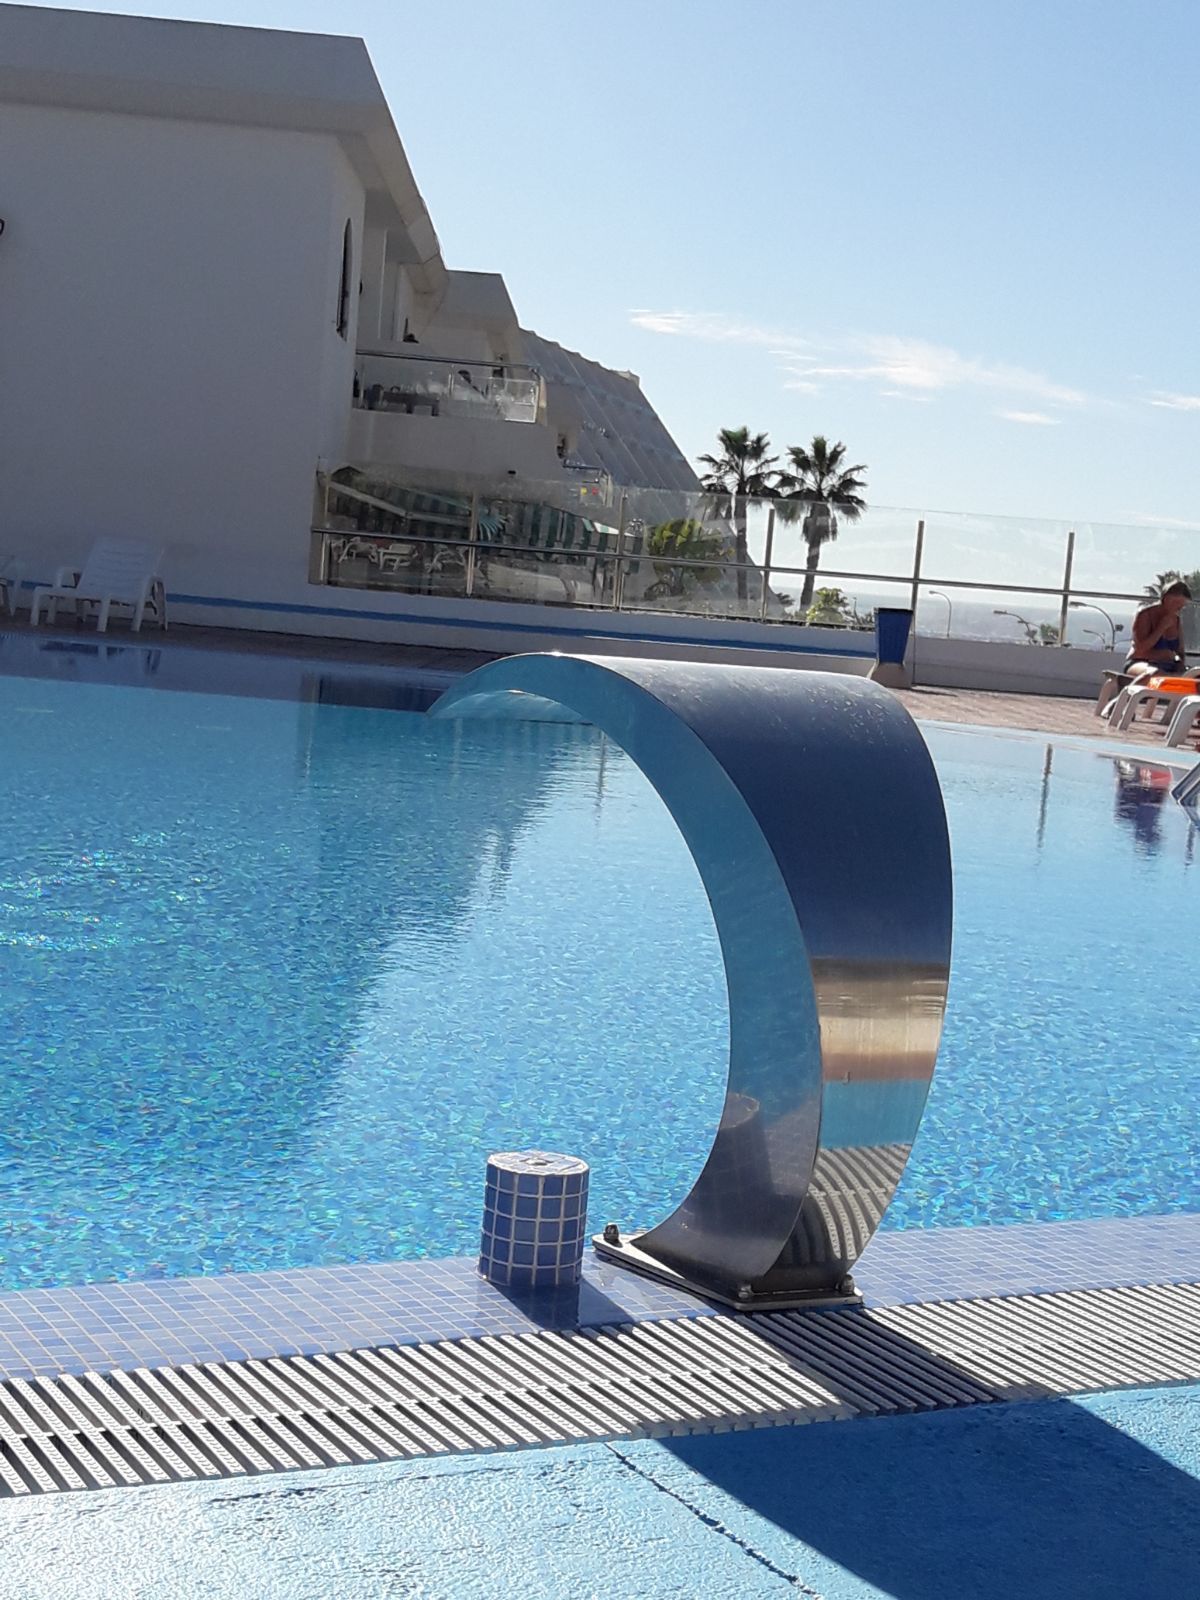
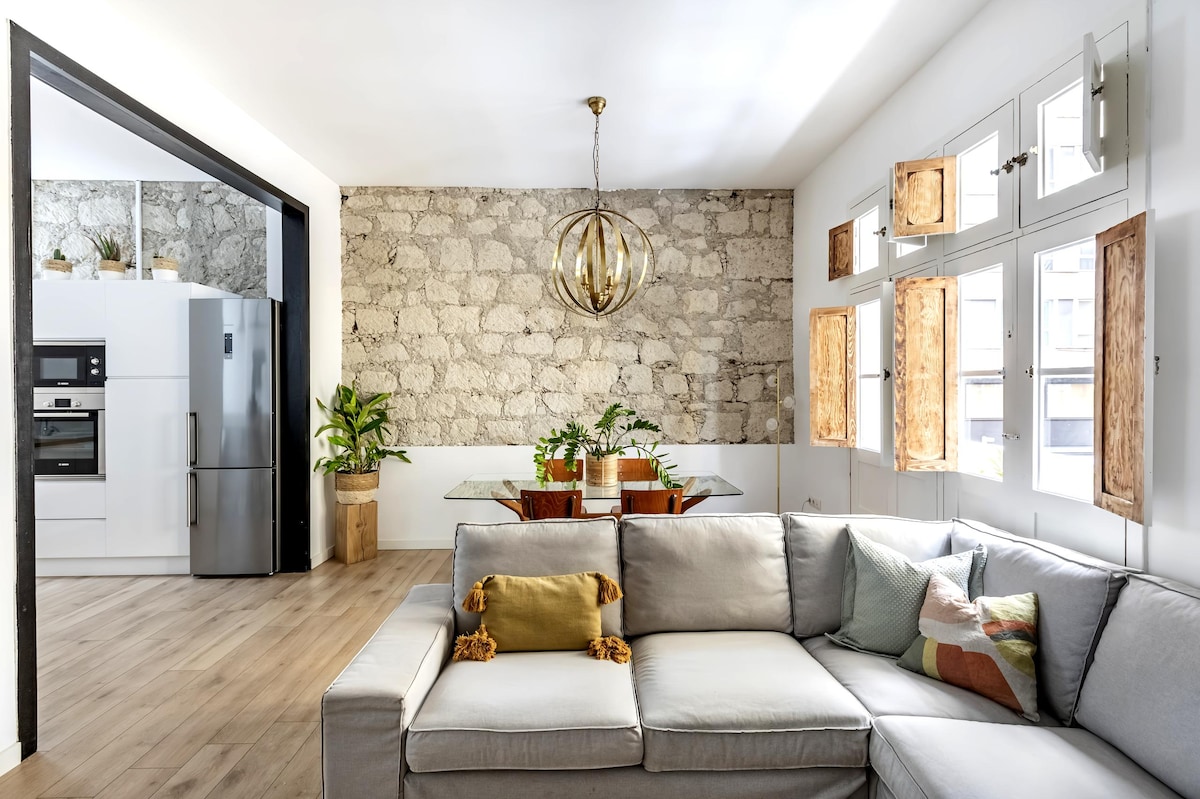
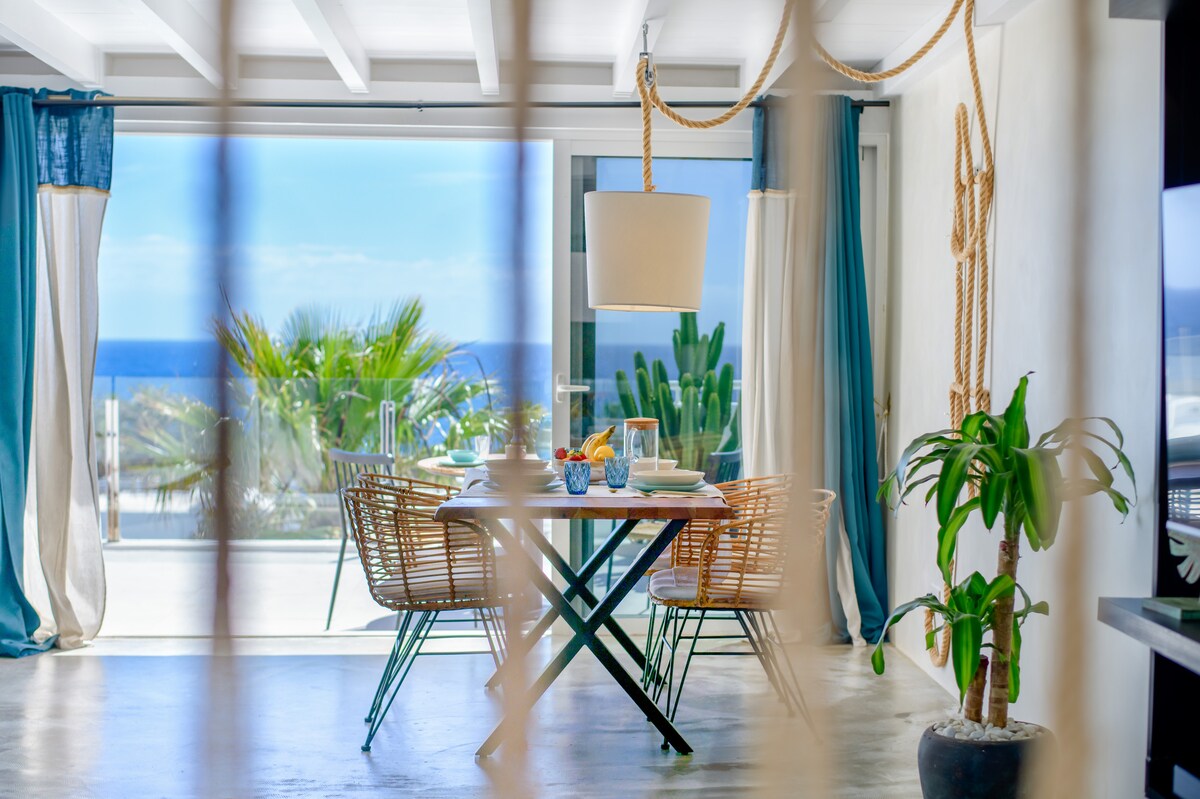
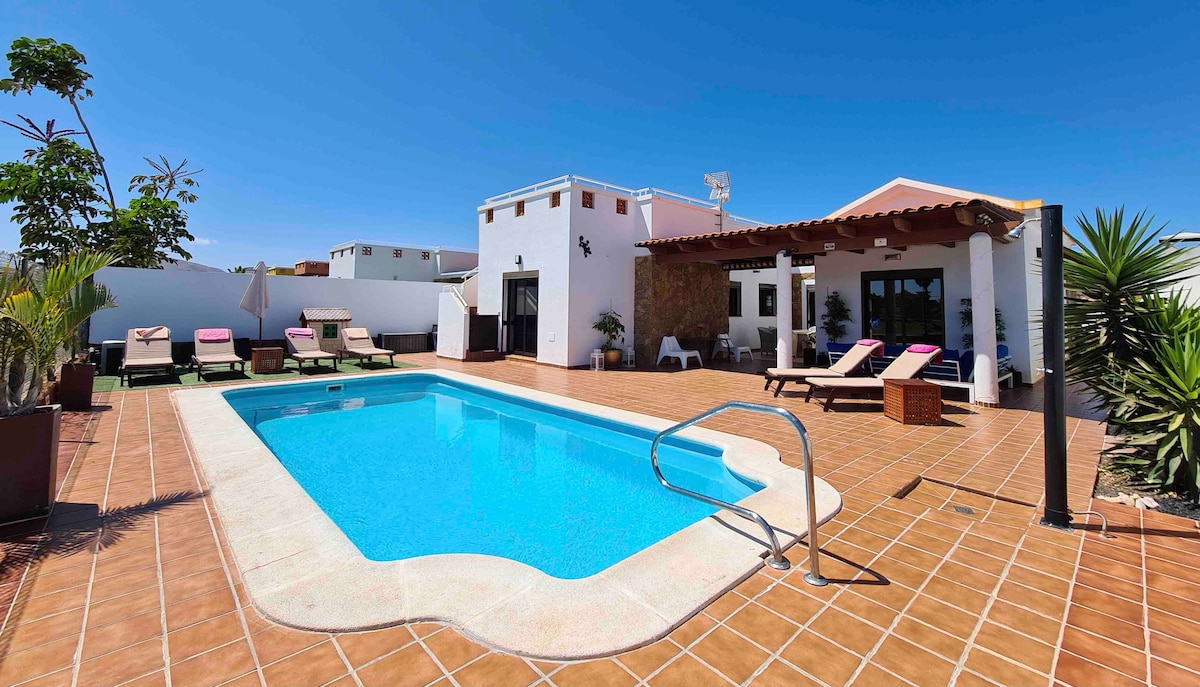
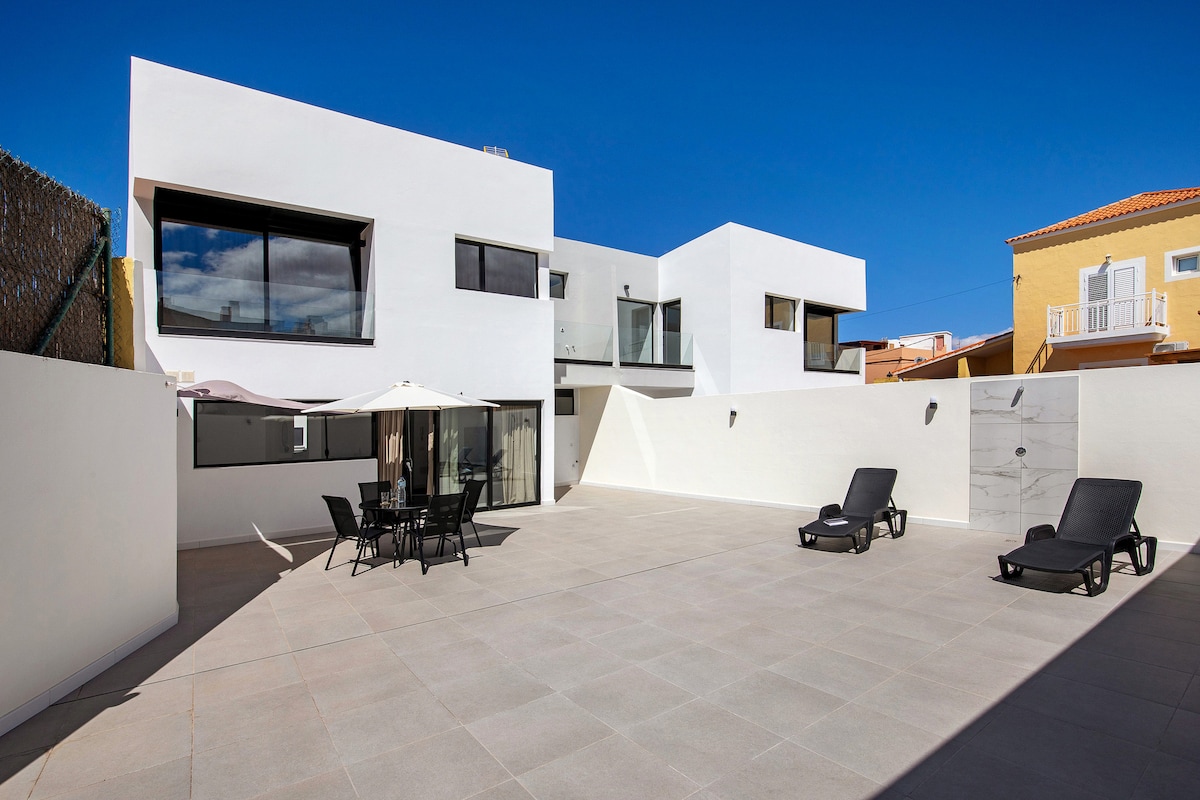
Yaiza, in southern Lanzarote, offers a unique volcanic setting that includes Timanfaya National Park and the charming seaside village of Playa Blanca. This market caters to travelers seeking tranquility, spectacular landscapes, and high quality. The vacation rental sector here is characterized by private pool villas and homes featuring typical Lanzarote architecture. With an impressive occupancy rate of 76%, Yaiza attracts a European clientele that values exclusivity and the preservation of the natural environment.
Featured Listings
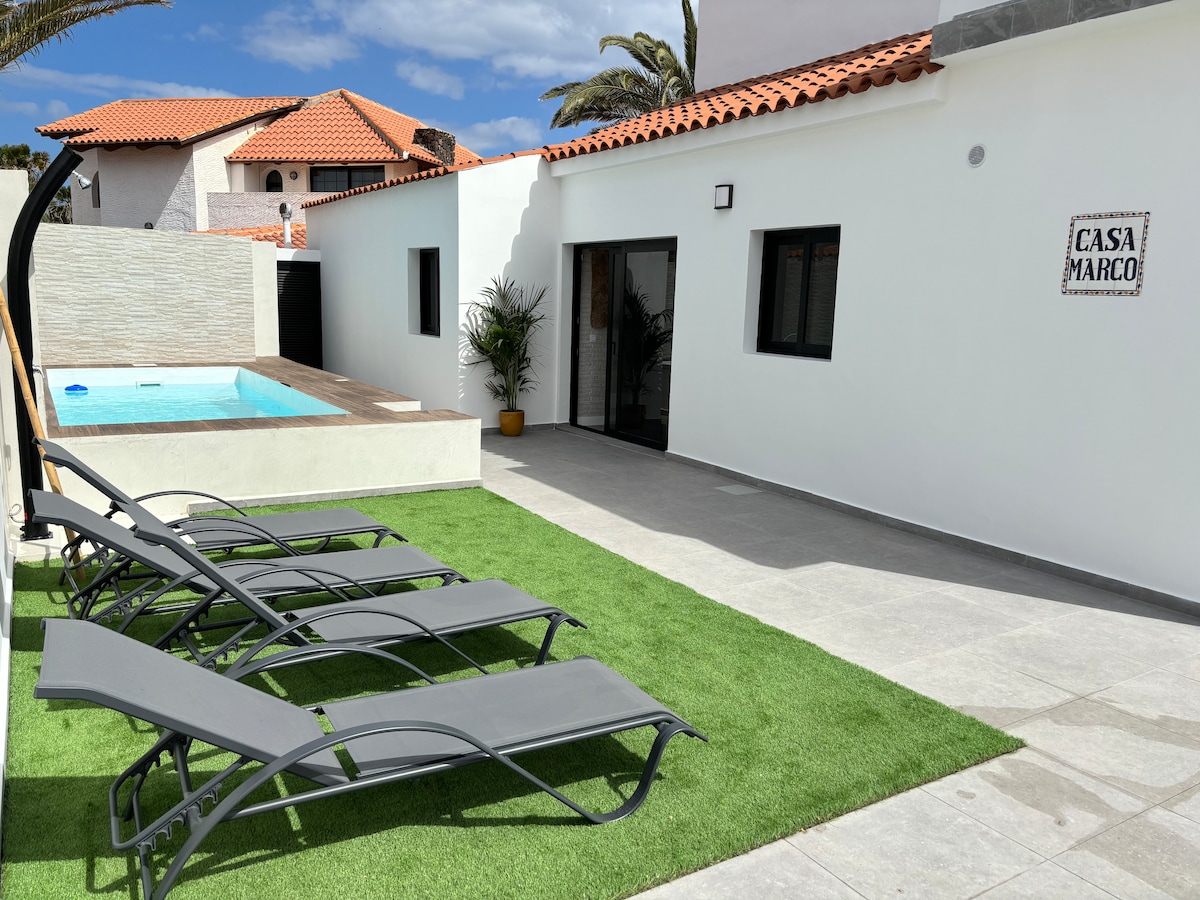
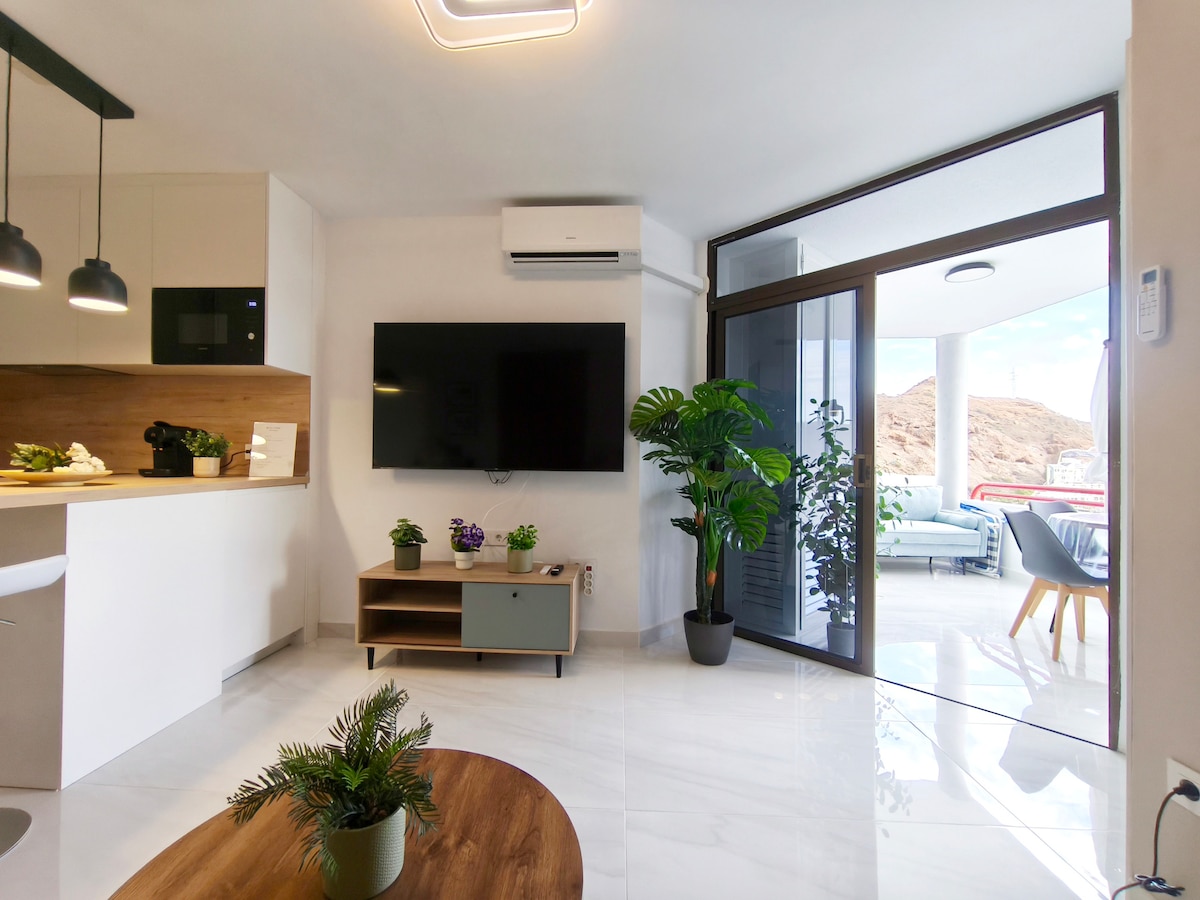
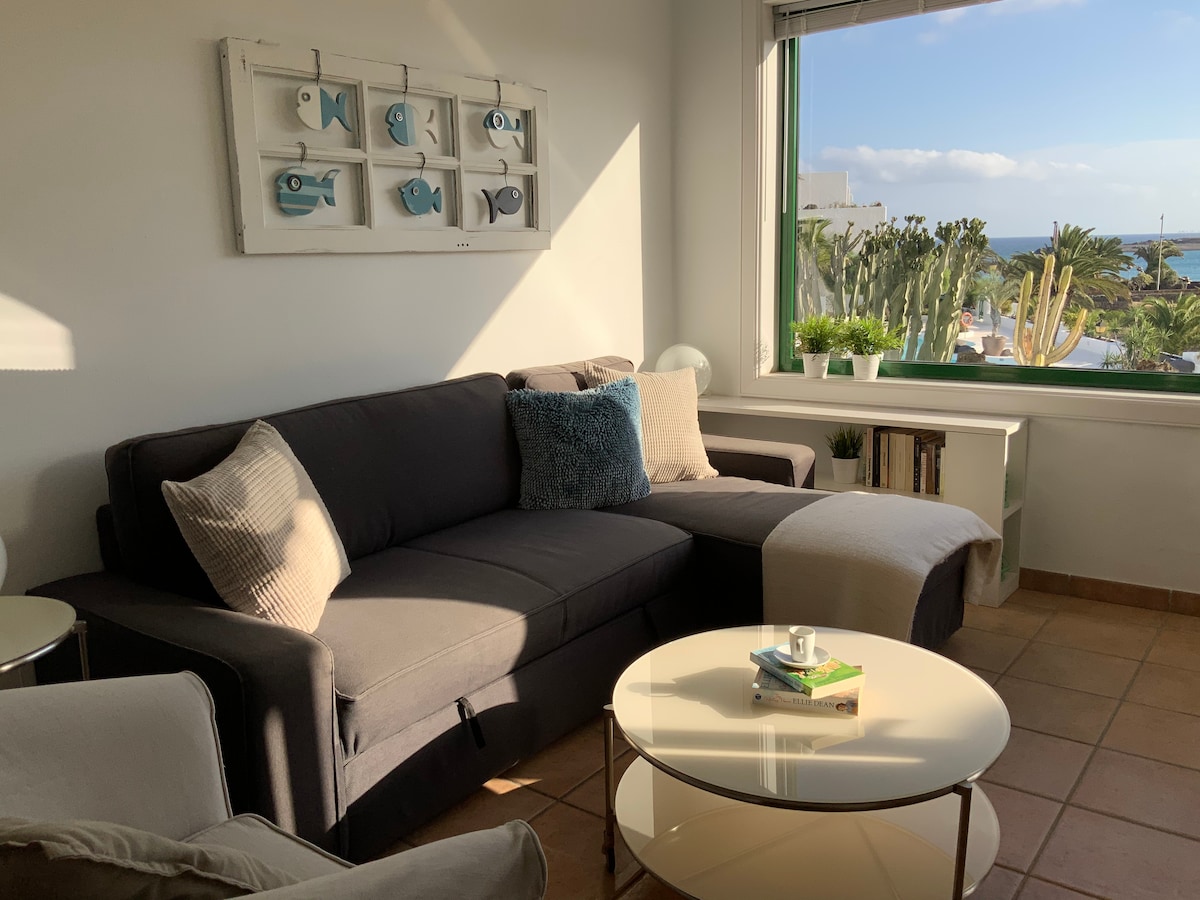
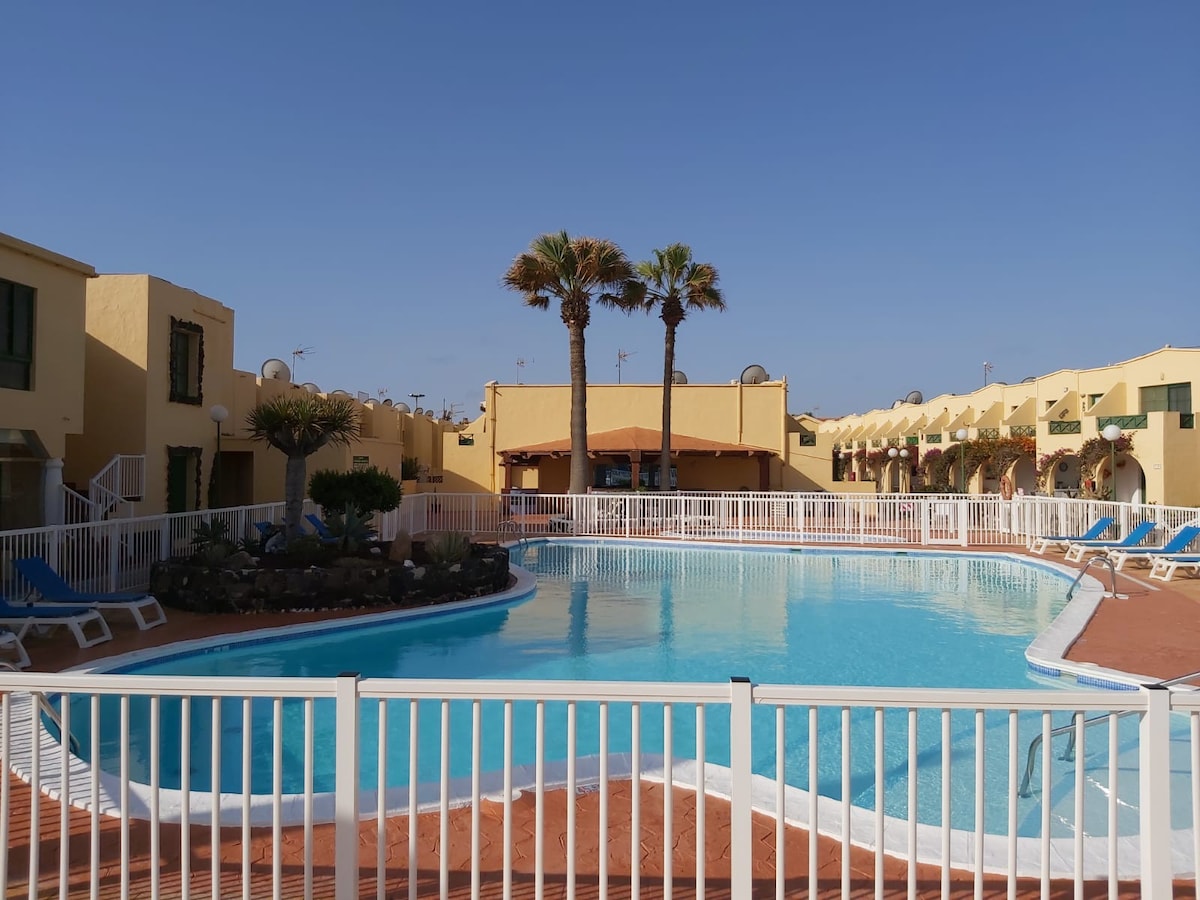
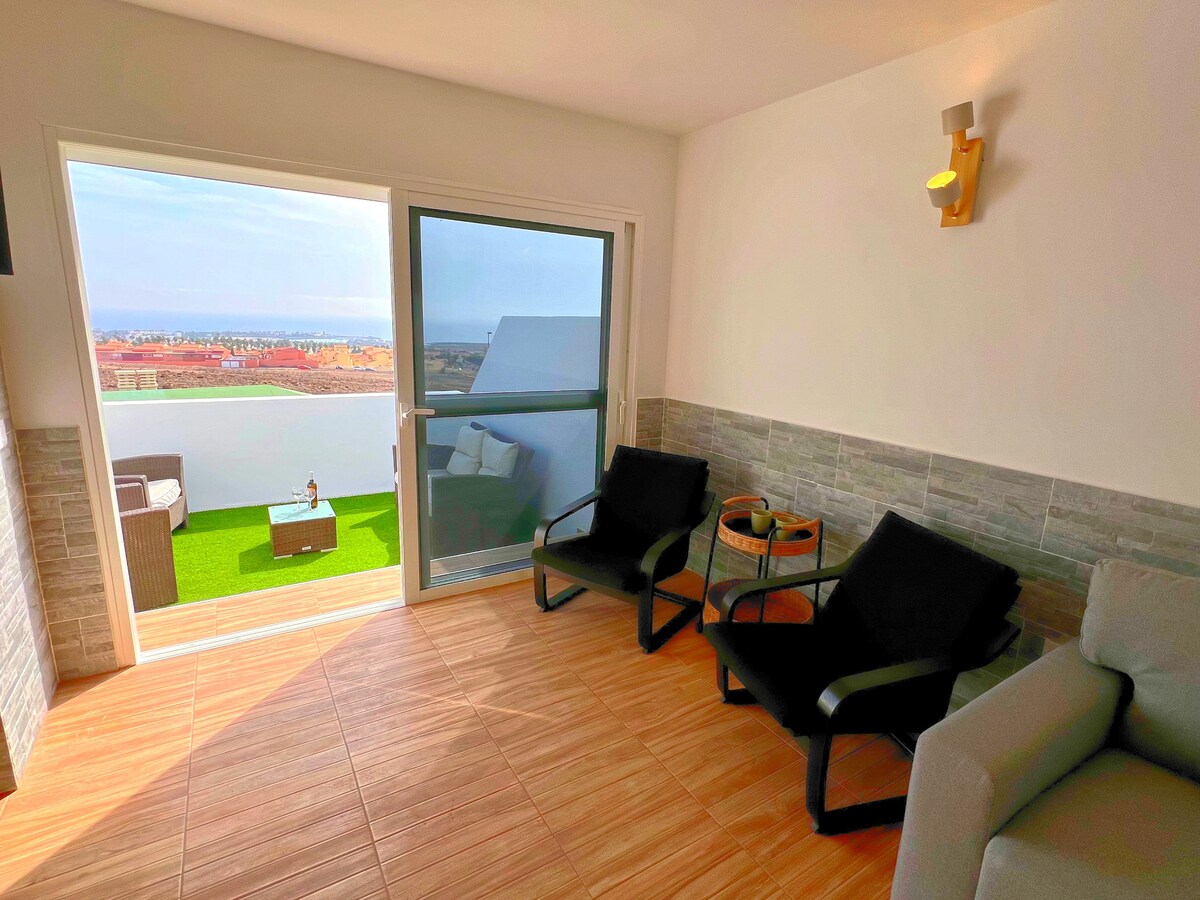
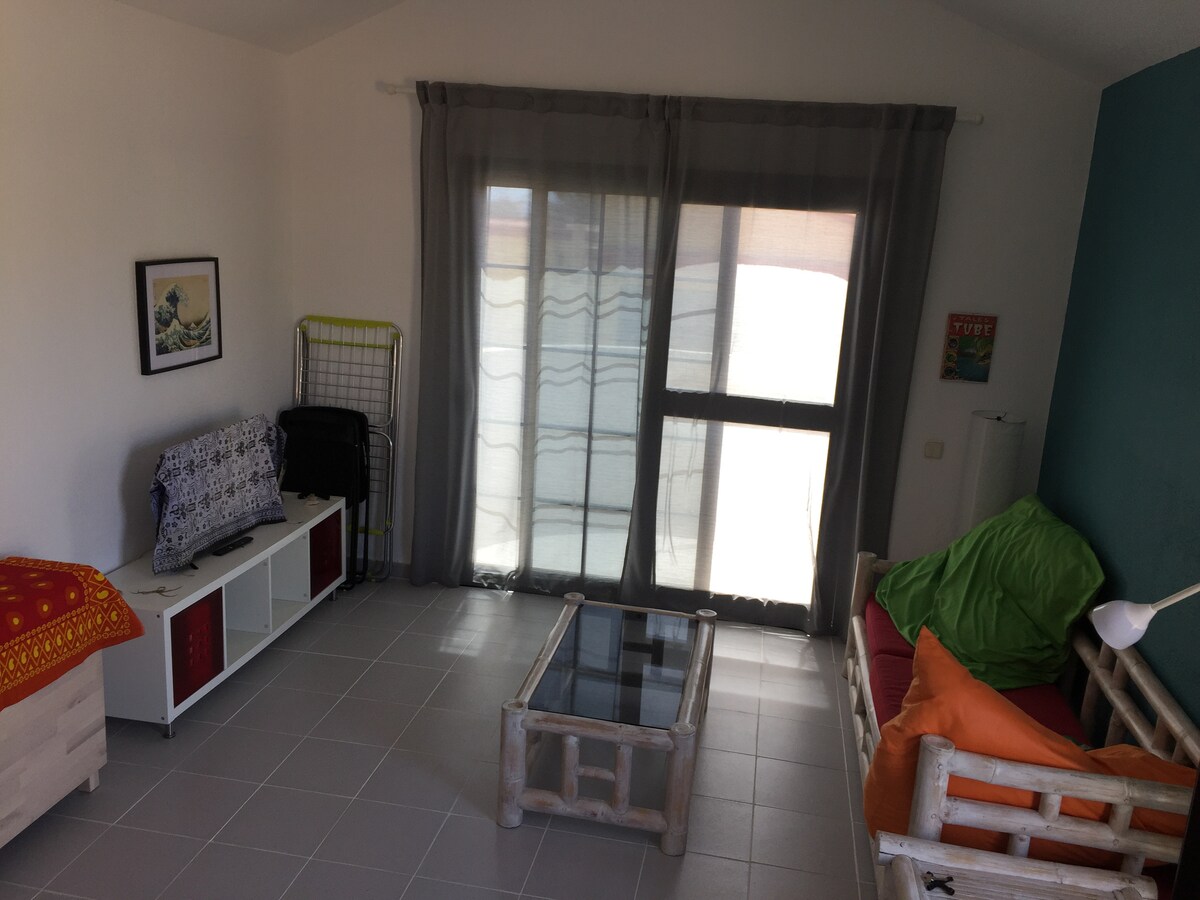
La Oliva, in northern Fuerteventura, is a paradise for surf enthusiasts and lovers of pristine landscapes, centered around the Corralejo dunes and Lobos Island. This market has seen exponential growth, driven by digital nomads and athletes drawn to its world-famous waves. The vacation rental market is highly active, with steady demand for modern apartments in Corralejo and rural retreats inland. With 3,030 active listings, La Oliva stands out as a vibrant, youthful destination with significant growth potential.
Featured Listings
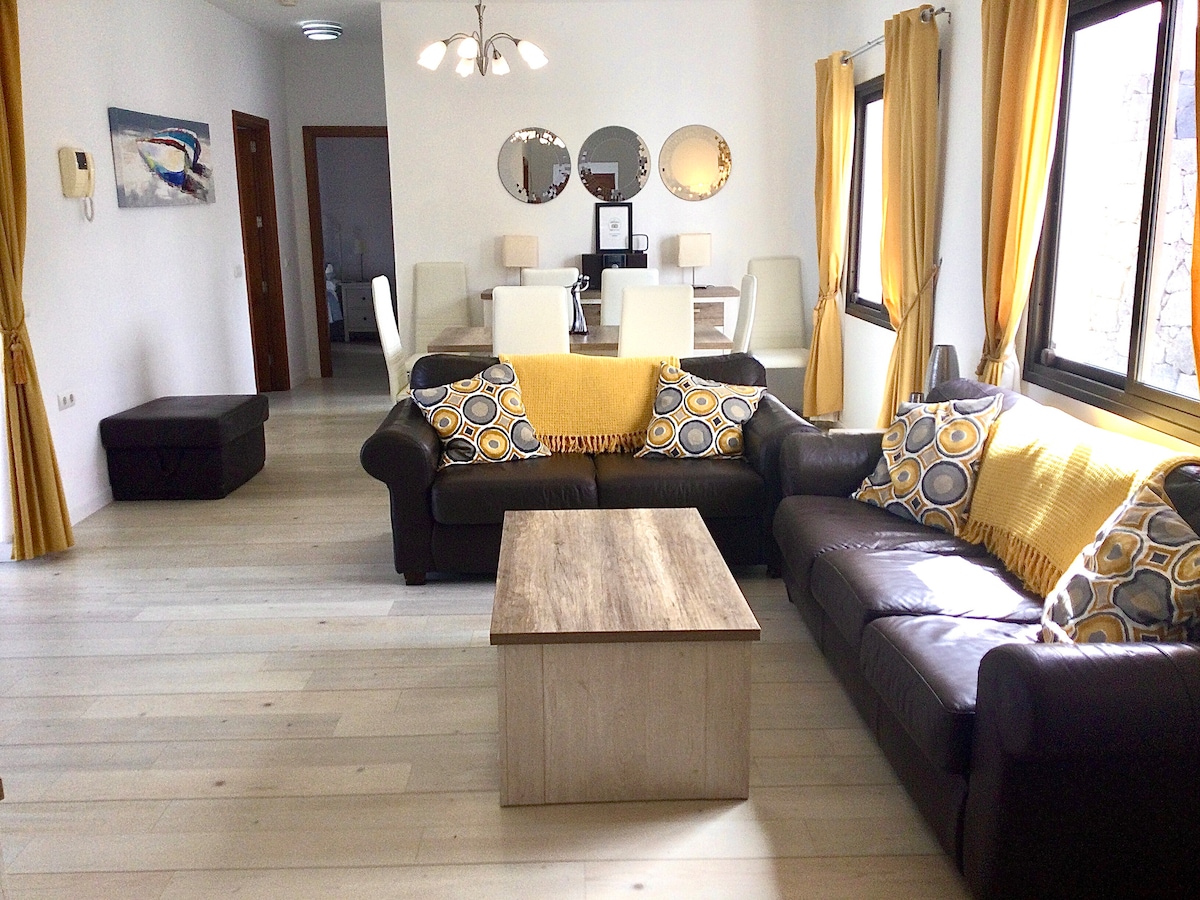
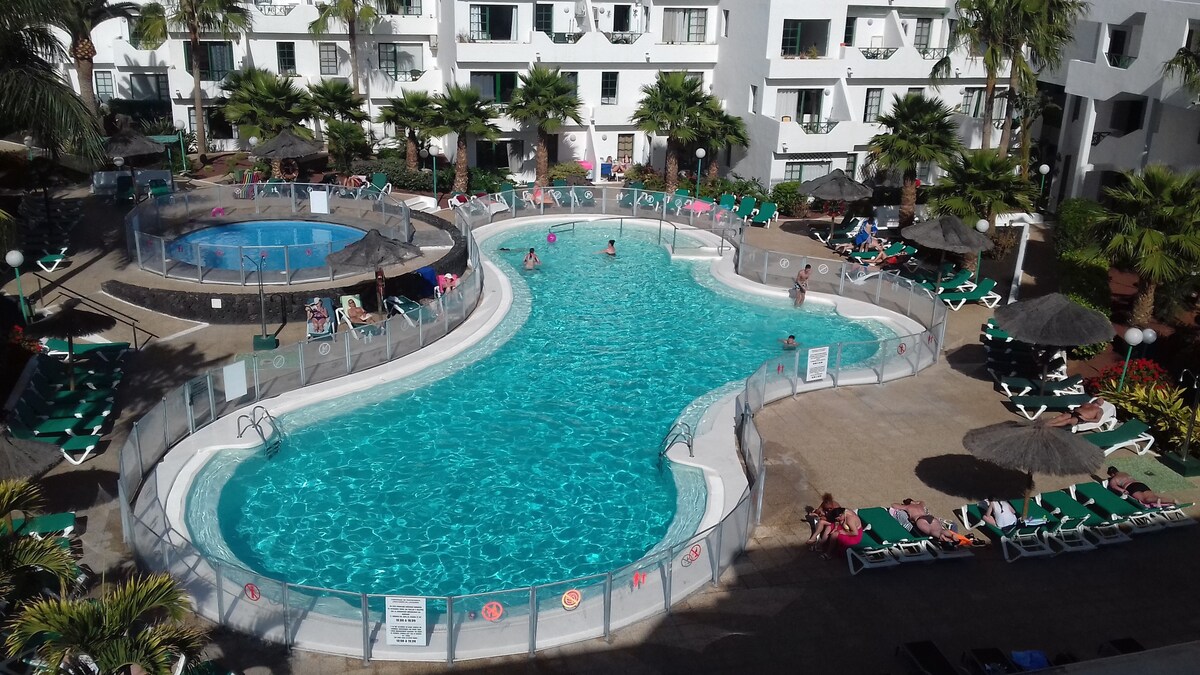
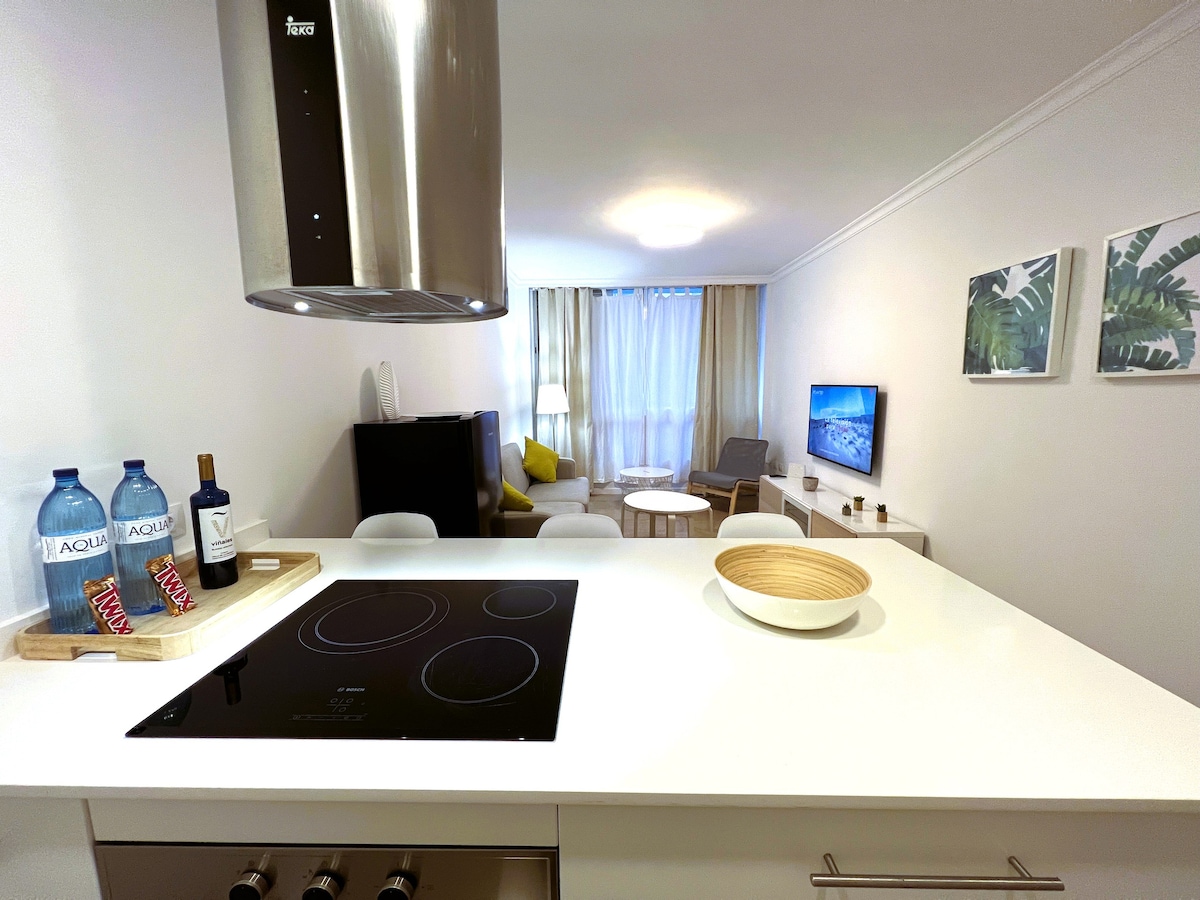
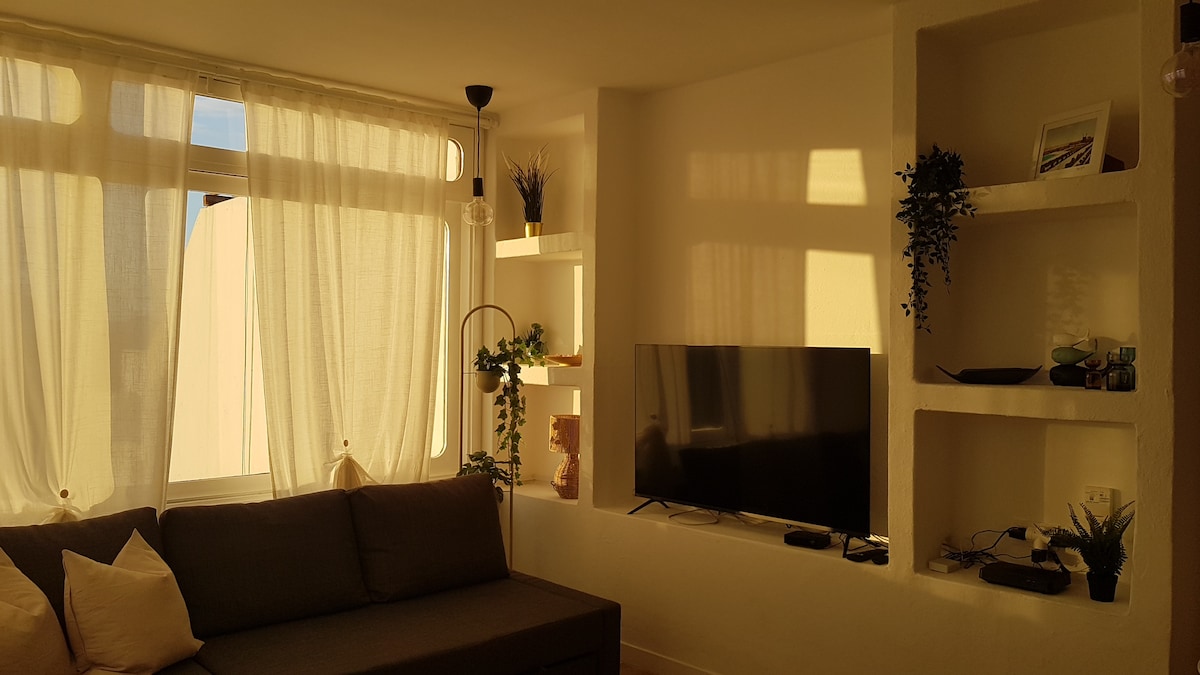
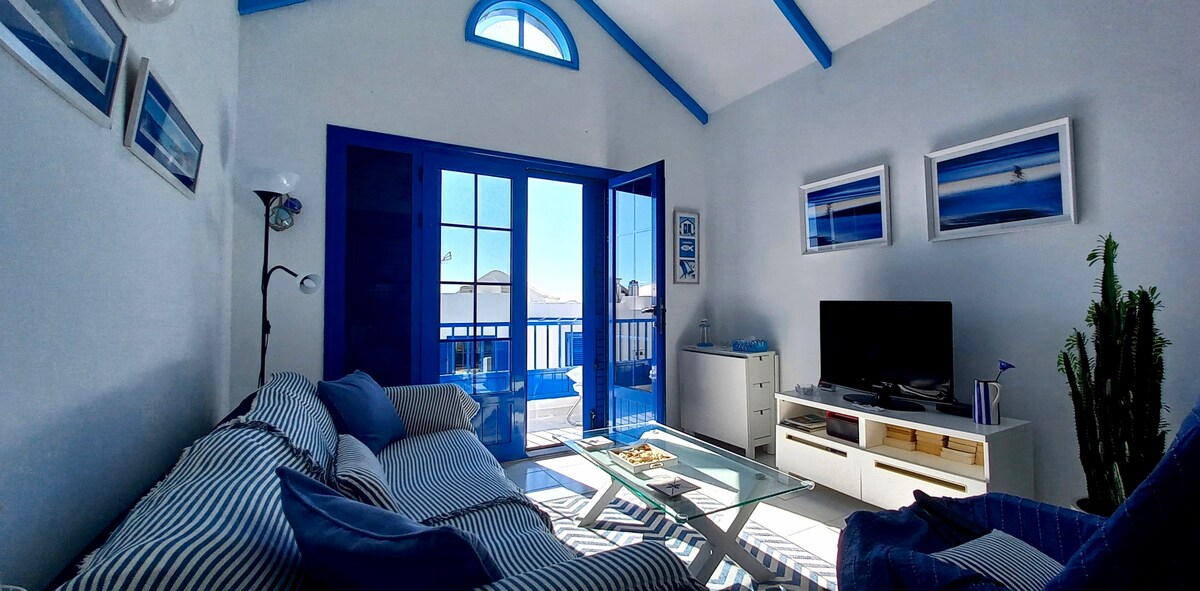
Tías is the municipality home to Puerto del Carmen, Lanzarote’s oldest and most established tourist area. Its proximity to the airport and miles of golden sandy beaches make it an extremely convenient and high-demand market. It primarily attracts loyal British and Irish travelers who return to the island year after year. With an enviable occupancy rate of 77%, Tías represents consistency and high performance for short-term rental investors.
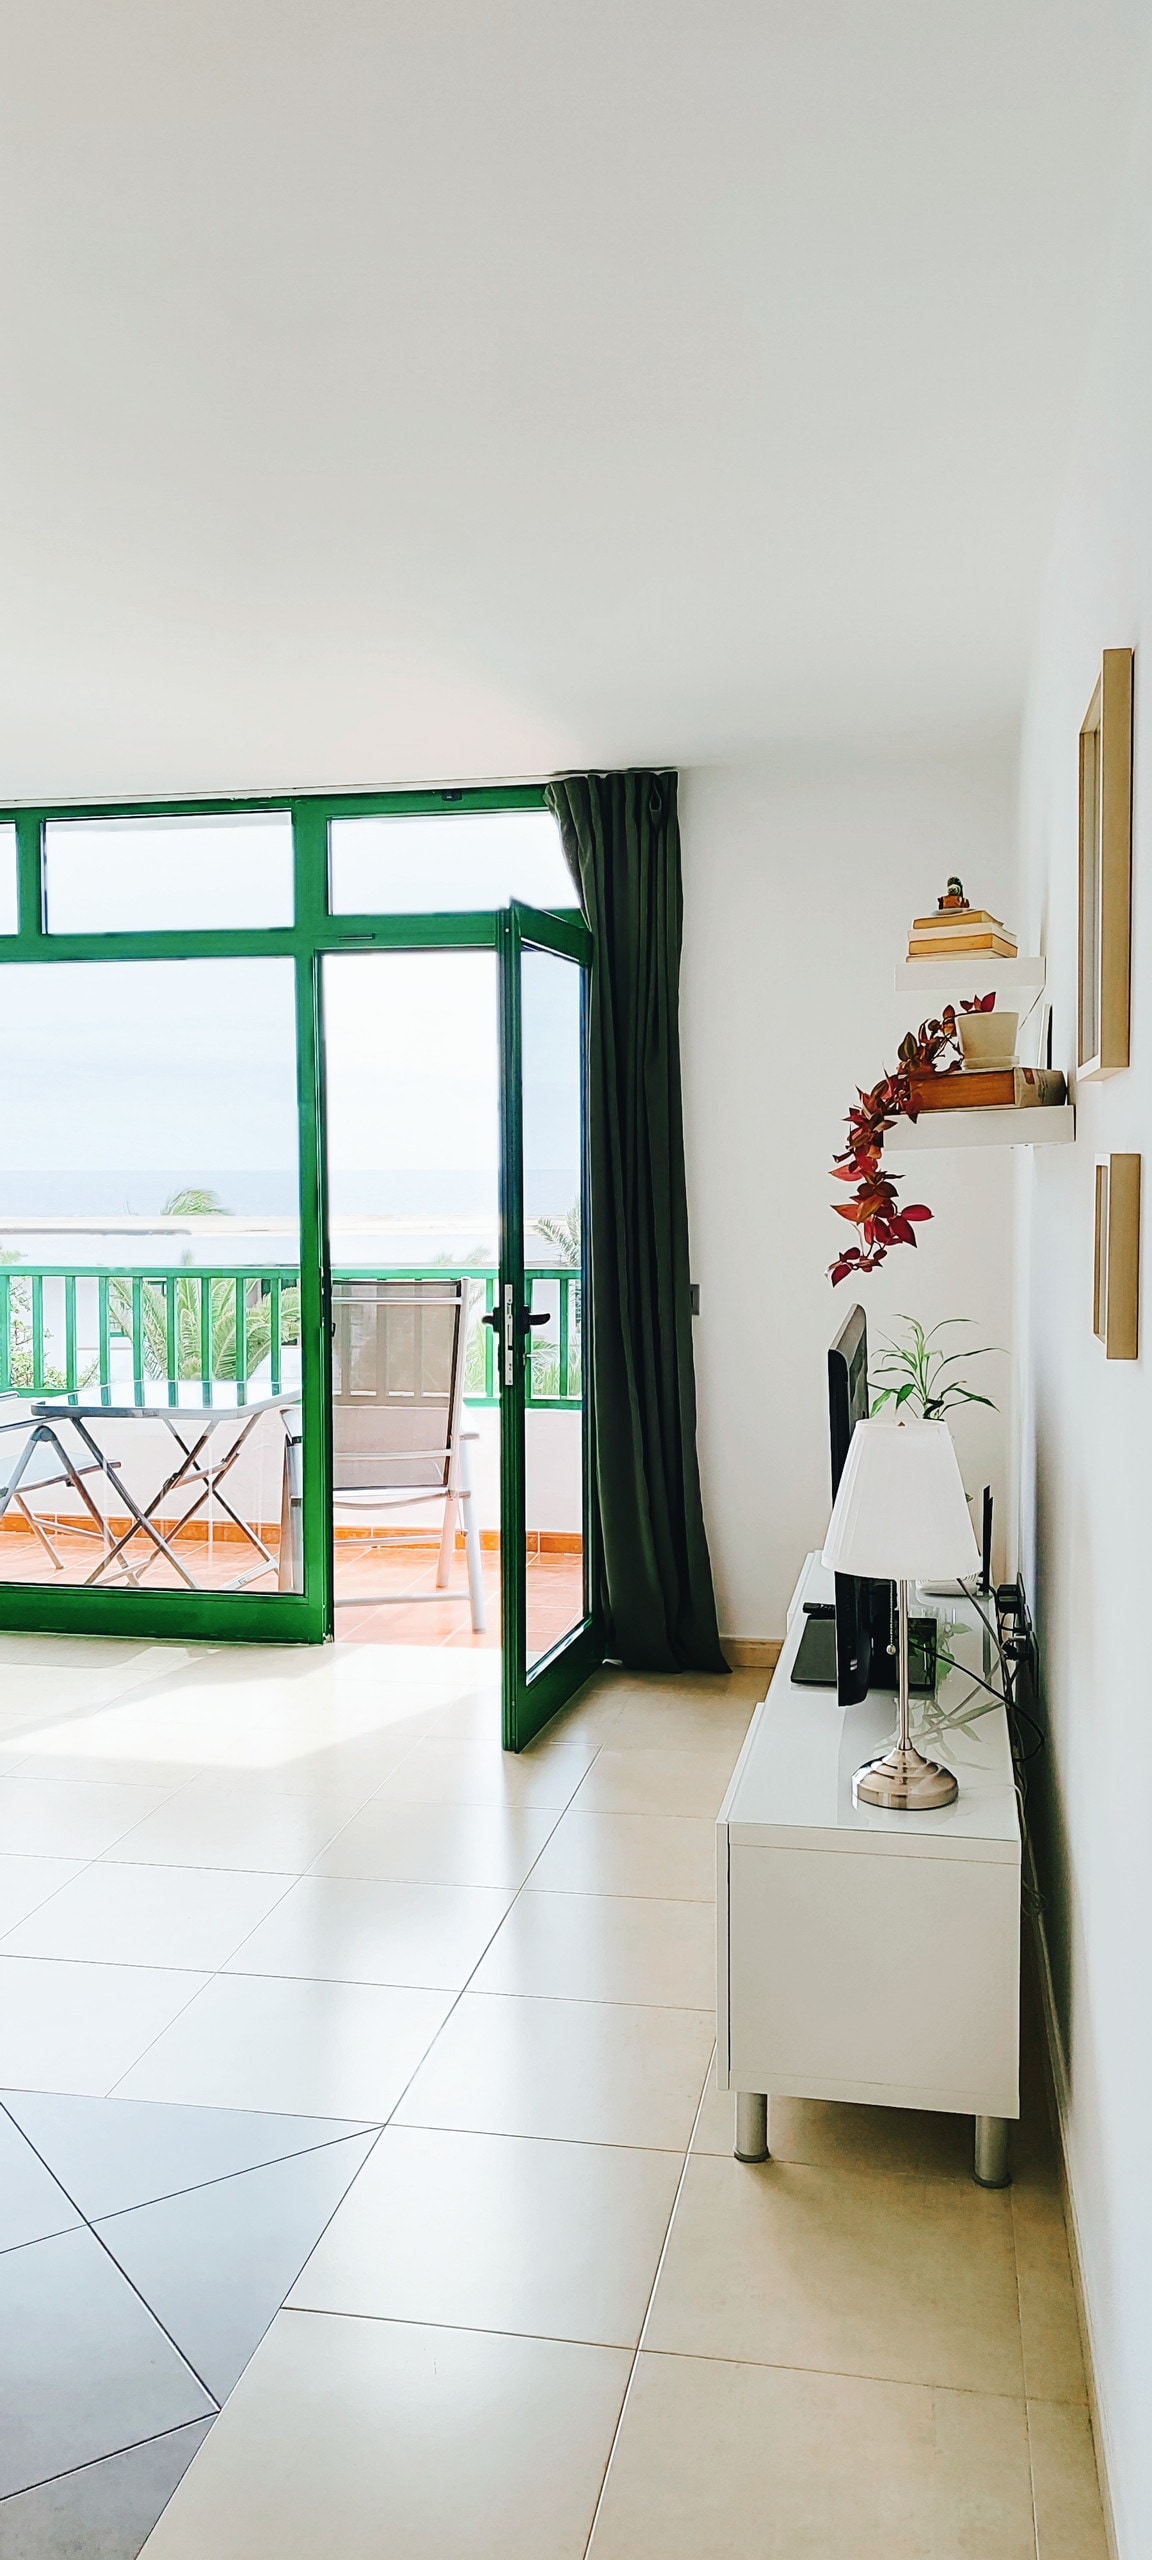

Mogán, often called the “Venice of the Canaries” for its picturesque harbor, enjoys one of the best microclimates in the world. It is a premier family destination, with areas like Puerto Rico and Playa de Amadores ensuring sunshine nearly every day of the year. The vacation rental market benefits from this climate stability, drawing Nordic and German tourists throughout the winter months. With an average daily rate of €135, Mogán offers a perfect balance of occupancy and competitive pricing in southern Gran Canaria.
Featured Listings
Las Palmas de Gran Canaria is a cosmopolitan city that blends vibrant urban life with the iconic Las Canteras Beach. This market attracts a diverse mix of digital nomads, surfers, and cultural tourists seeking authenticity beyond typical resorts. Events like the Las Palmas Carnival drive massive spikes in demand. With 2,159 listings, the city offers a wide variety of options, from modern beachside lofts to historic apartments in the charming Vegueta neighborhood.
Featured Listings
Teguise, the former capital of Lanzarote, is known for its historic elegance and the popular coastal resort of Costa Teguise. It is a well-balanced market that attracts athletes (windsurfing at Las Cucharas) and families seeking a quieter atmosphere than the south. The famous Sunday market in the Villa de Teguise is a major tourist draw. With an occupancy rate of 74%, the municipality offers solid profitability backed by high-quality accommodations and a beautifully preserved landscape.
Featured Listings
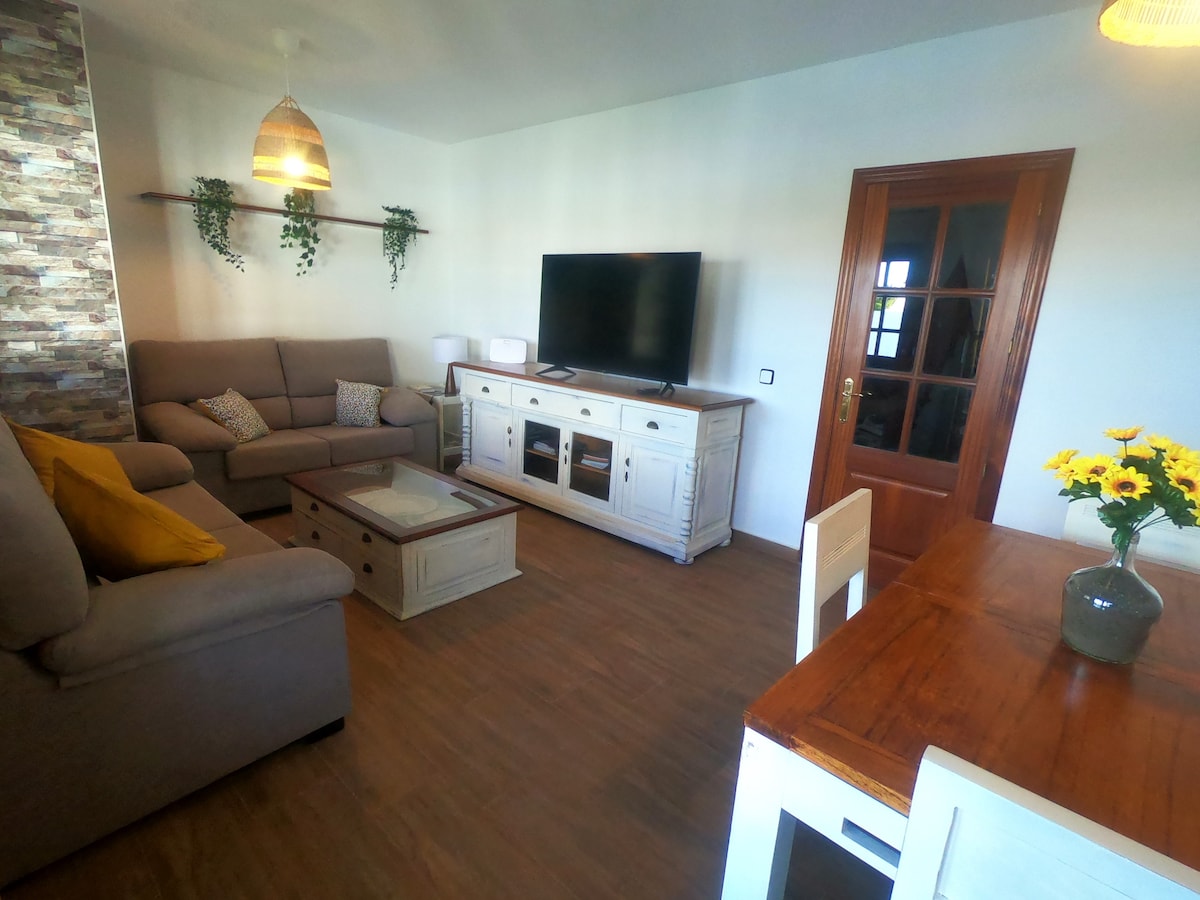
Antigua, in the heart of Fuerteventura, is famous for Caleta de Fuste, a safe, family-friendly destination with a calm beach protected by a bay. It is a highly attractive market for British tourists who value convenience, proximity to the airport, and local golf courses. The vacation rental market here enjoys an occupancy rate of 72%, with bungalows and apartments in complexes with pools being the top choices for families seeking sun and relaxation.
Featured Listings
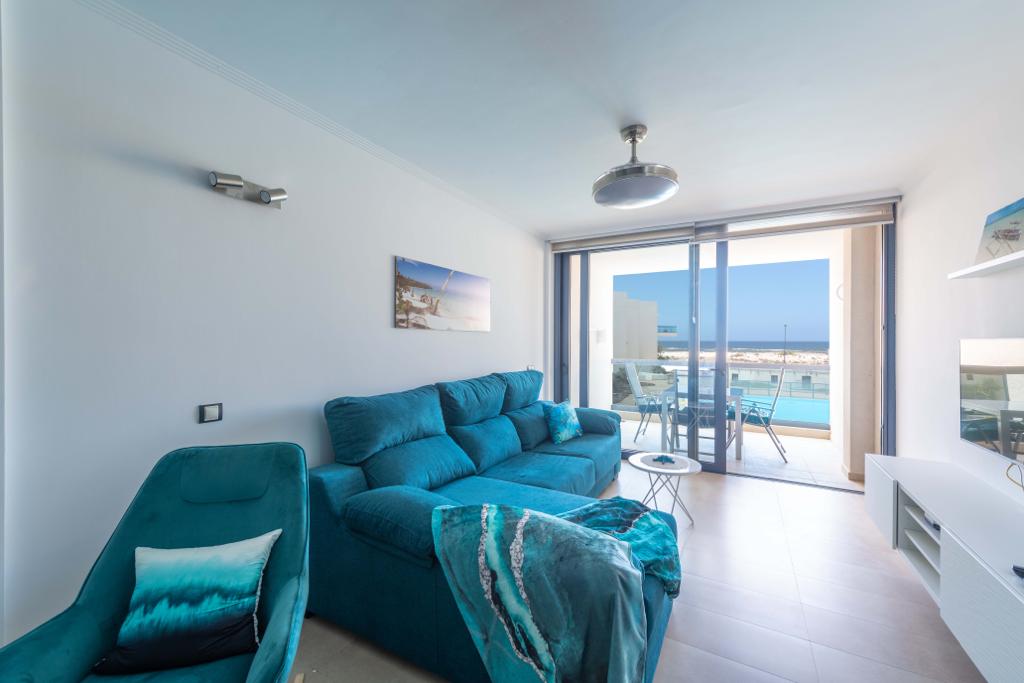
Pájara, in southern Fuerteventura, features the spectacular beaches of Costa Calma and Jandía, considered among the best in Europe. This market is dominated by German tourists seeking sunshine, endless sands, and water sports. The vacation rental sector in this area stands out for its high profitability and an occupancy rate of 71%. Properties with direct beach access or those in quiet areas are highly valued by a clientele looking for total disconnection in a paradisiacal natural setting.
Featured Listings
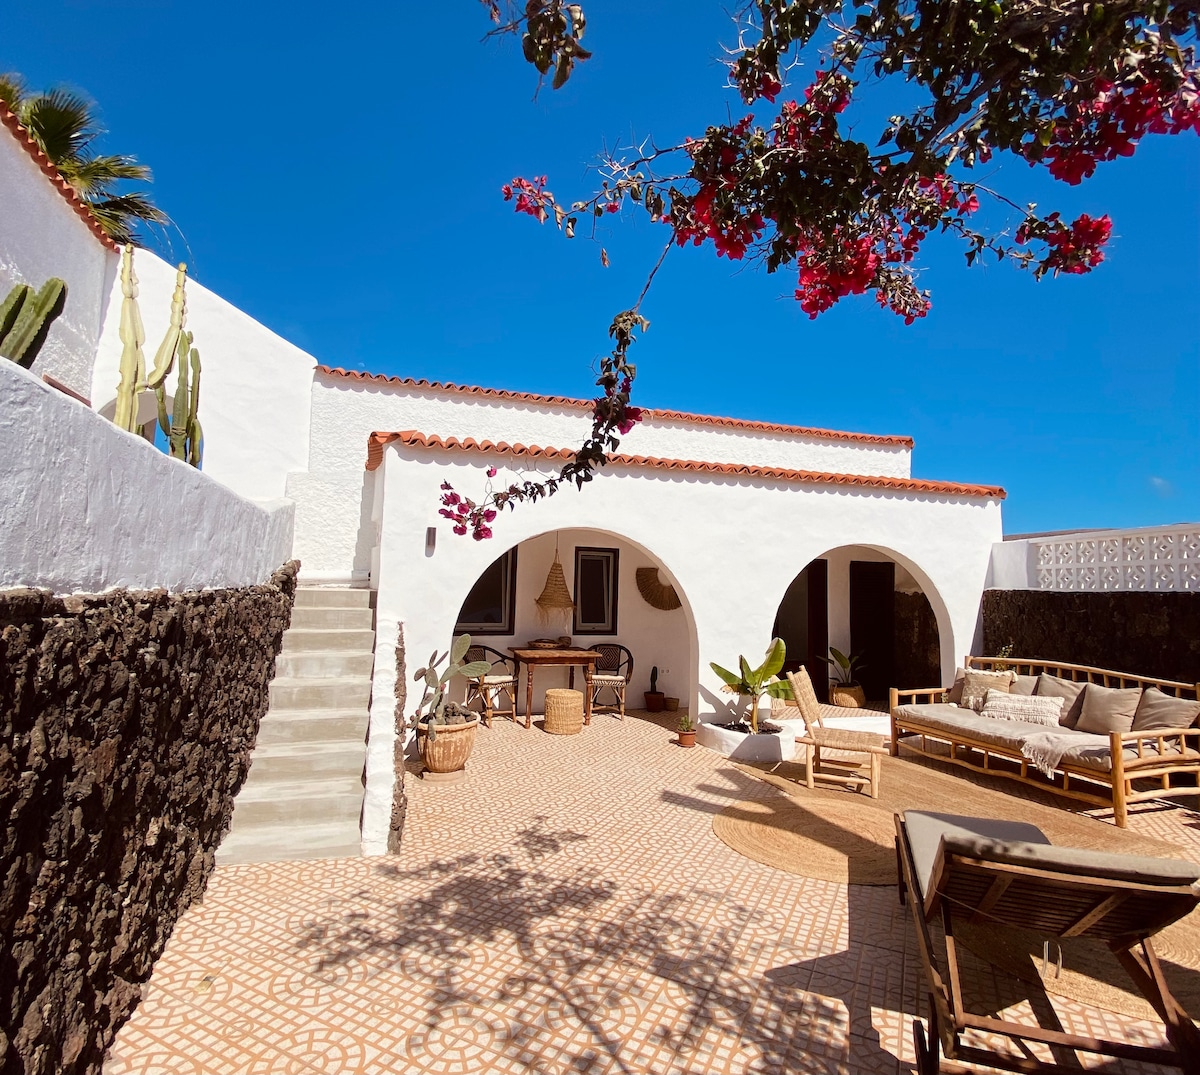
Haría, known as the ‘Valley of a Thousand Palms’, is a haven of peace and authenticity in northern Lanzarote, famous for its traditional white houses and lush vegetation. It is a market with massive appeal, attracting tourists seeking tranquility, local crafts, and unique volcanic landscapes near Jameos del Agua. Vacation rentals are extraordinarily profitable here, featuring a record occupancy rate of 70%. Visitors seek the charm of renovated rural houses and apartments with valley views, generating an annual revenue of €29,245. Its serene atmosphere and preserved natural beauty ensure high-level demand.
Featured Listings
Get Live Las Palmas, Canarias Market Intelligence
Discover detailed Las Palmas, Canarias Airbnb Analytics and explore real-time market data to make accurate investment decisions.
Explore Real-time Analytics
Explore Other Markets in Spain
Airbnb Occupancy Rates in Madrid, Comunidad De Madrid
Comunidad De Madrid, Spain
11,548 Active Listings
Airbnb Occupancy Rates in Valencia, Comunitat Valenciana
Valencia / Valencia, Spain
4,692 Active Listings