Airbnb Occupancy Rates in Nancy, Diocèse De Nancy Toul(June 2026)
Nancy is often dismissed as a “mini Strasbourg"—Lorraine heritage and a student-town feel—yet June 2026 data tells a different story: 1,054 active listings, €14,040 average annual revenue, 57% occupancy, and €67 ADR.
Between UNESCO-listed Place Stanislas, the École de Nancy Art Nouveau legacy, and a real employment base (university, regional hospital, métropole), demand blends short cultural stays, conferences, and nights tied to the academic calendar. For hosts, Nancy is won in the historic core and listing quality—not on a single summer peak like the coast.
Investing here means targeting a readable urban market, often with lower acquisition costs than Strasbourg or Lyon, while accepting a more modest ADR than the East’s largest metros.
Nancy Airbnb Market Map (June 2026)
Nancy Market Performance
Period: June 2025 - May 2026
Is Airbnb a Good Investment in Nancy?
YES — Nancy suits investors who want a heritage city centre, steady occupancy, and more accessible purchase prices than Strasbourg or Lyon, provided you accept a lower ADR than those larger neighbours.
Who it works for
- Buyers of a renovated 1–2 bedroom flat near Stanislas, the train station, or Charles III, targeting Paris weekenders and cultural short breaks.
- Hosts focused on mid-length stays (exchange students, hospital visitors, TGV Est business trips) with strong wifi, quiet rules, and flexible check-in.
- Grand Est portfolios diversifying beyond Strasbourg or Metz without matching their entry tickets.
Who should look elsewhere
- Maximum absolute revenue: Strasbourg and Lyon post materially higher average revenue on deeper listing pools.
- “Luxury second home” strategies with no registration or métropole tourist-tax workflow.
- Beach-style seasonality—Nancy is an urban, university-driven market, not a coastline resort.
| Market | Avg revenue | Occupancy | Active listings |
|---|---|---|---|
| Nancy | €14,040 | 57% | 1,054 |
| Strasbourg | €28,511 | 64% | 2,002 |
| Dijon | €15,662 | 58% | 1,688 |
| Metz | €17,360 | 61% | 655 |
| Reims | €17,383 | 55% | 1,754 |
Bottom line: Nancy balances heritage appeal, inventory scale, and harmonised métropole rules; Strasbourg and Lyon win on average basket size, while Metz and Reims are closer peers on listings and occupancy.
Get Live Nancy Market Intelligence
Discover detailed Nancy Airbnb Analytics and explore real-time market data to make accurate investment decisions.
Explore Real-time Analytics
How Often Will Your Airbnb Be Booked in Nancy?
View Demand Patterns →Occupancy rates directly impact your revenue potential. Understanding demand patterns helps you set realistic expectations and optimize your availability strategy.
The current average occupancy rate in Nancy is 57%, meaning properties are booked for about 210 nights per year. However, occupancy varies significantly based on property quality and management. Here's what you can expect:
Airbnb Occupancy Tiers in Nancy
Premium(Top 10%) | High-performing(Top 25%) | Average(Median) | Low-performing(Bottom 25%) |
|---|---|---|---|
| 89% | 74% | 52% | 20% |
*High desirability & optimized availability | *Good market fit & guest satisfaction | *Standard market performance | *Higher vacancy, optimization needed |
Seasonal Occupancy Patterns in Nancy
June, May
Highest demand and occupancy rates. Perfect for premium pricing strategies and maximizing revenue. Consider longer minimum stays and higher rates.
March, October
Moderate demand with balanced pricing opportunities. Good for attracting budget-conscious travelers while maintaining reasonable occupancy rates.
July, November
Lower demand requires competitive pricing and creative marketing. Focus on local events, extended stay discounts, and targeting specific traveler segments.
How Much Can You Earn with Airbnb in Nancy?
Calculate Earnings →One of the most common questions for potential Airbnb hosts in Nancy is about earning potential. Let's break down the revenue patterns and what you can realistically expect to earn.
Monthly Revenue Trends in Nancy
Best-in-class Airbnb properties (top 10%) in Nancy achieve around €20,735 annually, while strong performers (top 25%) earn at least €14,365. Typical properties generate about €8,926 per year, and entry-level listings (bottom 25%) see earnings near €2,782, often with room for optimization. Keep in mind, these are market averages—your actual earnings can be even higher depending on your property's location, bedrooms, guest capacity, and unique amenities.
Want to see how your listing could perform? Create a free account to unlock personalized analytics and explore exclusive insights in our app!
What Can You Learn from Top-Performing Airbnbs in Nancy?
View Top Performers →Studying successful properties provides valuable insights for your own Airbnb strategy. Here are the top-performing listings in Nancy and what makes them successful.
Nancy Market Analysis
Cultural visitors and Paris weekend escapes
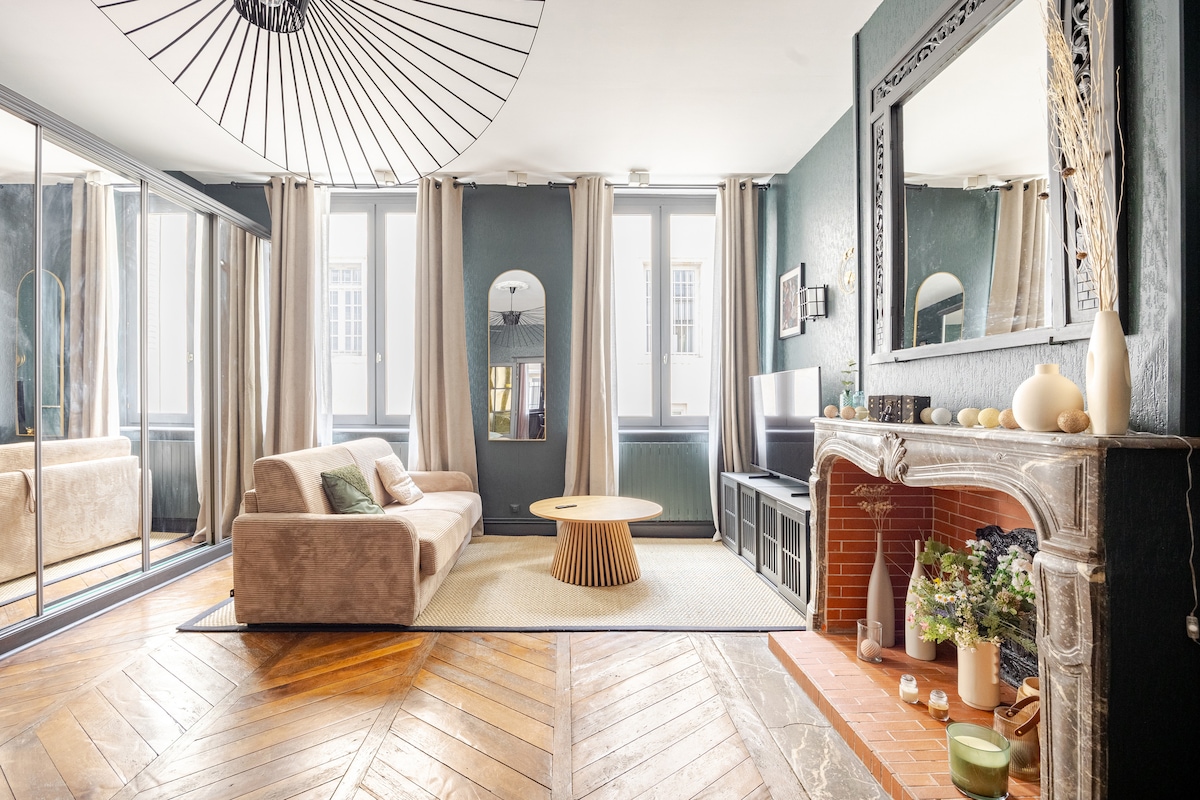
Place Stanislas, the Art Nouveau quarter, and museums drive 2–4 night stays, especially weekends outside Paris school holidays. Properties with character (parquet, stone, square views) support higher ADR; generic edge-of-centre studios underperform despite overall demand. TGV station proximity (Paris in ~90 minutes) belongs in the title and lead photos.
Students, hospital visitors, and business stays
Nancy clusters universities, grandes écoles, and the regional hospital: September intake, internships, local conferences, and temporary assignments fill weekdays and multi-week bookings. Reliable wifi, a desk, quality linens, and explicit quiet hours improve reviews in this segment. These peaks do not replace a Mediterranean summer, but they smooth occupancy outside classic holiday season.
Families and Lorraine explorers
Saint-Nicolas (early December) and regional Christmas markets lift winter demand without matching Strasbourg’s scale. Families want kitchens and two bedrooms to tour Lorraine (Metz, art towns, Luxembourg border). Plan minimum-night rules on holiday weekends and cleaning buffers between high-turnover short stays.
What Are the Airbnb Regulations in Nancy?
Understanding local regulations is crucial for operating a successful Airbnb. Let's examine the compliance landscape and what you need to know about licensing requirements in Nancy.
Current Regulatory Status
Only 9% of properties have proper licensing, indicating a relatively relaxed regulatory environment.
| Requirement | Where to act | Official link |
|---|---|---|
| Furnished tourist accommodation declaration (Cerfa 14004, receipt number) | Métropole du Grand Nancy portal | grandnancy.taxesejour.fr — declaration |
| Tourist tax (quarterly filing, 2025 rates) | Same portal + métropole publication | Tourist tax e-filing · 2025 rate sheet PDF |
| Change of use (if not primary residence) | Portal or town hall / planning | Nancy planning permits · Métropole planning desk |
| 120-day cap (primary residence) | National law — no dedicated Nancy municipal page | Service Public — renting your home |
| Heritage zone (works, façades) | Historic centre safeguard plan | Nancy PSMV |
On Métropole du Grand Nancy territory, hosts declare furnished lets online, display the registration number on platforms, and remit tourist tax through the métropole portal. For non-primary residences, a change-of-use request may be required—the portal supports filing or directs you to the mairie. France’s national 120 days per year cap for a primary residence still applies; confirm primary vs secondary status before your first paid booking.
For broader context on French STR rules, see our complete guide to Airbnb regulation in France (French).
How Competitive is the Airbnb Market in Nancy?
Analyze Competition →Understanding market competition is crucial for any potential Airbnb host. Let's examine the supply dynamics and what they mean for your investment strategy. The Nancy Airbnb market currently features 1,054 active listings with an average occupancy rate of 57%. This represents a highly competitive market environment where balanced supply and demand create opportunities for strategic positioning.
Airbnb Listings: Change Over Time
Strategic Entry into Nancy Airbnb Market
Competitive Positioning
- Focus on mid-market with competitive pricing
- Emphasize unique features and exceptional service
- Focus on value-for-money positioning
Market Opportunities
- Strong demand supports premium pricing strategies
- Stable market provides predictable investment returns
- Established market with proven demand patterns
What Should You Charge for Your Airbnb in Nancy?
Smart Pricing Tools →Pricing is one of the most critical decisions for Airbnb success. Let's analyze the current pricing landscape and help you understand what rates you can realistically charge.
The current average daily rate in Nancy is €67 per night. However, pricing varies significantly based on property quality and location. Here's what different property tiers typically charge:
Airbnb Pricing Tiers in Nancy
Premium(Top 10%) | High-performing(Top 25%) | Average(Median) | Budget(Bottom 25%) |
|---|---|---|---|
| €109per night | €76per night | €53per night | €39per night |
*Top locations, big properties, premium amenities | *Good property management, highly rated | *Standard market performance | *Basic properties, less desirable locations |
Is It Profitable to Start an Airbnb in Nancy?
Investment Analysis →Understanding the profitability potential is crucial for any Airbnb investment decision. Let's analyze the revenue performance and profit margins in the Nancy market to help you make informed financial decisions.
Revenue Performance
Profitability Factors
Explore Other Markets in France
Airbnb Occupancy Rates in Cannes, Provence Alpes Cote D'azur
Alpes Maritimes, France
10,662 Active Listings
Airbnb Occupancy Rates in Nice, Provence Alpes Cote D'azur
Alpes Maritimes, France
8,797 Active Listings
Airbnb Occupancy Rates in Marseille, Provence Alpes Cote D'azur
Bouches Du Rhone, France
7,232 Active Listings
Airbnb Occupancy Rates in Antibes, Provence Alpes Cote D'azur
Alpes Maritimes, France
4,350 Active Listings
Airbnb Occupancy Rates in Saint Raphael, Provence Alpes Cote D'azur
Var, France
3,119 Active Listings
Airbnb Occupancy Rates in Annecy, Auvergne Rhone Alpes
Diocese D'annecy, France
2,752 Active Listings
Airbnb Occupancy Rates in Chamonix Mont Blanc, Auvergne Rhone Alpes
Diocese D'annecy, France
2,619 Active Listings