Airbnb Occupancy Rates in São Paulo, Brazil(July 2026)
- Average annual revenue: R$57,076
- Occupancy rate: 58%
- Average daily rate (ADR): R$269
- Active listings: 34,110 (July 2026)
São Paulo concentrates trade fairs, corporate headquarters, benchmark dining, and a metro network that sustains weekday corporate travel and weekend city breaks alike. Business travelers, event crews, and guests using the capital as a base for the Paulista coast fill calendars across the year.
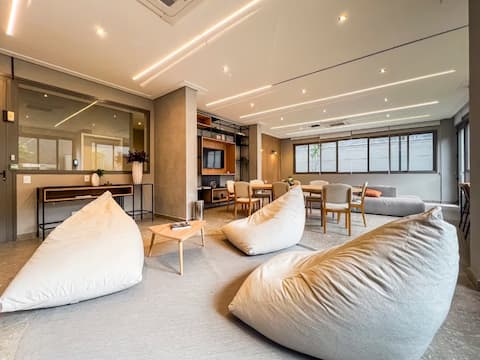
With 34,110 active listings and average occupancy of 58%, the market rewards hosts in neighborhoods with mixed demand—corporate and leisure—and apartments ready for short stays: digital check-in, stable Wi‑Fi, and clear condo rules stated upfront in the listing.
São Paulo Airbnb Market Map (July 2026)
São Paulo Market Performance
Period: January 2026 - June 2026
Is Airbnb a Good Investment in São Paulo?
YES — São Paulo is one of Brazil’s most liquid short-term rental markets for operators who plan for high competition, premium-district acquisition costs, and rigorous condominium compliance.
Who tends to invest well
- Operators with compact, high-end apartments in the West Zone or expanded downtown
- Hosts serving fair and congress demand (Expo Center Norte, Anhembi district) and executive traffic in Itaim or Pinheiros
- Investors comparing yield in residential districts (Moema, Vila Mariana) with corporate pockets (Itaim, Jardim Paulista)
Stronger fit elsewhere
- Beach-resort yield theses often align with Rio de Janeiro or the Paulista coast
- Summer-heavy calendar strategies map well to Florianópolis
- Smaller, steadier urban markets include Curitiba and Belo Horizonte
| Market | Avg revenue | Occupancy | Listing scale |
|---|---|---|---|
| São Paulo | R$57,076 | 58% | 34,110 |
| Rio de Janeiro | R$120,714 | 61% | 32,783 |
| Florianópolis | R$98,862 | 51% | 21,291 |
| Curitiba | R$41,743 | 57% | 5,533 |
| Belo Horizonte | R$59,427 | 59% | 3,108 |
Rio leads on beachfront nightly rates; São Paulo leads on corporate volume and steadier month-to-month occupancy. Curitiba and Belo Horizonte offer smaller inventory at moderate ADR; Florianópolis peaks in southern summer. Match the city to the calendar shape you want to operate.
Get Live São Paulo Market Intelligence
Discover detailed São Paulo Airbnb Analytics and explore real-time market data to make accurate investment decisions.
Explore Real-time Analytics
How Often Will Your Airbnb Be Booked in São Paulo?
View Demand Patterns →Occupancy rates directly impact your revenue potential. Understanding demand patterns helps you set realistic expectations and optimize your availability strategy.
The current average occupancy rate in São Paulo is 58%, meaning properties are booked for about 212 nights per year. However, occupancy varies significantly based on property quality and management. Here's what you can expect:
Airbnb Occupancy Tiers in São Paulo
Premium(Top 10%) | High-performing(Top 25%) | Average(Median) | Low-performing(Bottom 25%) |
|---|---|---|---|
| 87% | 73% | 52% | 20% |
*High desirability & optimized availability | *Good market fit & guest satisfaction | *Standard market performance | *Higher vacancy, optimization needed |
Seasonal Occupancy Patterns in São Paulo
April, March
Highest demand and occupancy rates. Perfect for premium pricing strategies and maximizing revenue. Consider longer minimum stays and higher rates.
September, August
Moderate demand with balanced pricing opportunities. Good for attracting budget-conscious travelers while maintaining reasonable occupancy rates.
November, October
Lower demand requires competitive pricing and creative marketing. Focus on local events, extended stay discounts, and targeting specific traveler segments.
How Much Can You Earn with Airbnb in São Paulo?
Calculate Earnings →One of the most common questions for potential Airbnb hosts in São Paulo is about earning potential. Let's break down the revenue patterns and what you can realistically expect to earn.
Monthly Revenue Trends in São Paulo
Best-in-class Airbnb properties (top 10%) in São Paulo achieve around R$83,262 annually, while strong performers (top 25%) earn at least R$56,860. Typical properties generate about R$35,118 per year, and entry-level listings (bottom 25%) see earnings near R$11,298, often with room for optimization. Keep in mind, these are market averages—your actual earnings can be even higher depending on your property's location, bedrooms, guest capacity, and unique amenities.
Want to see how your listing could perform? Create a free account to unlock personalized analytics and explore exclusive insights in our app!
What Can You Learn from Top-Performing Airbnbs in São Paulo?
View Top Performers →Studying successful properties provides valuable insights for your own Airbnb strategy. Here are the top-performing listings in São Paulo and what makes them successful.

São Paulo Market Analysis
Trade fairs, MICE, and corporate demand
The capital hosts dozens of national and international events throughout the year. When a major fair fills Anhembi or the north zone, neighborhoods like Santana, Tatuapé, and Bela Vista absorb setup crews; Itaim, Pinheiros, and Jardim Paulista capture executives at higher nightly rates. Listings with a desk, dedicated outlet, and flexible check-in convert strongly with fair and congress guests.
Calendar: when bookings fill
Carnival, extended June/July holidays, and December bring leisure travelers. Business travel fills the weeks between those peaks, keeping occupancy steady in corporate districts. Adjust minimum stay and weekday pricing: Tuesdays and Wednesdays often sit at a discount to Thursdays and Sundays in Itaim, Pinheiros, and the Paulista corridor.
Property types that convert
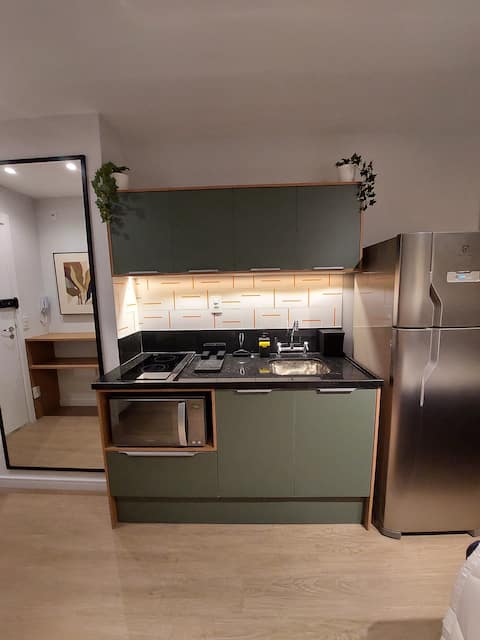
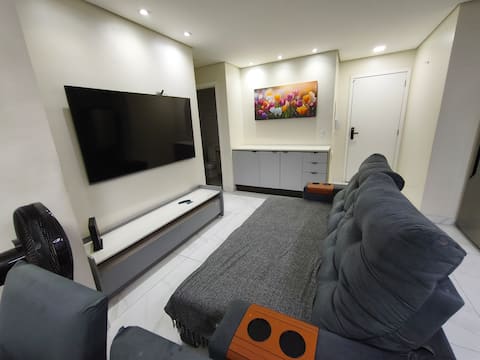
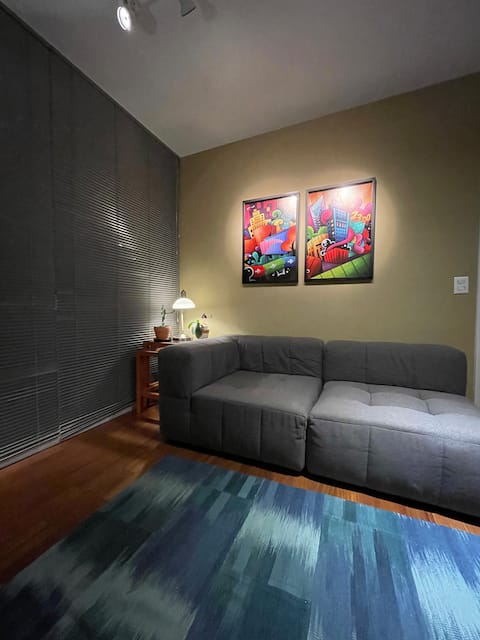
Studios and one-bedrooms with parking (when available) suit singles and couples. Two-bedrooms with two double beds attract families and fair groups. When the condo allows visitor parking, state access clearly in the listing; when it does not, set expectations before booking to protect reviews in older downtown buildings.
What Are the Airbnb Regulations in São Paulo?
Understanding local regulations is crucial for operating a successful Airbnb. Let's examine the compliance landscape and what you need to know about licensing requirements in São Paulo.
Current Regulatory Status
No properties have proper licensing in this market, indicating minimal regulatory enforcement.
Before you list
Confirm in the condo bylaws whether short-term rentals are allowed—the Superior Court recognizes exclusively residential-use clauses when properly drafted. Check whether the unit is in a social-housing program (HIS/HMP), where short-term use may be prohibited in São Paulo. Separate CPF/CNPJ: occasional rentals follow different rules from professional operations under Simples Nacional.
First booking
The Tenancy Law (Lei 8.245/1991) treats stays up to 90 days under a special regime; contracts must be clear on duration and responsibilities. Collect municipal ISS when applicable to your tax classification—consult the City of São Paulo for CNAE and current rates. Bill 194/2026 proposes the eVisitanteSP registry for hosts and units—follow proceedings at the São Paulo City Council.
Ongoing operation
Keep guest records per condo and police requirements when requested. Declare income via carnê-leão or CNPJ depending on unit count. Platforms may request additional data under federal tourism rules—see the Ministry of Tourism for national guidance.
What Should You Charge for Your Airbnb in São Paulo?
Smart Pricing Tools →Pricing is one of the most critical decisions for Airbnb success. Let's analyze the current pricing landscape and help you understand what rates you can realistically charge.
The current average daily rate in São Paulo is R$269 per night. However, pricing varies significantly based on property quality and location. Here's what different property tiers typically charge:
Airbnb Pricing Tiers in São Paulo
Premium(Top 10%) | High-performing(Top 25%) | Average(Median) | Budget(Bottom 25%) |
|---|---|---|---|
| R$400per night | R$278per night | R$207per night | R$128per night |
*Top locations, big properties, premium amenities | *Good property management, highly rated | *Standard market performance | *Basic properties, less desirable locations |
Is It Profitable to Start an Airbnb in São Paulo?
Investment Analysis →Understanding the profitability potential is crucial for any Airbnb investment decision. Let's analyze the revenue performance and profit margins in the São Paulo market to help you make informed financial decisions.
Revenue Performance
Profitability Factors
Which Areas in São Paulo Are Most Profitable for Airbnb?
Explore All Areas →Top-performing neighborhoods
- Itaim Bibi — R$75,960 average revenue, 57% occupancy, 3,744 listings: corporate epicenter with premium nightly rates.
- Pinheiros — R$67,871, 61%; dining, offices, and nightlife combined.
- Jardim Paulista — R$71,404, 61%; Jardins and proximity to Avenida Paulista support high ADR.
- Moema — R$57,482, 59%; residential profile for families and executives.
- Perdizes — R$49,129, 52%; universities and hospitals drive longer stays.
Corporate corridors and fairs
Itaim, Pinheiros, and Brooklin (via Itaim Bibi and Moema) concentrate demand from consultancies, banks, and tech. Corporate guests book faster when listings show accurate metro walking times and drive times to major event venues. República and Bela Vista attract value-conscious travelers with high turnover; clear check-in hours and lobby instructions help reviews stay strong.
Residential zones for families
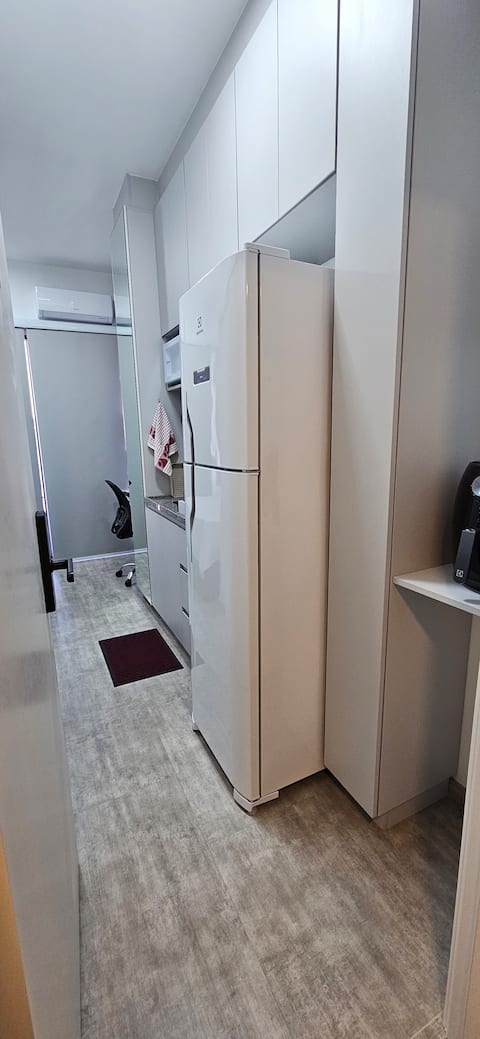
Moema, Vila Mariana, and Perdizes attract families visiting parks, malls, and hospitals. Two-bedroom units with AC in every room and an equipped kitchen convert well. Condos in this tier often require guest registration at the front desk—state that process before confirmation.
Airbnb Markets Near São Paulo
Greater São Paulo spans dozens of municipalities with demand profiles that differ from the capital: international airport traffic, tech hubs, weekend beach escapes, and university cities in the interior. Hosts who compare calendars across the metro often find different yield at lower acquisition cost — especially when the thesis targets corporate stays, beach getaways, or regional events.
| City | Avg revenue | Occupancy | Listings | Demand profile |
|---|---|---|---|---|
| Campinas | R$57,442 | 56% | 1,520 | Tech, Unicamp, regional trade fairs |
| Guarulhos | R$43,678 | 57% | 1,065 | GRU airport, corporate overflow from the capital |
| Santos | R$57,700 | 49% | 2,711 | Port, beach, São Paulo weekend escapes |
| São José dos Campos | R$70,038 | 52% | 1,015 | Embraer, aerospace, Paraíba Valley |
| Ribeirão Preto | R$57,069 | 49% | 2,515 | Agribusiness, USP campus, interior SP |
ABC corridor and airport gateway
Guarulhos captures guests transiting through Guarulhos International Airport (GRU) and teams who prefer sleeping near the terminal instead of crossing São Paulo at peak hours. Apartments with flexible check-in, stable Wi‑Fi, and clear transfer instructions convert well. The city also absorbs fair and congress overflow when north-zone São Paulo hotels fill up.
Coast and Paraíba Valley
Santos combines urban beachfront, port activity, and weekend escapes for travelers leaving São Paulo via the Anchieta or Imigrantes highways. São José dos Campos anchors aviation, defense industry, and corporate travel in the Paraíba Valley — steadier weekday calendars than pure beach destinations.
Interior and regional hubs
Campinas works as the interior paulista hub: universities, tech parks, and regional fairs fill compact apartments on weekdays. Ribeirão Preto draws agribusiness executives, medical congresses, and business tourism — moderate ADR with smaller inventory than the capital, which helps new hosts find positioning room in the market.
Explore Other Markets in Brazil
Airbnb Occupancy Rates in Rio De Janeiro, Rio De Janeiro
Rio De Janeiro, Brazil
32,783 Active Listings
Airbnb Occupancy Rates in Cabo Frio, Rio De Janeiro
Macae Rio Das Ostras Cabo Frio, Brazil
9,580 Active Listings