Airbnb Occupancy Rates in Cagliari, Sardegna(September 2026)
€29,423 average annual revenue, 66% occupancy, €123 per night, and 1,725 active listings as of September 2026 describe Sardinia’s capital: a city break market anchored on Castello, Poetto beach runs, and Elmas (CAG) flights—not only Costa Smeralda spillover like Olbia.
Cagliari blends business and university traffic, winter sun seekers, and island road-trippers who use the city as a southern hub before heading to Villasimius, Pula, or the west coast—underwriting one island average without micro-market splits often misstates Poetto premiums versus centro walk-ups.
Cagliari Airbnb Market Map (September 2026)
Cagliari Market Performance
Period: September 2025 - August 2026
Is Airbnb a Good Investment in Cagliari?
YES — Cagliari fits operators who want an urban Sardinian base with airport liquidity and year-round city demand, if you complete Comune filing, regional **IUN, national CIN, and SECAL tourist-tax reporting before scaling.**
| City | Avg revenue | Occupancy | Role in Sardinia |
|---|---|---|---|
| Cagliari | €29,423 | 66% | Island capital; CAG + Poetto + Castello |
| Olbia | €48,643 | 64% | Costa Smeralda gateway; resort ADR leader |
| Alghero | €38,759 | 65% | Catalan coast; AHO + bastioni |
| Sassari | €22,962 | 60% | Inland university hub; thin STR scale |
| Palermo | €24,034 | 64% | Sicily capital; deeper Tyrrhenian pool |
Olbia (€48,643, 64%) often leads headline ADR on resort positioning; Cagliari competes on capital-city logistics, Poetto summers, and CAG connectivity with 1,725 listings—far deeper than Sassari (402). Alghero (€38,759, 65%) wins west-coast character premiums; compliance is the same Sardegna IUN + CIN stack for all three—not a lighter rulebook on the south coast.
Get Live Cagliari Market Intelligence
Discover detailed Cagliari Airbnb Analytics and explore real-time market data to make accurate investment decisions.
Explore Real-time Analytics
How Often Will Your Airbnb Be Booked in Cagliari?
View Demand Patterns →Occupancy rates directly impact your revenue potential. Understanding demand patterns helps you set realistic expectations and optimize your availability strategy.
The current average occupancy rate in Cagliari is 66%, meaning properties are booked for about 239 nights per year. However, occupancy varies significantly based on property quality and management. Here's what you can expect:
Airbnb Occupancy Tiers in Cagliari
Premium(Top 10%) | High-performing(Top 25%) | Average(Median) | Low-performing(Bottom 25%) |
|---|---|---|---|
| 90% | 71% | 47% | 27% |
*High desirability & optimized availability | *Good market fit & guest satisfaction | *Standard market performance | *Higher vacancy, optimization needed |
Seasonal Occupancy Patterns in Cagliari
September, July
Highest demand and occupancy rates. Perfect for premium pricing strategies and maximizing revenue. Consider longer minimum stays and higher rates.
March, February
Moderate demand with balanced pricing opportunities. Good for attracting budget-conscious travelers while maintaining reasonable occupancy rates.
January, December
Lower demand requires competitive pricing and creative marketing. Focus on local events, extended stay discounts, and targeting specific traveler segments.
How Much Can You Earn with Airbnb in Cagliari?
Calculate Earnings →One of the most common questions for potential Airbnb hosts in Cagliari is about earning potential. Let's break down the revenue patterns and what you can realistically expect to earn.
Monthly Revenue Trends in Cagliari
Best-in-class Airbnb properties (top 10%) in Cagliari achieve around €35,499 annually, while strong performers (top 25%) earn at least €23,926. Typical properties generate about €14,414 per year, and entry-level listings (bottom 25%) see earnings near €7,173, often with room for optimization. Keep in mind, these are market averages—your actual earnings can be even higher depending on your property's location, bedrooms, guest capacity, and unique amenities.
Want to see how your listing could perform? Create a free account to unlock personalized analytics and explore exclusive insights in our app!
What Can You Learn from Top-Performing Airbnbs in Cagliari?
View Top Performers →Studying successful properties provides valuable insights for your own Airbnb strategy. Here are the top-performing listings in Cagliari and what makes them successful.
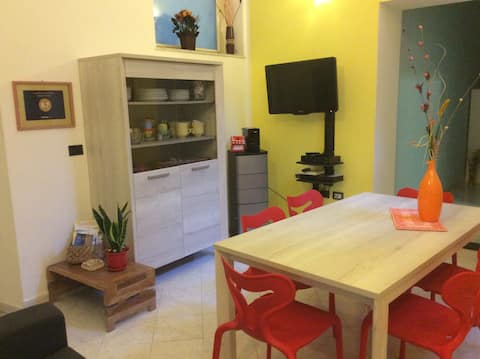
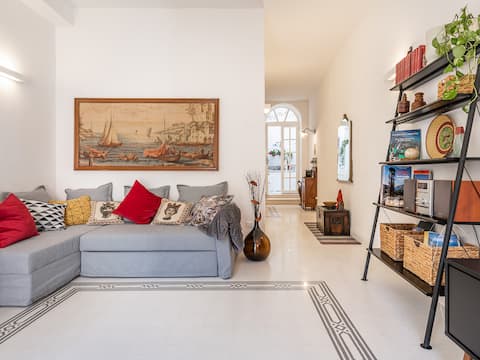
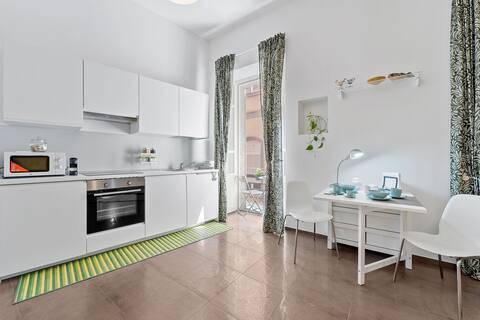
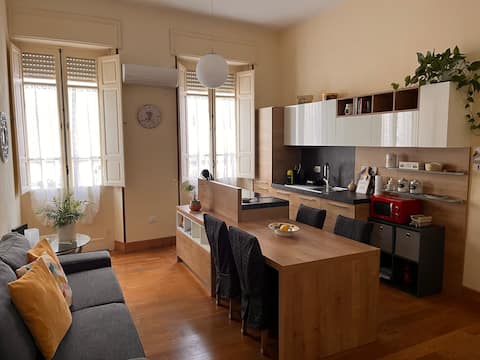
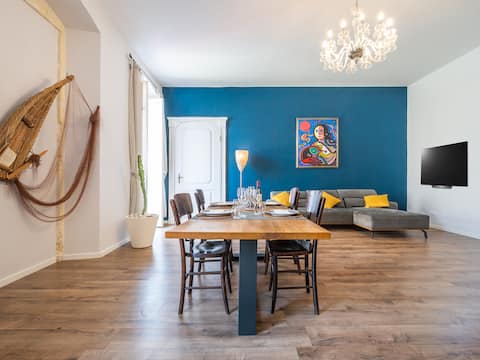
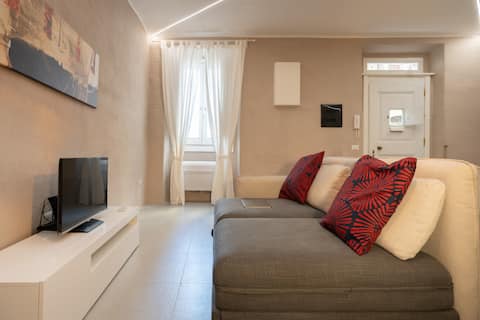
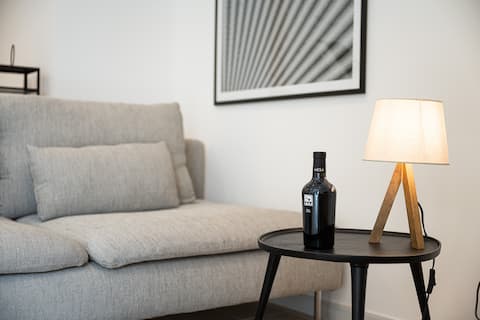
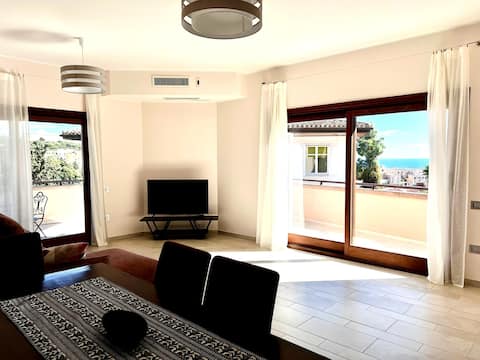
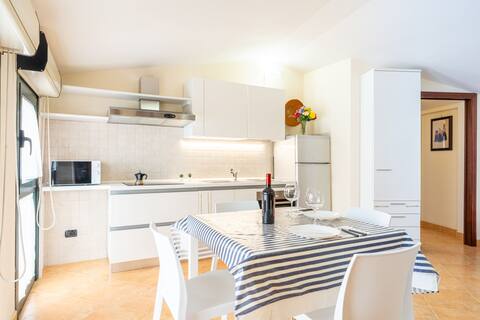
Cagliari Market Analysis
Castello, Marina, and business-week demand
Corporate and public-sector weeks, university terms, and conference traffic support Monday–Thursday occupancy in Castello, Marina, and Stampace corridors where walkable restaurants beat raw beach ADR. Guests want reliable Wi‑Fi, elevator or honest stair disclosures, and parking guidance for rental cars staged toward the south coast. Compare with Palermo port-and-food positioning—Cagliari’s weekday curve is capital-administration weighted, not cruise-turnaround dominant.
Poetto, Villasimius, and summer beach calendars
Poetto and Sella del Diavolo views drive July–August family bookings; operators must disclose beach transfer time from centro attics without AC. Villasimius and Chia day-trips extend stays when listings market honest car logistics. Olbia captures more Costa Smeralda spend; Cagliari hosts compete on southern-island hub value and Elmas access.
Shoulder seasons and island road-trippers
Spring and autumn bring mild city breaks and hiking toward Iglesias or the east coast; winter can surprise with sun-seeking Europeans when heating and humidity control are solid. Citywide 66% blends these highs with quieter January weeks—model full-year revenue, not only August screenshots.
What Are the Airbnb Regulations in Cagliari?
Understanding local regulations is crucial for operating a successful Airbnb. Let's examine the compliance landscape and what you need to know about licensing requirements in Cagliari.
Current Regulatory Status
65% compliance indicates strict regulatory enforcement in this market.
| Host type | Typical path | Official starting point |
|---|---|---|
| Private occasional letting | Comunicazione + IUN | Comune — locazioni occasionali → IUN portal |
| Business / habitual operator | SCIA via SUAPE | SUAPE Sardegna (modulo F51) |
| All hosts | CIN, Alloggiati Web, tourist tax | BDSR · Alloggiati Web · Imposta di soggiorno |
From 1 February 2025, private locazioni occasionali IUN requests run on the regional portal (Regione Sardegna — registro locazioni occasionali); follow the guida locazioni occasionali. Italy caps each contract at 30 days; CIN is mandatory once registered (Ministry BDSR). Many private hosts use cedolare secca on up to two apartments (Agenzia delle Entrate — locazioni brevi); three or more units habitually require SCIA and business taxation under art. 13-ter, L. 191/2023.
What Should You Charge for Your Airbnb in Cagliari?
Smart Pricing Tools →Pricing is one of the most critical decisions for Airbnb success. Let's analyze the current pricing landscape and help you understand what rates you can realistically charge.
The current average daily rate in Cagliari is €123 per night. However, pricing varies significantly based on property quality and location. Here's what different property tiers typically charge:
Airbnb Pricing Tiers in Cagliari
Premium(Top 10%) | High-performing(Top 25%) | Average(Median) | Budget(Bottom 25%) |
|---|---|---|---|
| €164per night | €116per night | €79per night | €45per night |
*Top locations, big properties, premium amenities | *Good property management, highly rated | *Standard market performance | *Basic properties, less desirable locations |
Is It Profitable to Start an Airbnb in Cagliari?
Investment Analysis →Understanding the profitability potential is crucial for any Airbnb investment decision. Let's analyze the revenue performance and profit margins in the Cagliari market to help you make informed financial decisions.