Best Airbnb Markets in Sicilia, Italy
The Sicilia, Italy short-term rental market offers diverse opportunities for investors who know where to look. By analyzing the top 10 performing markets, we’ve highlighted the towns that currently lead the way in occupancy and revenue.
Remember that the figures shown here are regional averages and should be used as a guide for further investigation. To access precise performance data, custom reports, and professional-grade analytics, head over to GuestFavorites.
Sicilia Airbnb Market Map (June 2026)
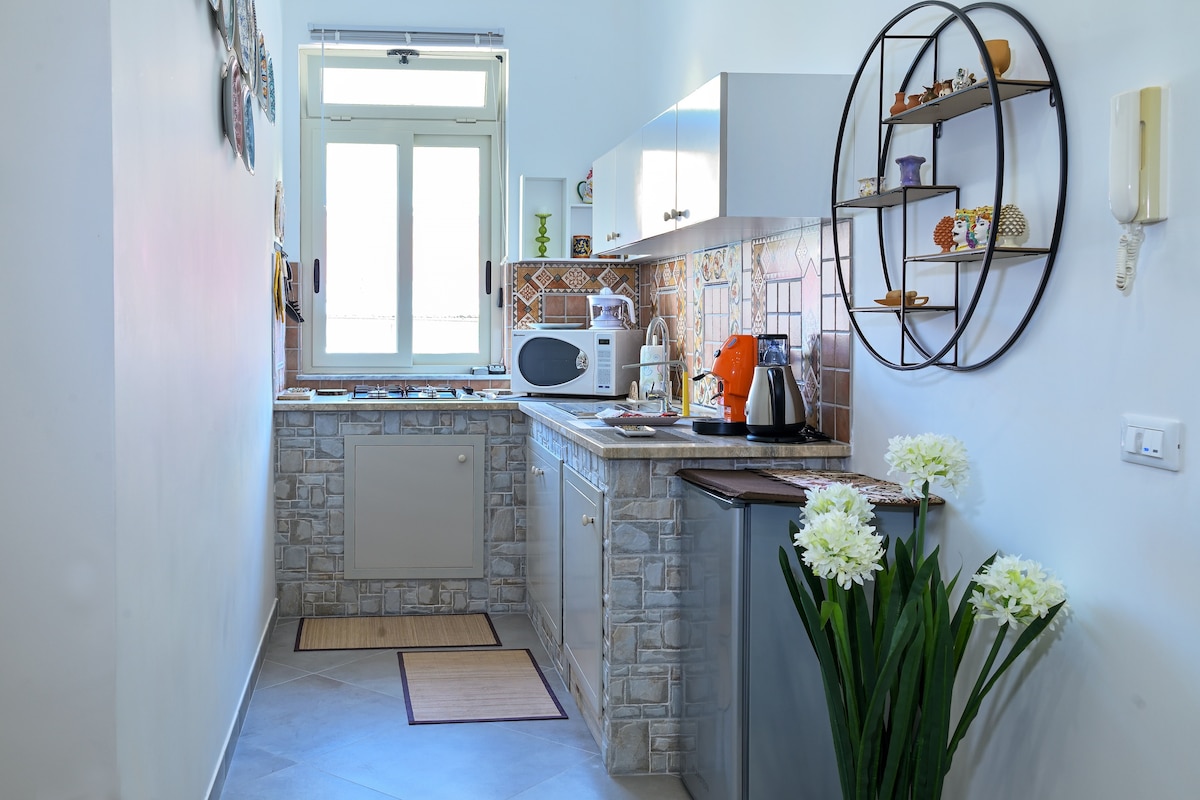
Palermo, the capital of culture and a crossroads of civilizations in the heart of the Mediterranean, is a city vibrant with history, historic markets, and UNESCO-listed Arab-Norman architecture. Between the decadent charm of its noble palaces and the energy of its world-famous street food, it attracts massive international tourism year-round. The Airbnb market is extremely powerful and efficient here, featuring an occupancy rate of 60%. Visitors seek the unique charm of apartments in historic city-center palaces and the modernity of lofts in revitalized neighborhoods, paying an average daily rate of €100. Its global appeal ensures a consistent annual revenue of €22,138.
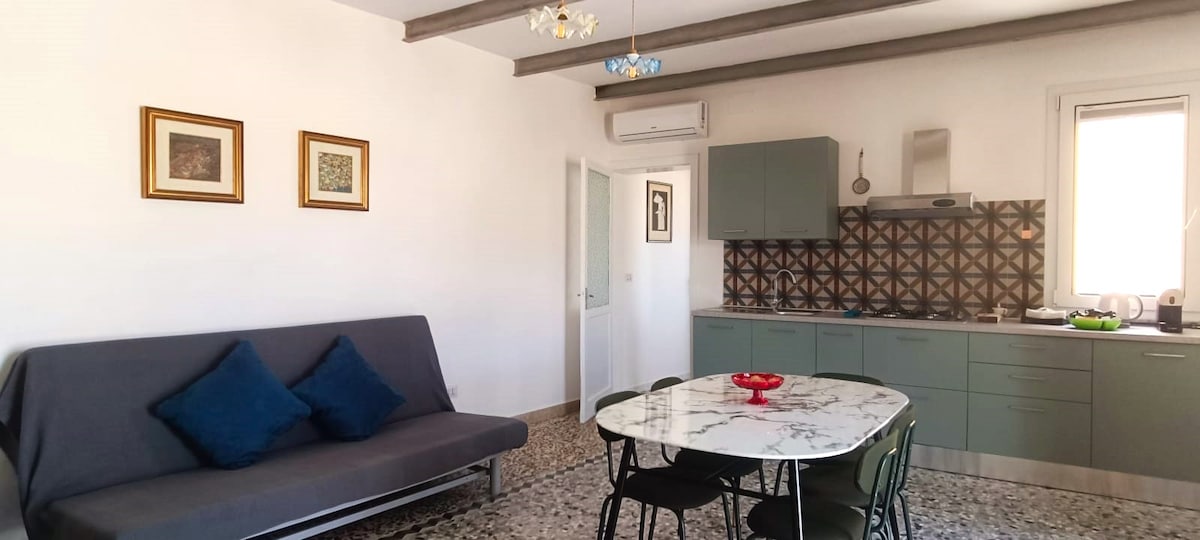
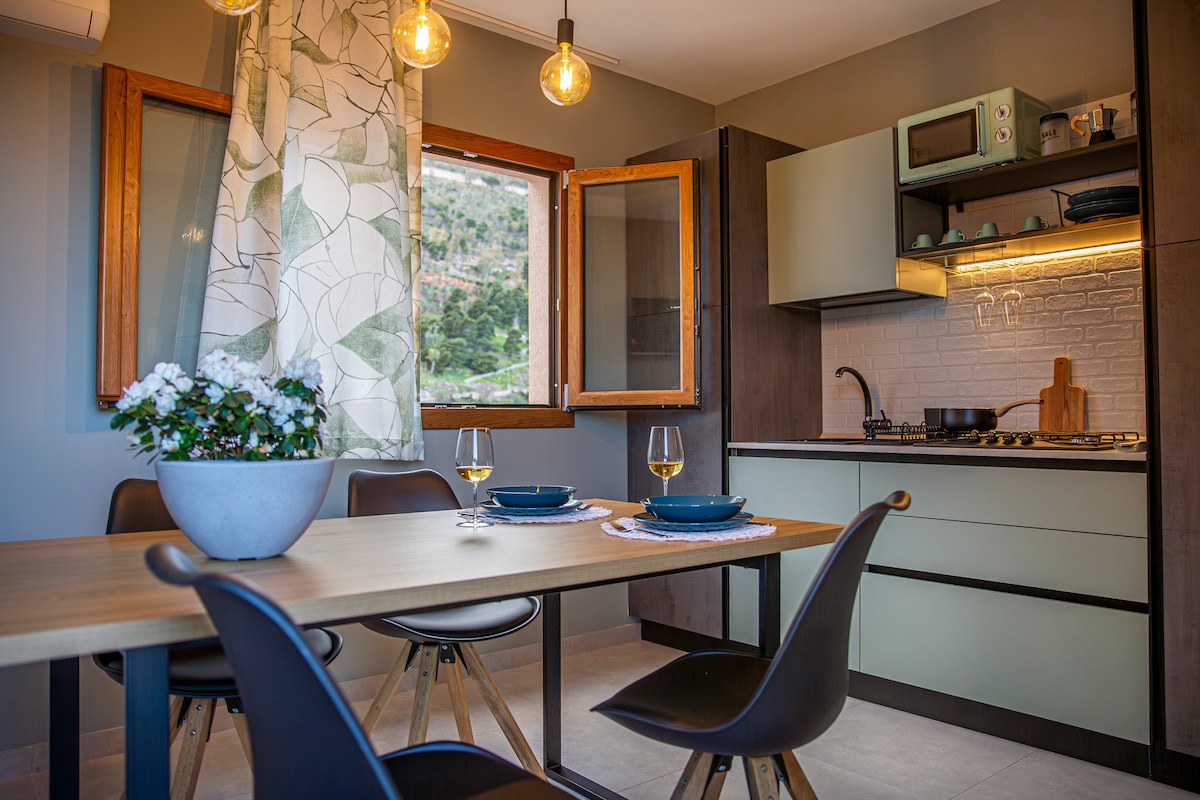
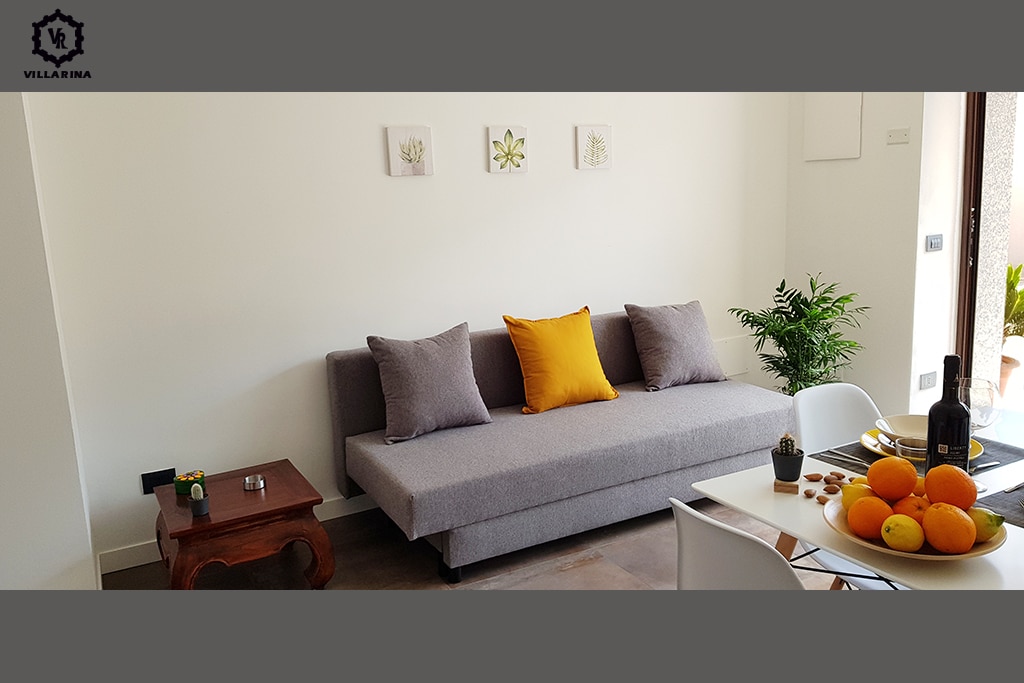
Featured Listings
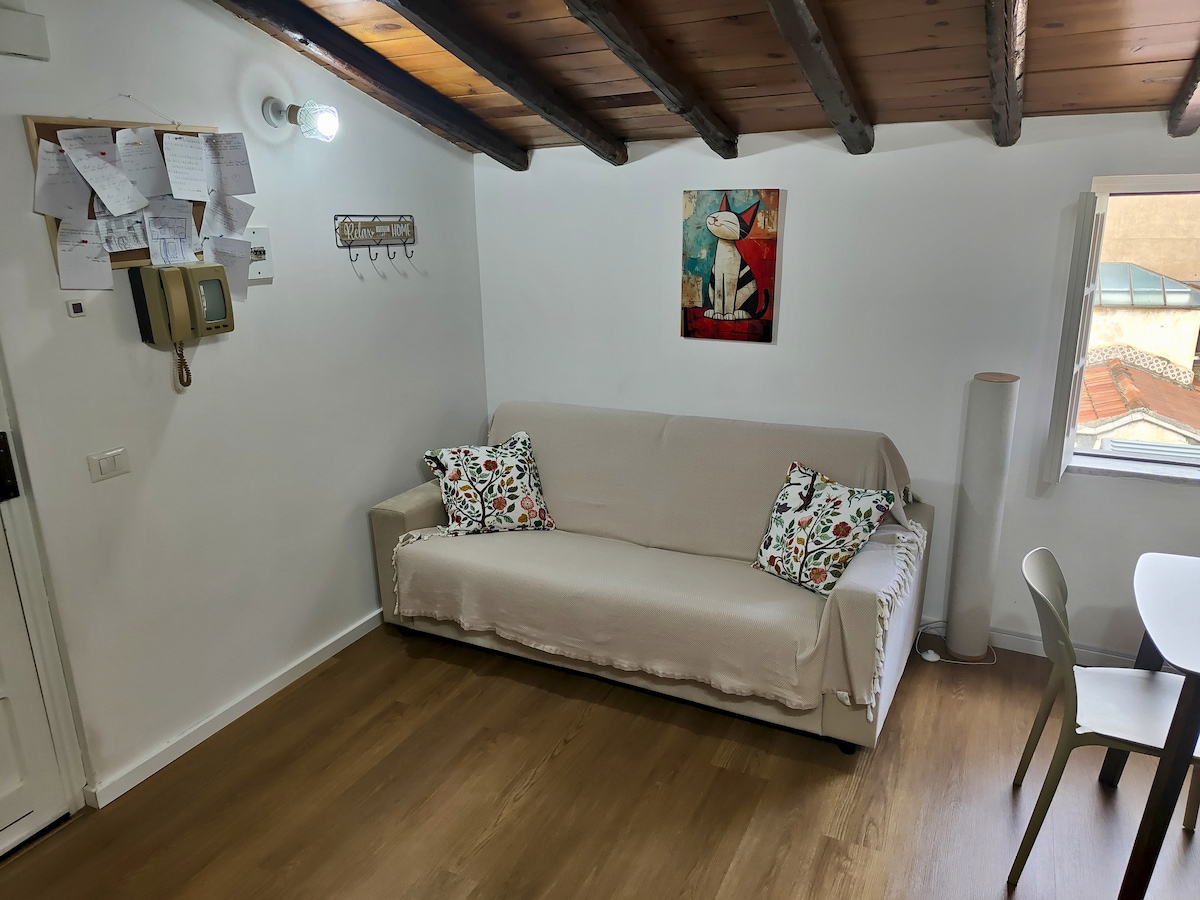
Siracusa, the ancient Greek metropolis that enchants with the island of Ortigia and its Archaeological Park, is a jewel of history and beauty on the Ionian Sea. It is a world-class destination attracting cultured international tourism seeking art, crystal-clear waters, and the elegance of Sicilian Baroque. The Airbnb market is very solid here, featuring an occupancy rate of 58%. Visitors seek the irresistible charm of apartments among Ortigia’s narrow alleys and the exclusivity of residences overlooking the harbor, paying an average daily rate of €144. Generating an annual revenue of €30,627, Siracusa is a safe bet for tourism real estate investment.
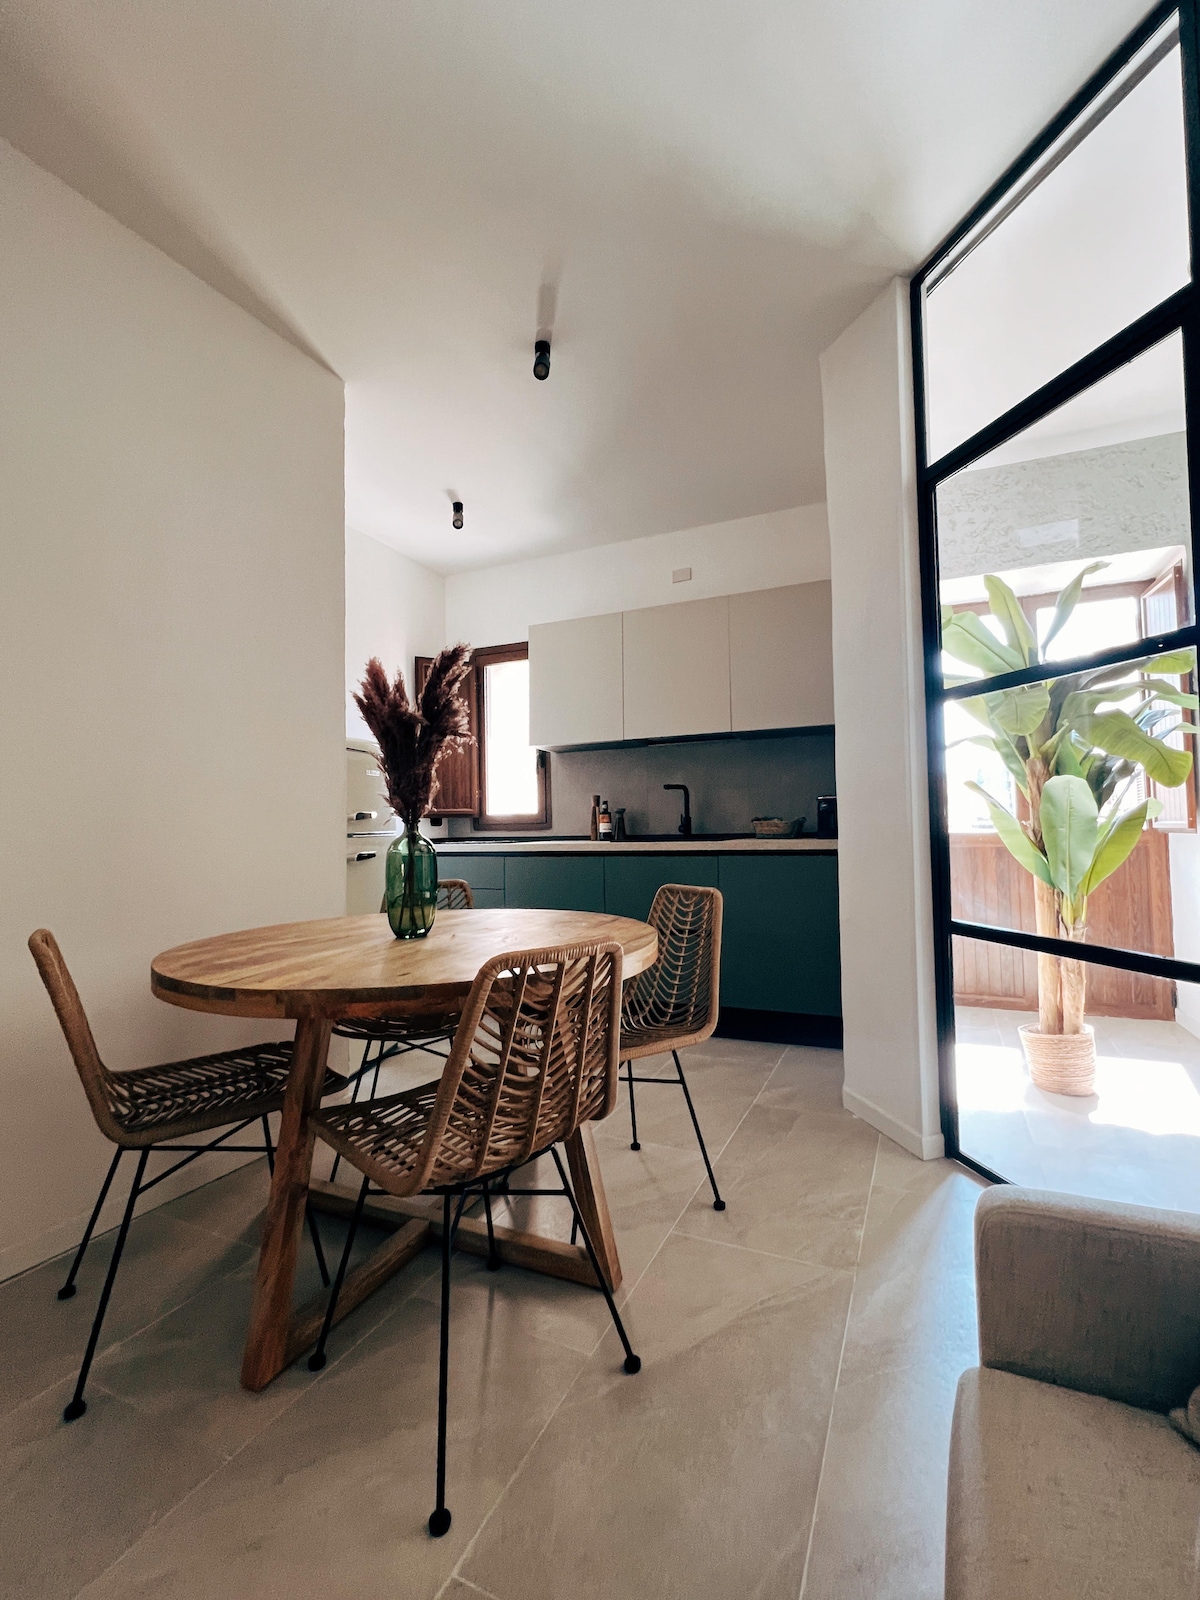
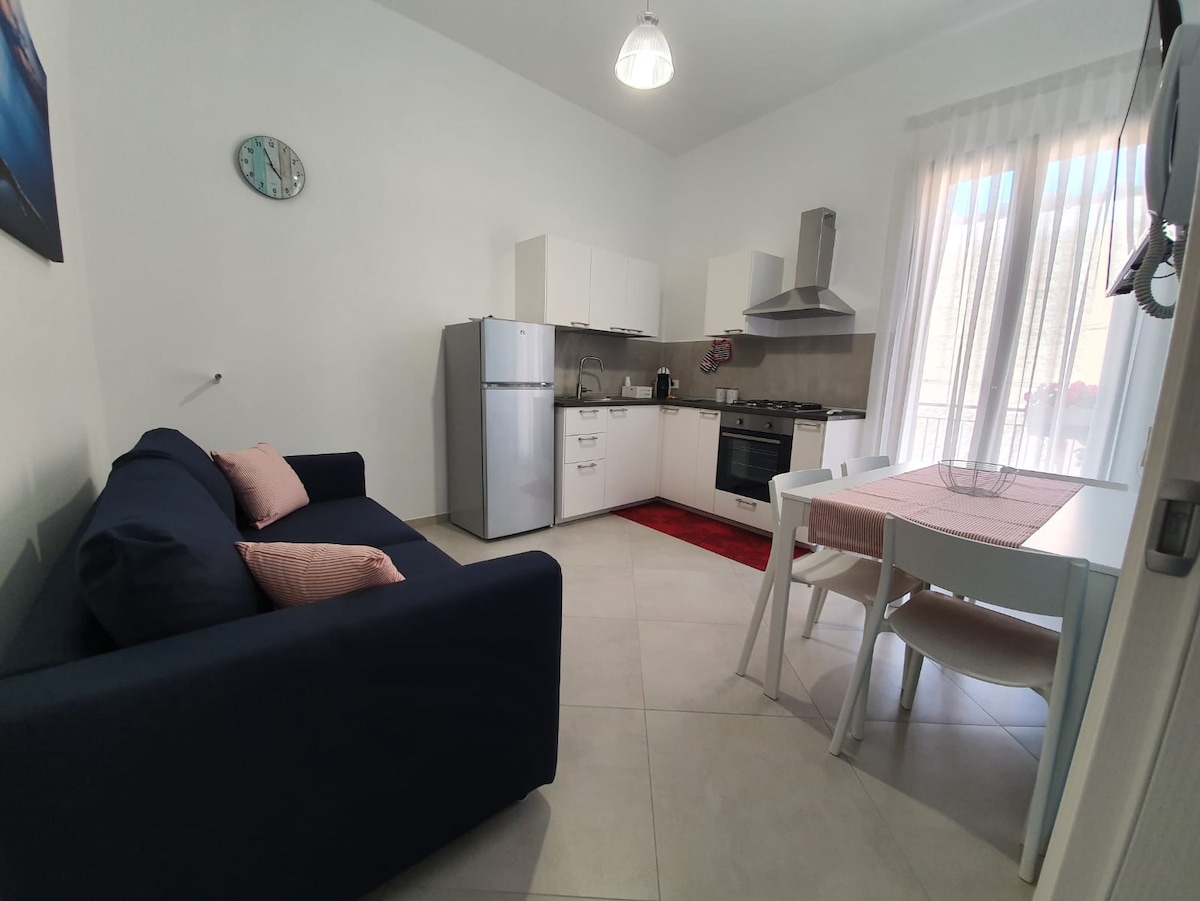
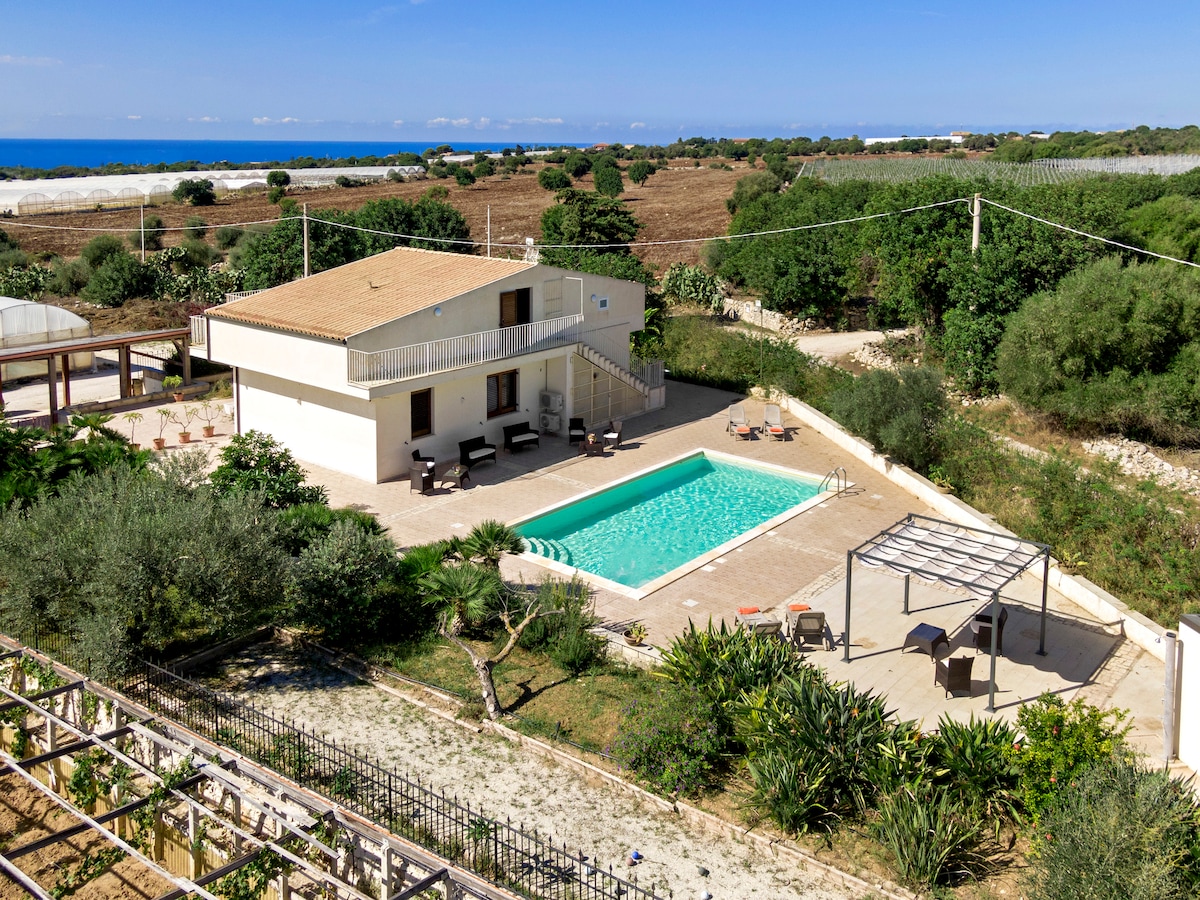
Featured Listings
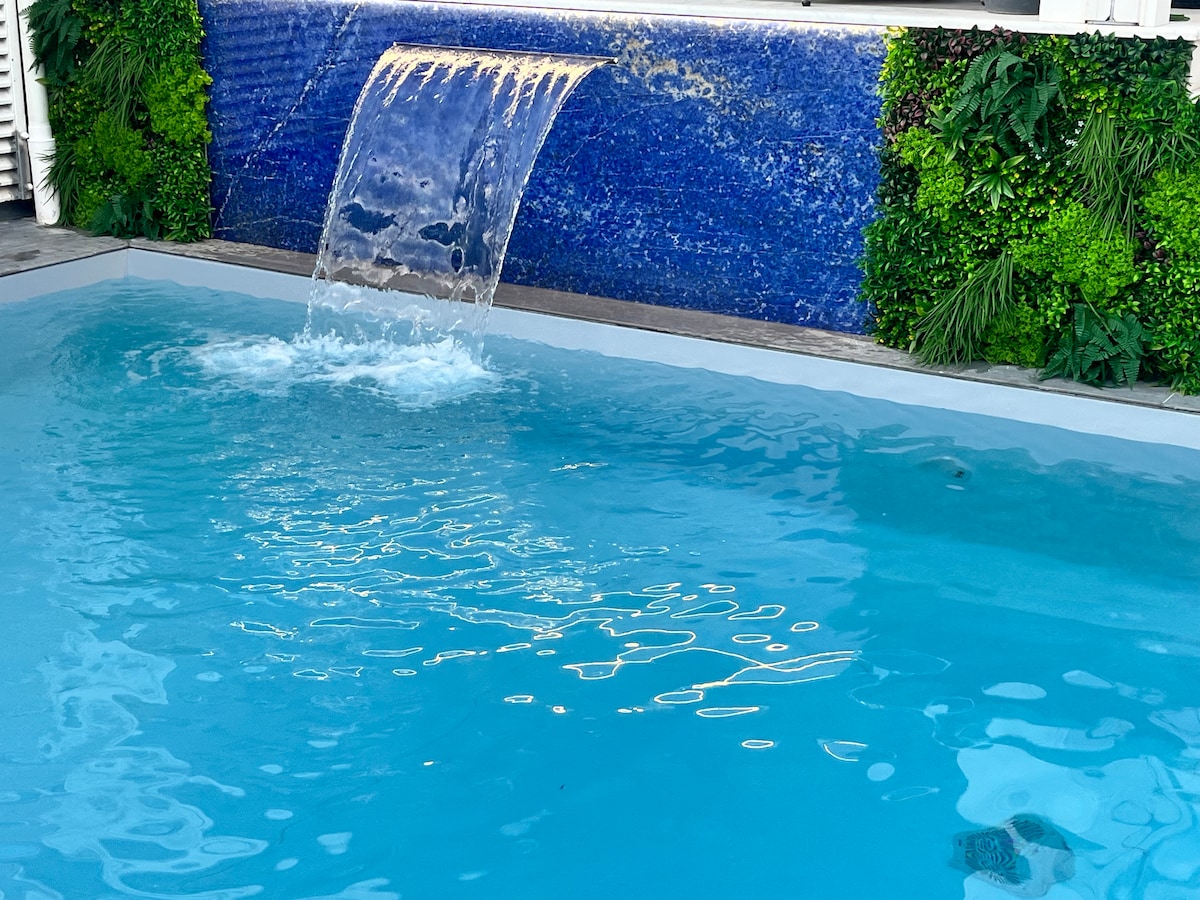
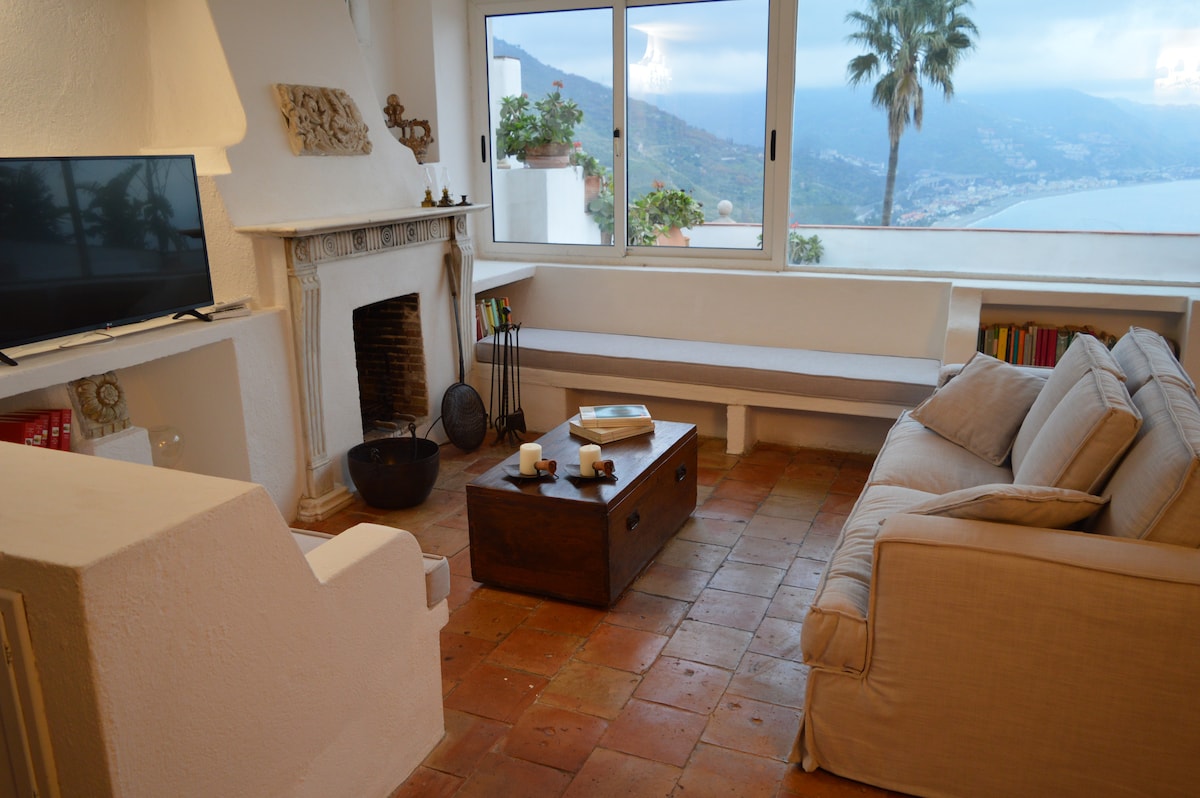
Taormina, the ‘Pearl of the Ionian’ suspended on a scenic terrace between Mount Etna and the sea, is a global icon of luxury and Sicilian elegance, famous for its Ancient Theater. It is an unparalleled elite market attracting the international jet-set seeking absolute beauty, high-end shopping, and dreamlike views. The Airbnb market is extraordinarily profitable here, featuring an occupancy rate of 65%. Visitors seek exclusive apartments in the historic center and the charm of sea-view villas with pools, paying an average daily rate of €229. Its annual revenue of €54,509 places it at the top of global profitability rankings.
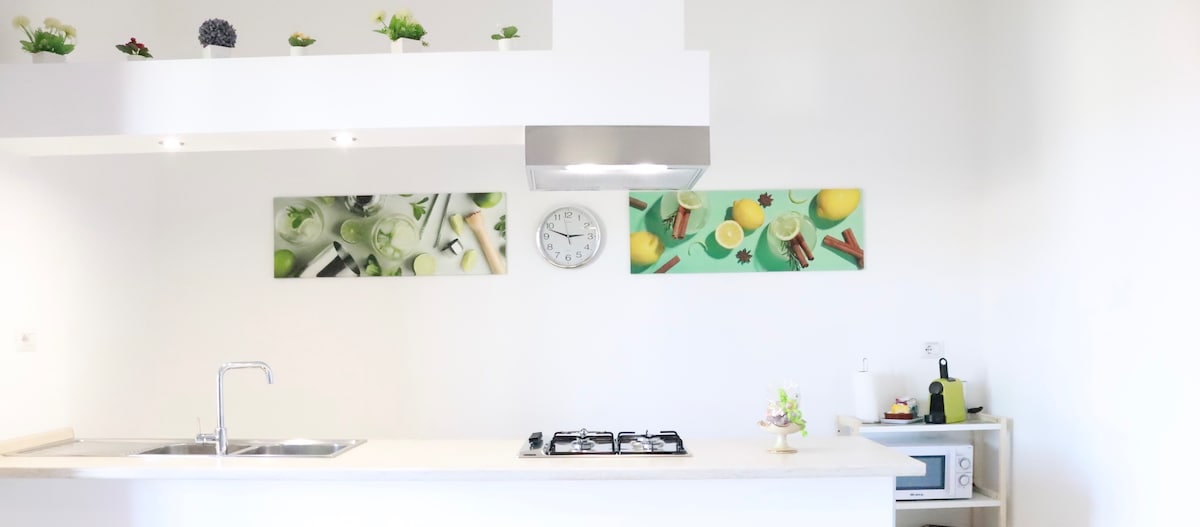
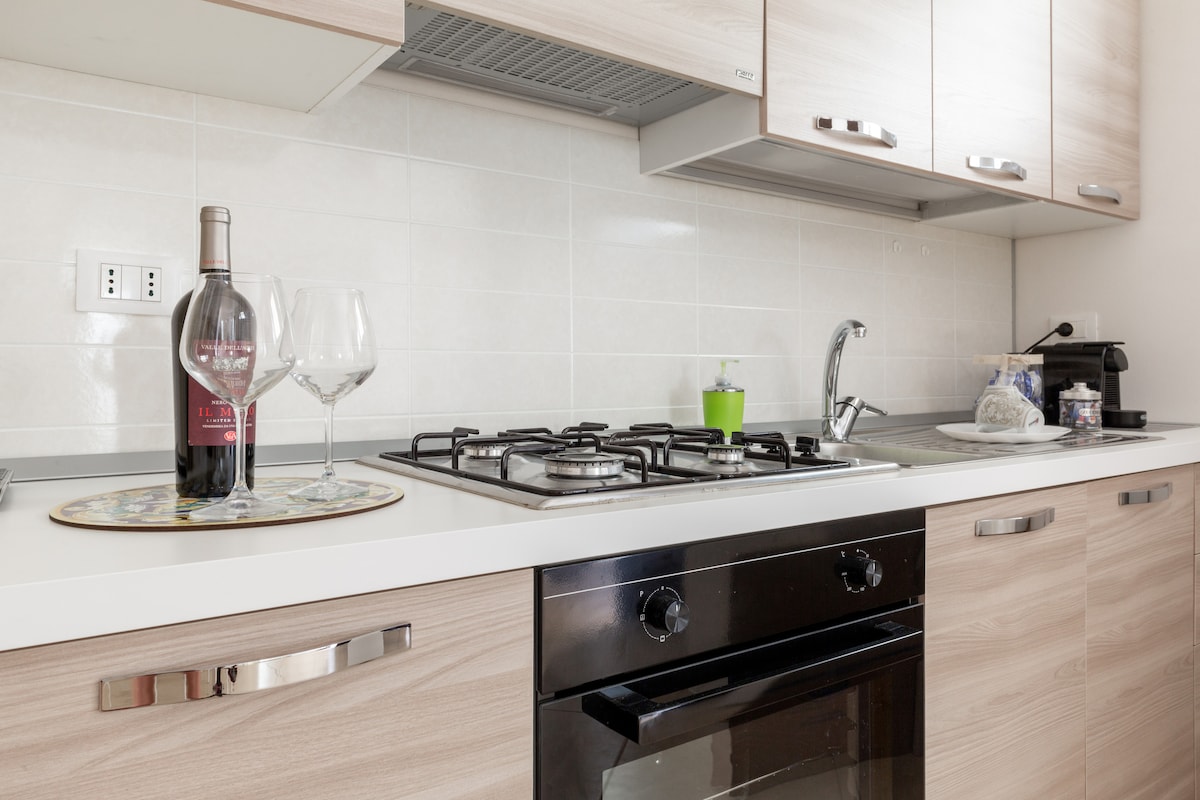
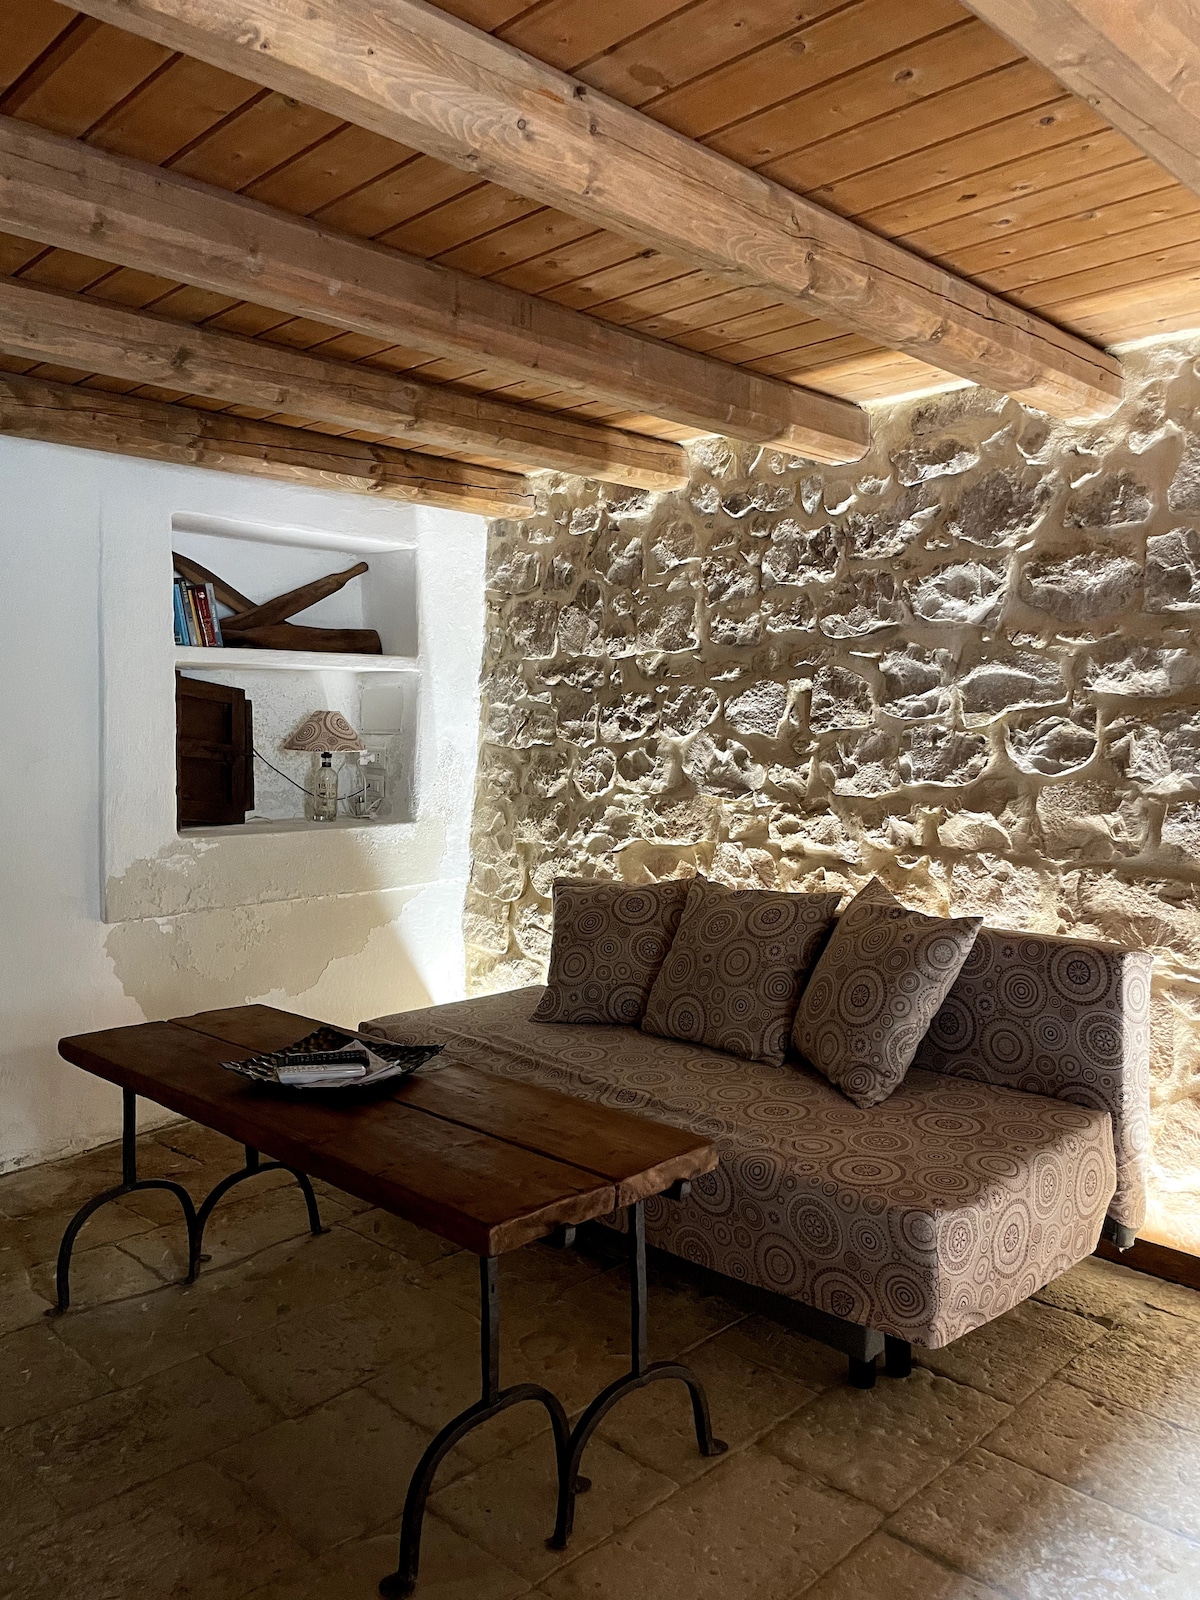
Featured Listings
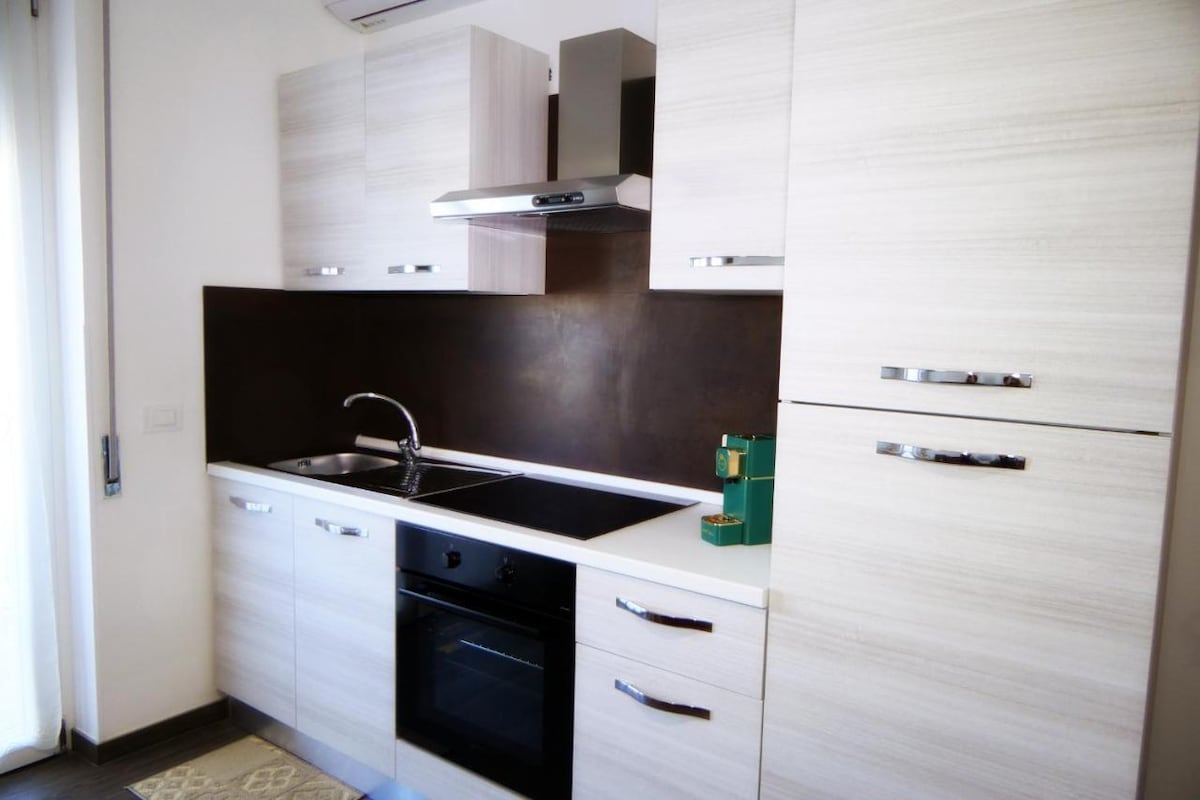
Catania, the lava city in the shadow of Mount Etna, is a vibrant hub of Baroque history, traditional markets, and unique urban energy merging sea and mountains. Thanks to its strategic location and international airport, it attracts diverse tourism interested in volcano trekking and the lively Sicilian nightlife. The Airbnb market is extremely efficient here, featuring an occupancy rate of 58%. Visitors seek modern apartments in the historic center and stylish lofts near the station and sea, paying an average daily rate of €86. Its role as the economic and tourism engine of eastern Sicily ensures consistent year-round profitability.
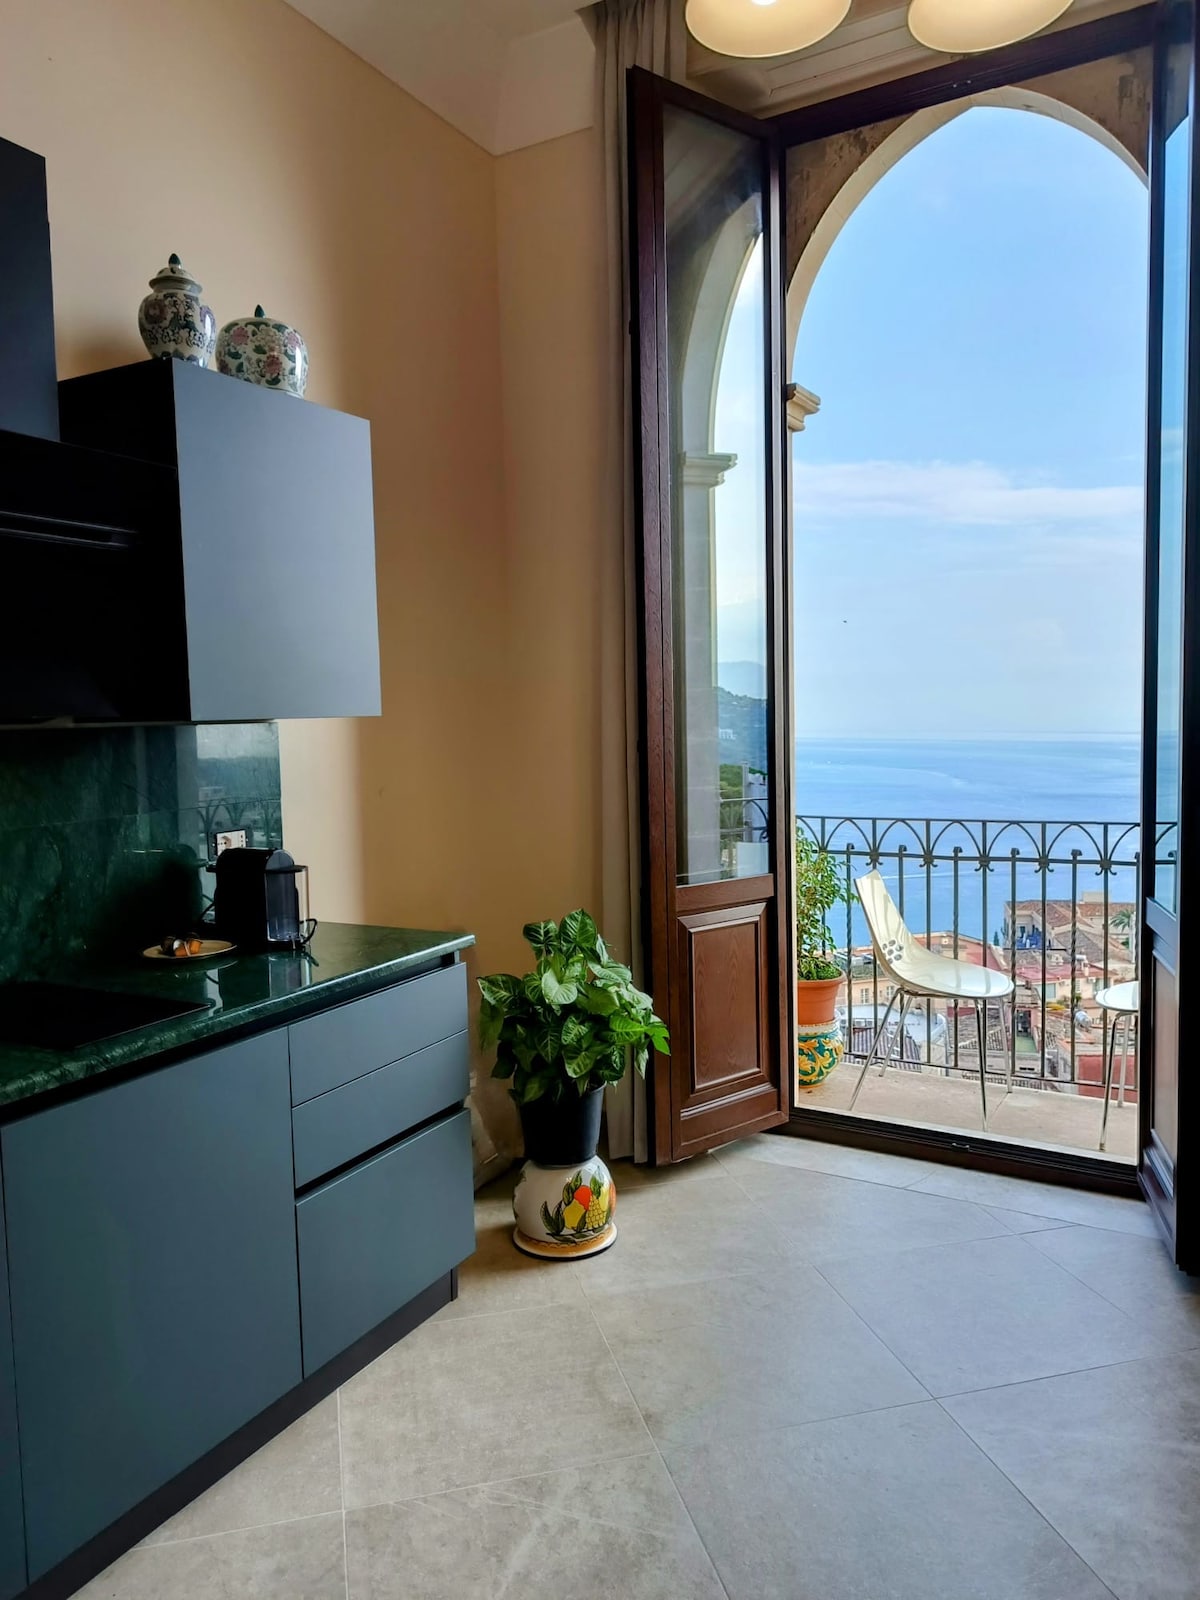
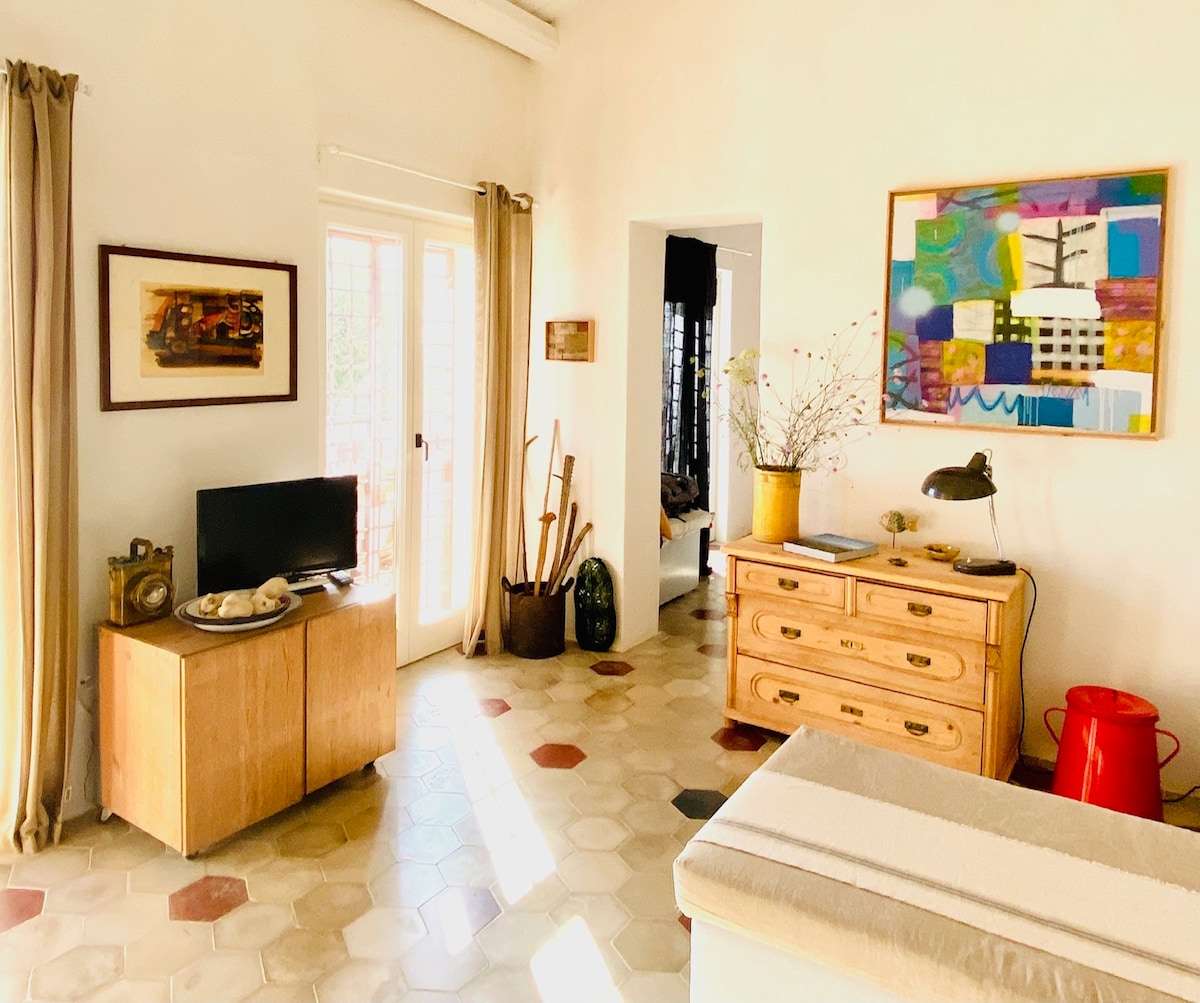
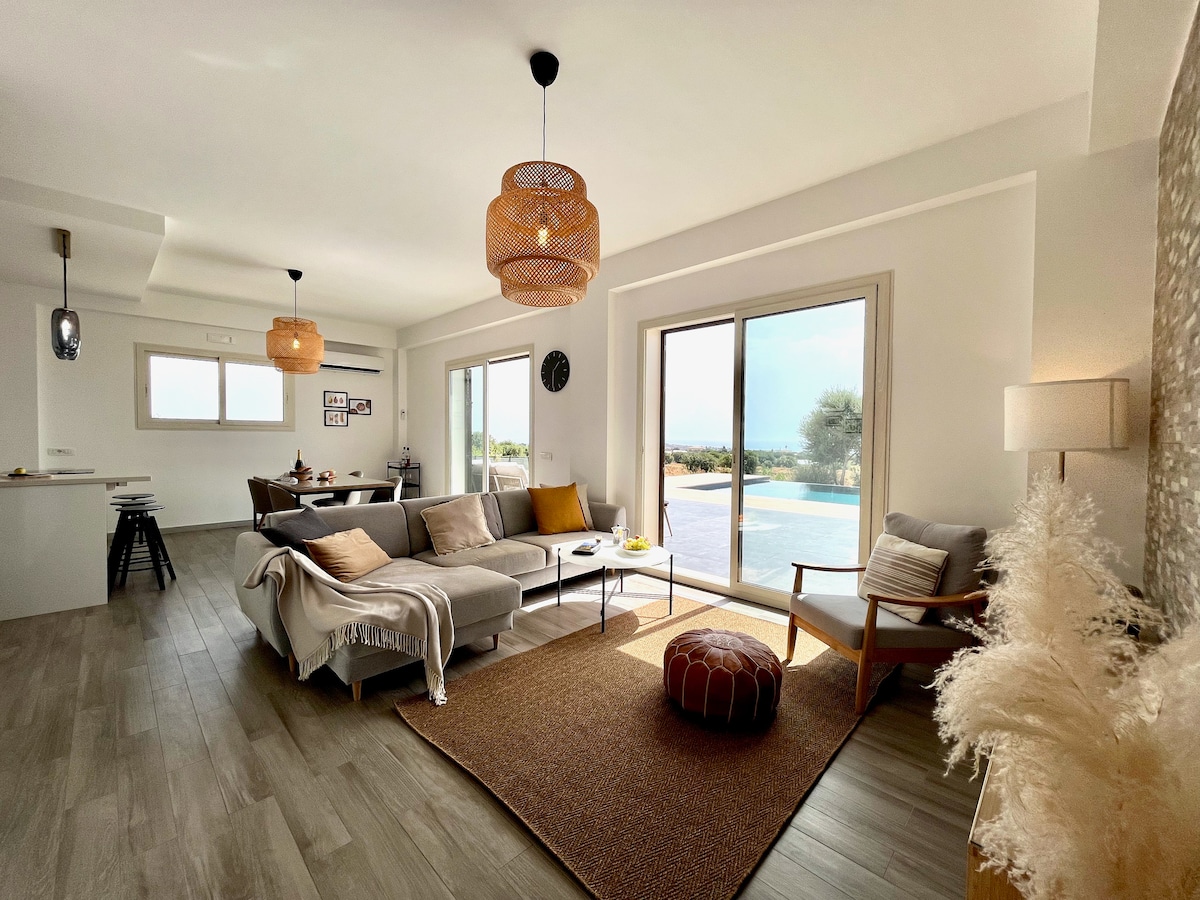
Featured Listings

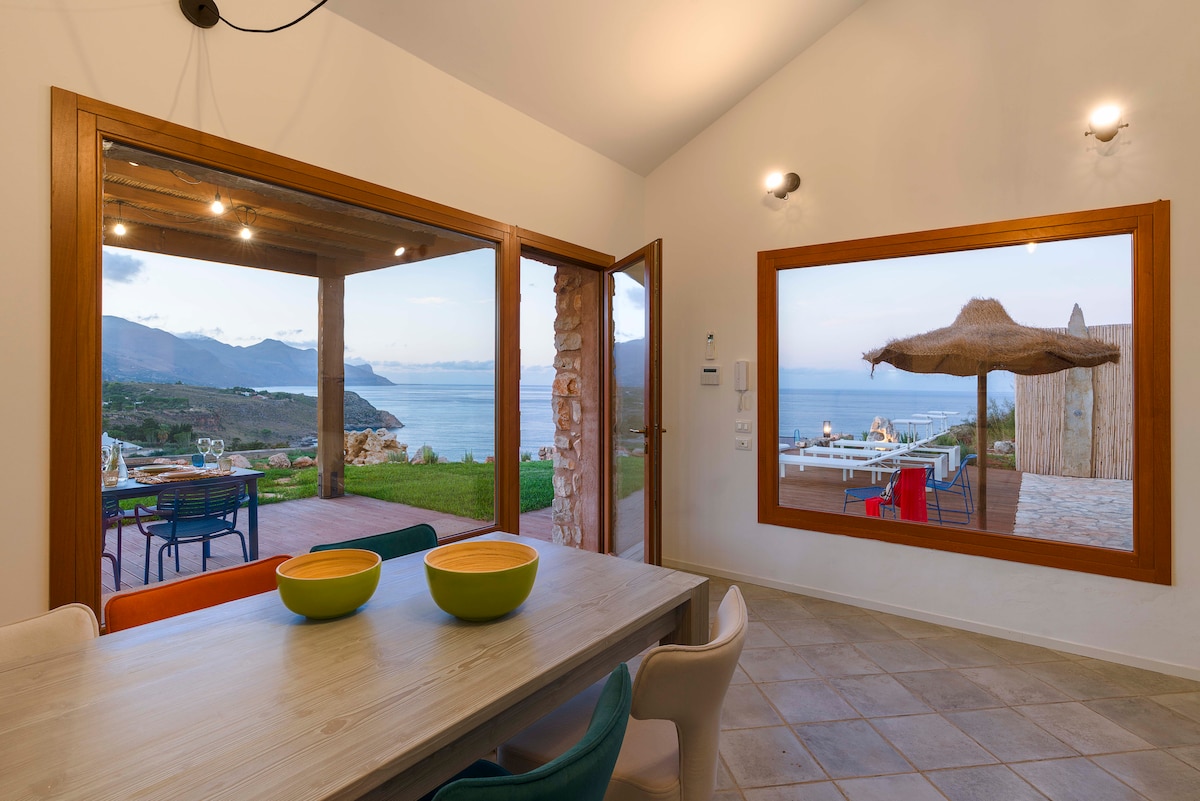
Castellammare del Golfo, nestled between Mount Inici and crystal-clear waters, is a destination of rare beauty famous for its seaside castle, Scopello beaches, and the Zingaro Reserve. It is a village of authentic charm attracting international tourism seeking untouched nature, fishing villages, and spectacular views. The Airbnb market is very solid here, featuring an occupancy rate of 58%. Visitors seek the charm of old-town apartments and the exclusivity of residences overlooking the gulf, paying an average daily rate of €190. Its annual revenue of €40,435 confirms the success of investing in the heart of western Sicily.
Featured Listings
Noto, the world capital of UNESCO-listed Sicilian Baroque, is an open-air museum of golden stone that enchants with its perfect perspectives and elegant palaces. It is a prestigious destination attracting international tourism seeking art, discreet luxury, and the wild beauty of Vendicari’s beaches. The Airbnb market is high-performing here, featuring an average daily rate of €217. Visitors seek the charm of historic apartments in the monumental center and the exclusivity of ‘dammusi’ and villas in the surrounding countryside, generating an annual revenue of €43,908. Its image as a golden gem ensures high-profile demand year-round.
Featured Listings

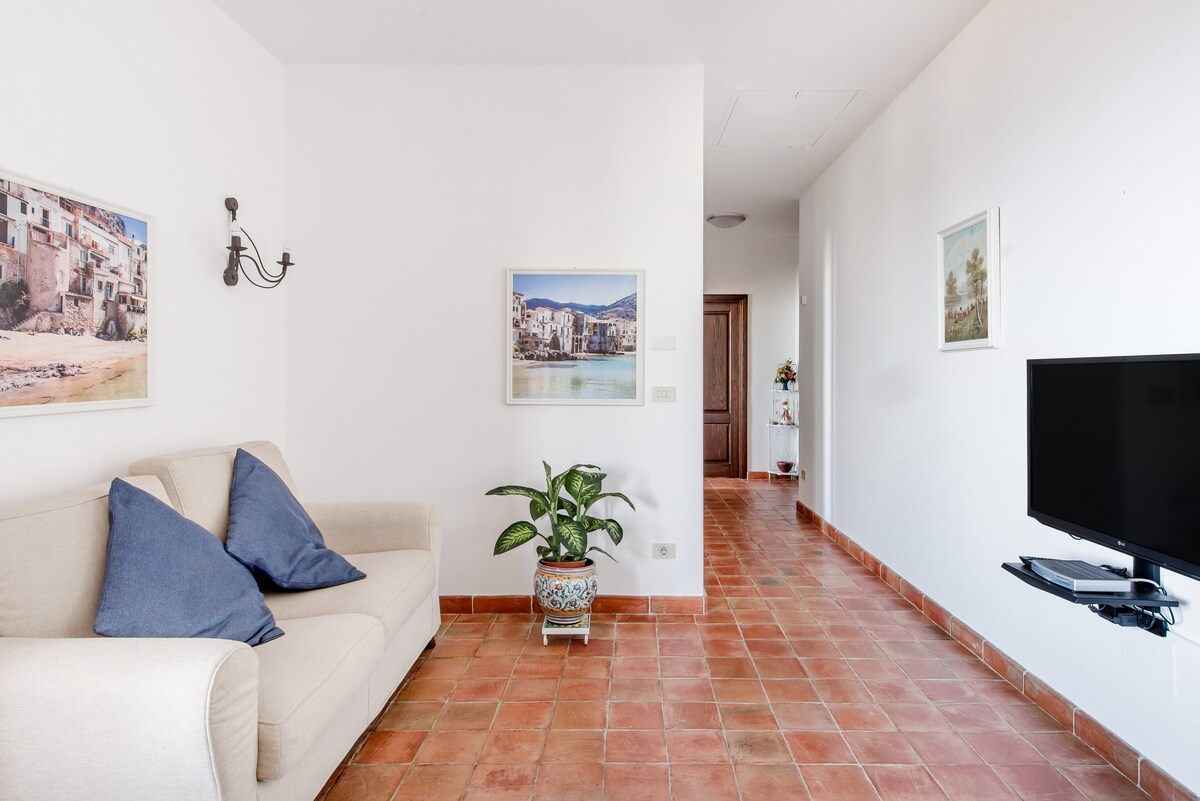
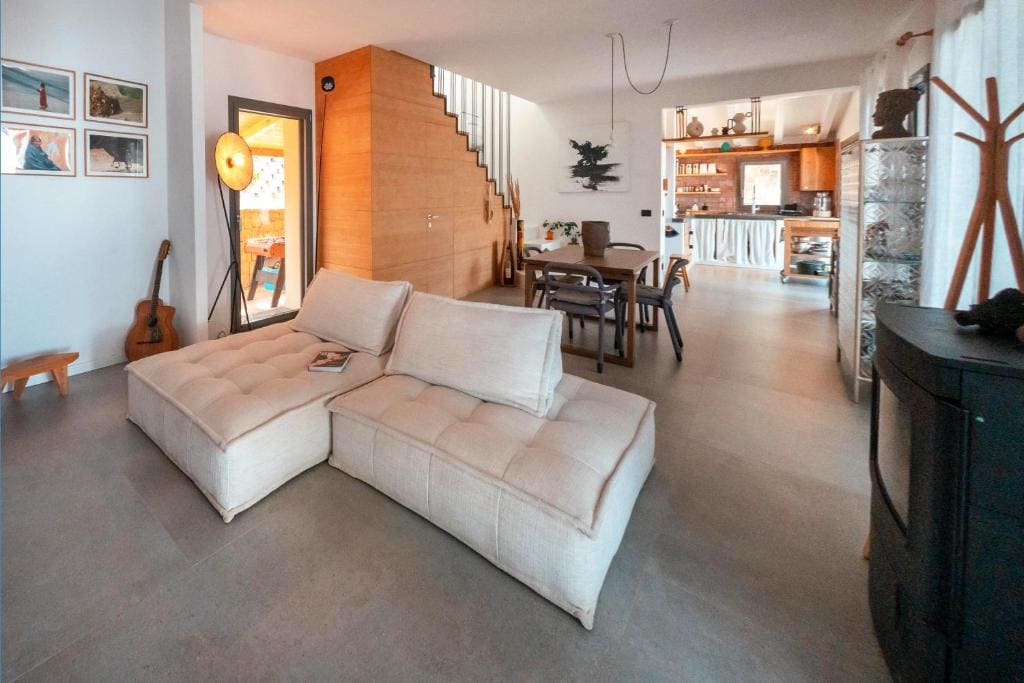
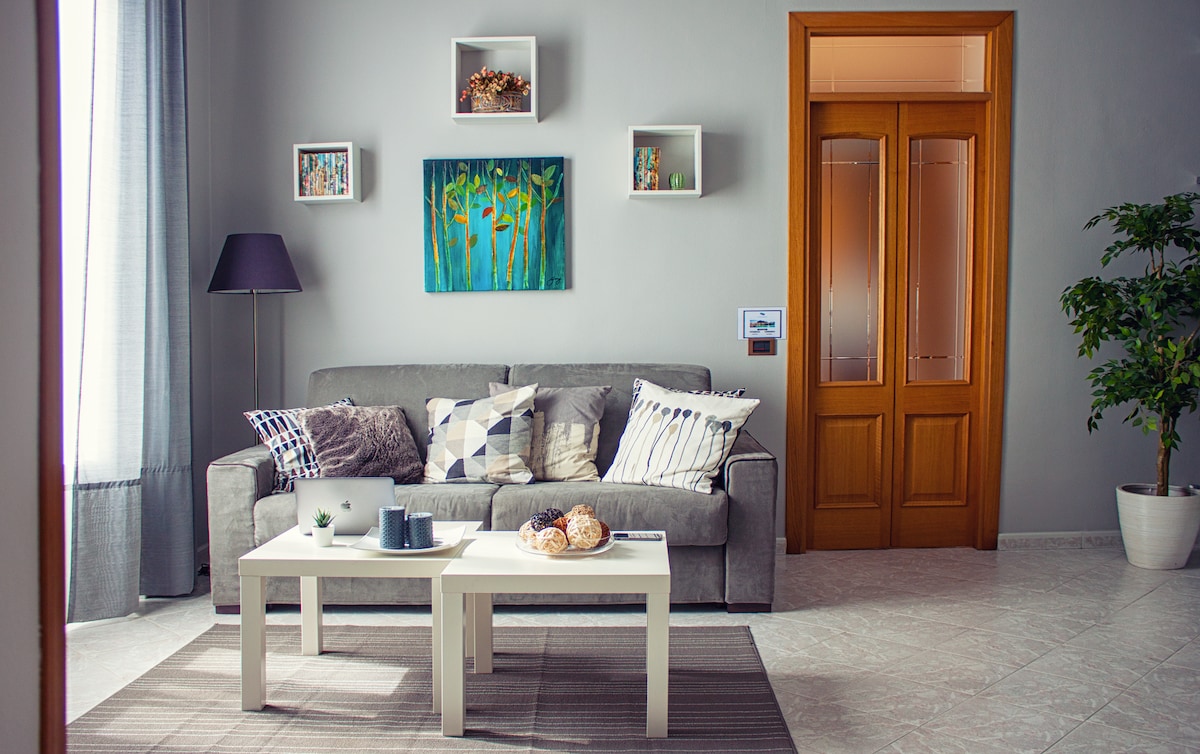
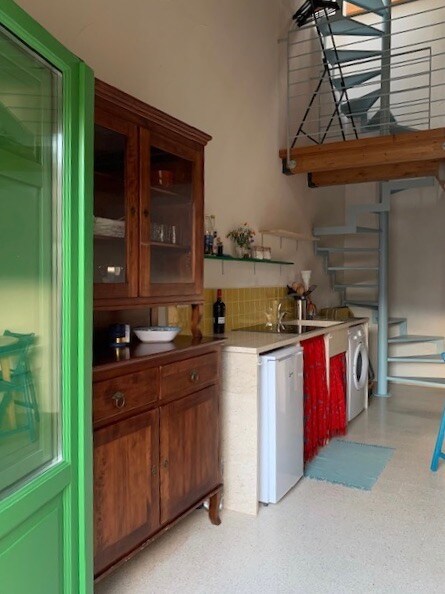
Cefalù, the Norman village at the foot of an imposing rock reflected in the Tyrrhenian Sea, is a legendary destination famous for its UNESCO-listed Cathedral and golden coastline. It is a gem of beauty and history attracting international tourism seeking art, crystal-clear waters, and an authentic Mediterranean atmosphere. The Airbnb market is extraordinarily efficient here, featuring an occupancy rate of 64%. Visitors seek the charm of apartments in the medieval city-center alleys and the exclusivity of sea-view residences, paying an average daily rate of €157. Its annual revenue of €37,247 ensures a high-profile investment in one of Italy’s most beloved destinations.
Featured Listings
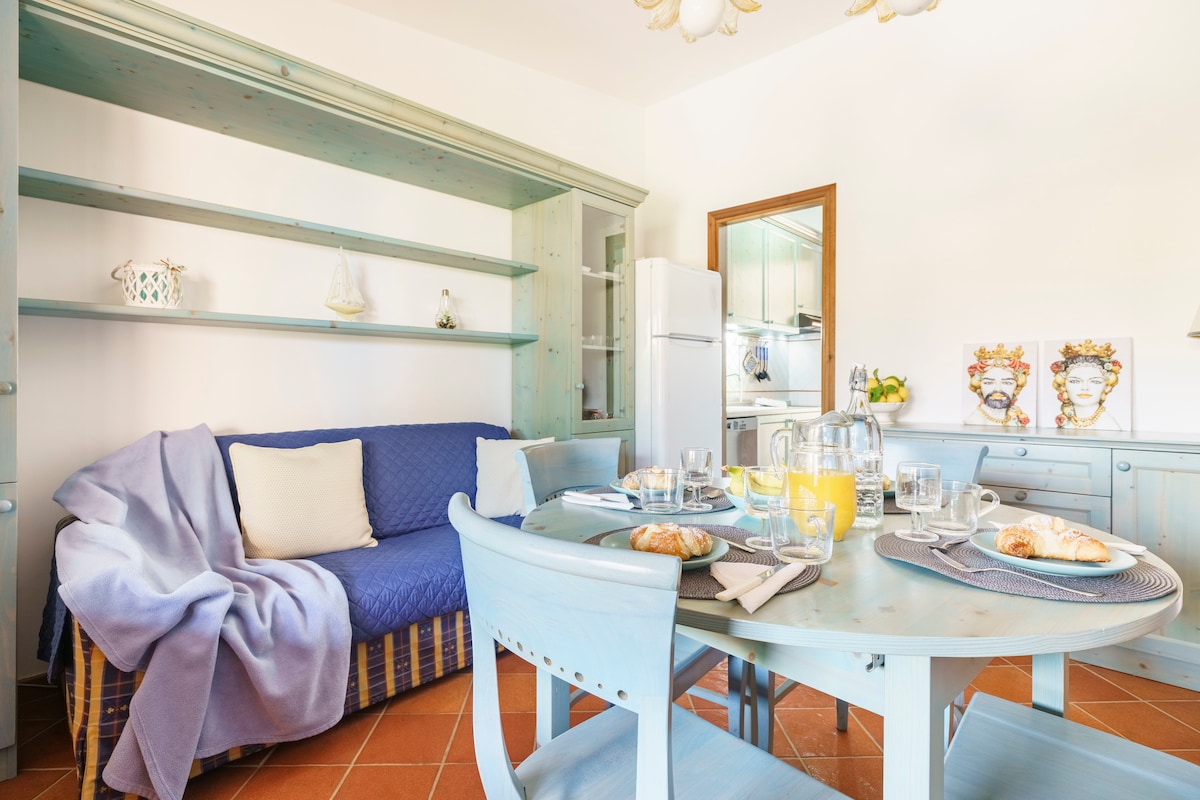
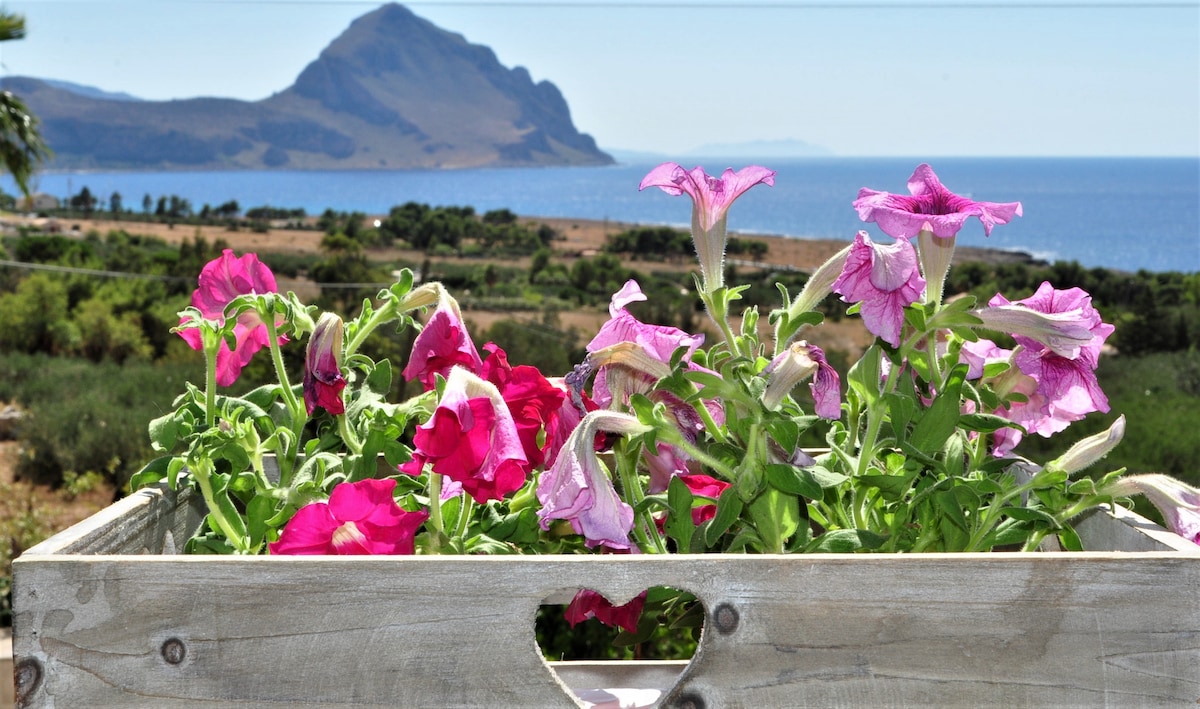
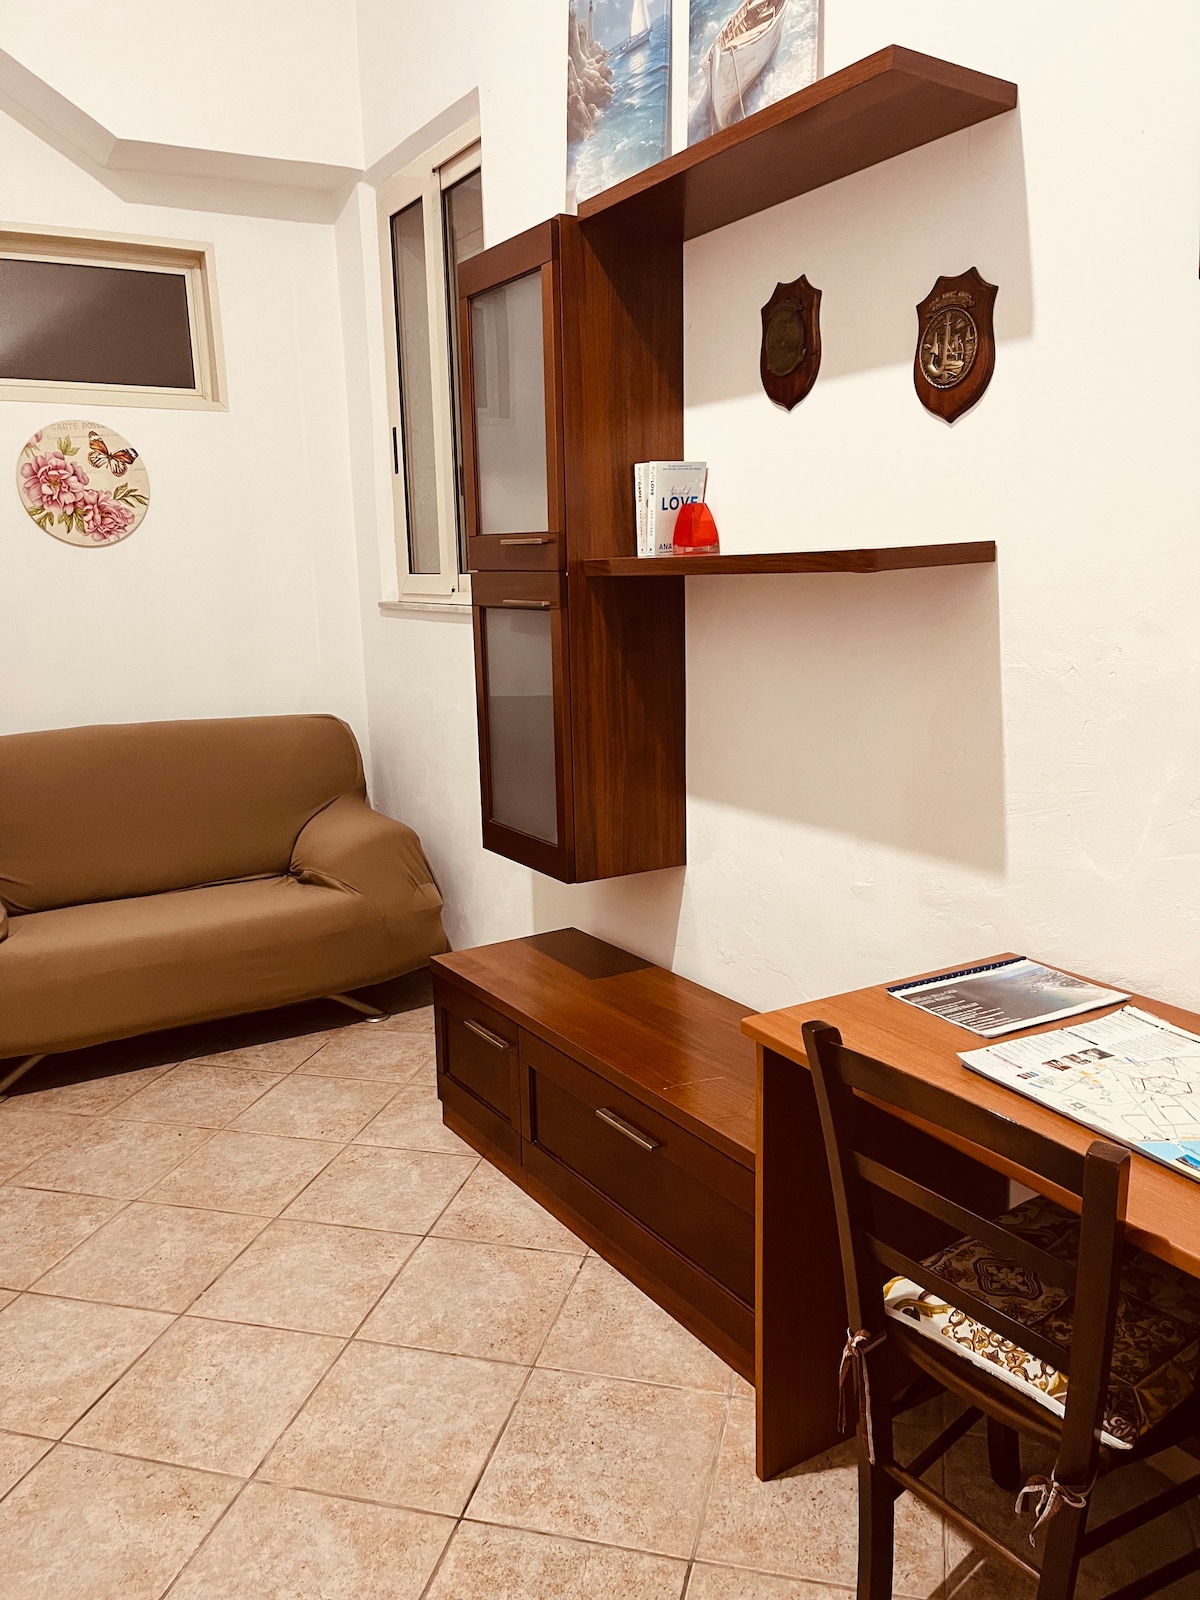
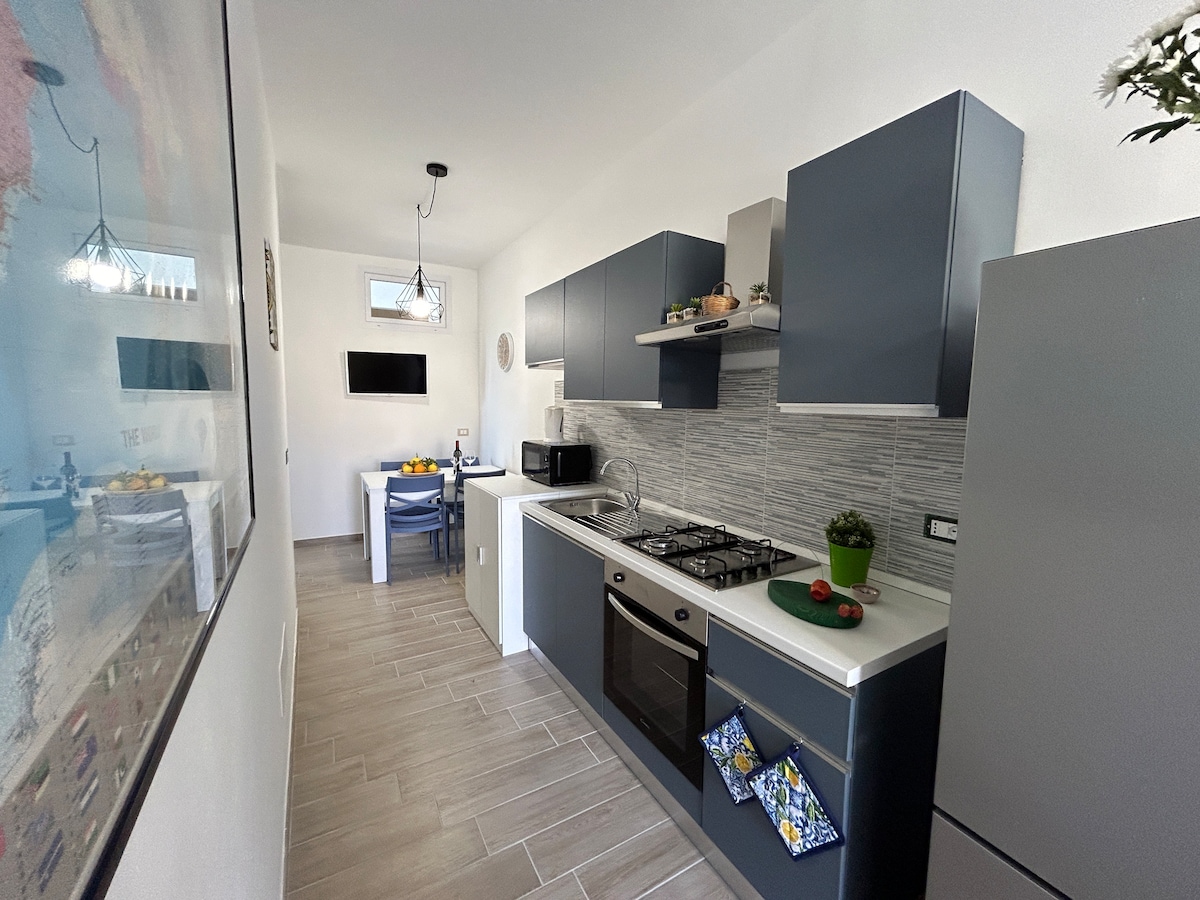
San Vito Lo Capo, with its Caribbean-like beach and the imposing Monte Monaco promontory, is a natural paradise in western Sicily famous for its turquoise waters and the Cous Cous Fest. It is a sunny and vibrant destination attracting international tourism seeking untouched sea, rock climbing, and relaxation in a unique landscape. The Airbnb market is very powerful here, featuring an occupancy rate of 62%. Visitors appreciate the convenience of apartments near the beach and the charm of holiday homes in lively neighborhoods, paying an average daily rate of €153. Its reputation as a Sicilian sea capital ensures high and consistent year-round profitability for property owners.
Featured Listings
Avola, the hexagonal city overlooking the Ionian Sea and world-famous for its Nero d'Avola wine, is a sunny destination merging Baroque charm with beautiful golden beaches. It is a strategic spot allowing visitors to enjoy crystal-clear waters and proximity to Noto and Siracusa, attracting international tourism seeking relaxation and authentic flavors. The Airbnb market is very active here, featuring an occupancy rate of 56%. Visitors appreciate modern apartments near the waterfront and the convenience of holiday homes in residential areas, paying an average daily rate of €176. Its blend of sea and gastronomy ensures consistent year-round profitability for property owners.
Featured Listings
Scicli, the Baroque pearl of the Val di Noto nestled in a scenic valley, is a UNESCO-listed golden stone jewel famous for its noble palaces and authentic Sicilian lifestyle. It is a destination of discreet charm made famous by ‘Inspector Montalbano’, attracting international tourism seeking culture, art, and crystal-clear waters just steps away. The Airbnb market is very solid here, featuring an occupancy rate of 57%. Visitors seek the charm of apartments in historic city-center palaces and the exclusivity of residences in the karst ‘cave’ formations, paying an average daily rate of €195. Its timeless beauty ensures consistent year-round profitability for owners.
Featured Listings
Get Live Sicilia, Italy Market Intelligence
Discover detailed Sicilia, Italy Airbnb Analytics and explore real-time market data to make accurate investment decisions.
Explore Real-time Analytics