Best Airbnb Markets in Trentino Alto Adige, Italy
The Trentino Alto Adige, Italy short-term rental market offers diverse opportunities for investors who know where to look. By analyzing the top 10 performing markets, we’ve highlighted the towns that currently lead the way in occupancy and revenue.
Remember that the figures shown here are regional averages and should be used as a guide for further investigation. To access precise performance data, custom reports, and professional-grade analytics, head over to GuestFavorites.
Trentino Alto Adige Airbnb Market Map (June 2026)
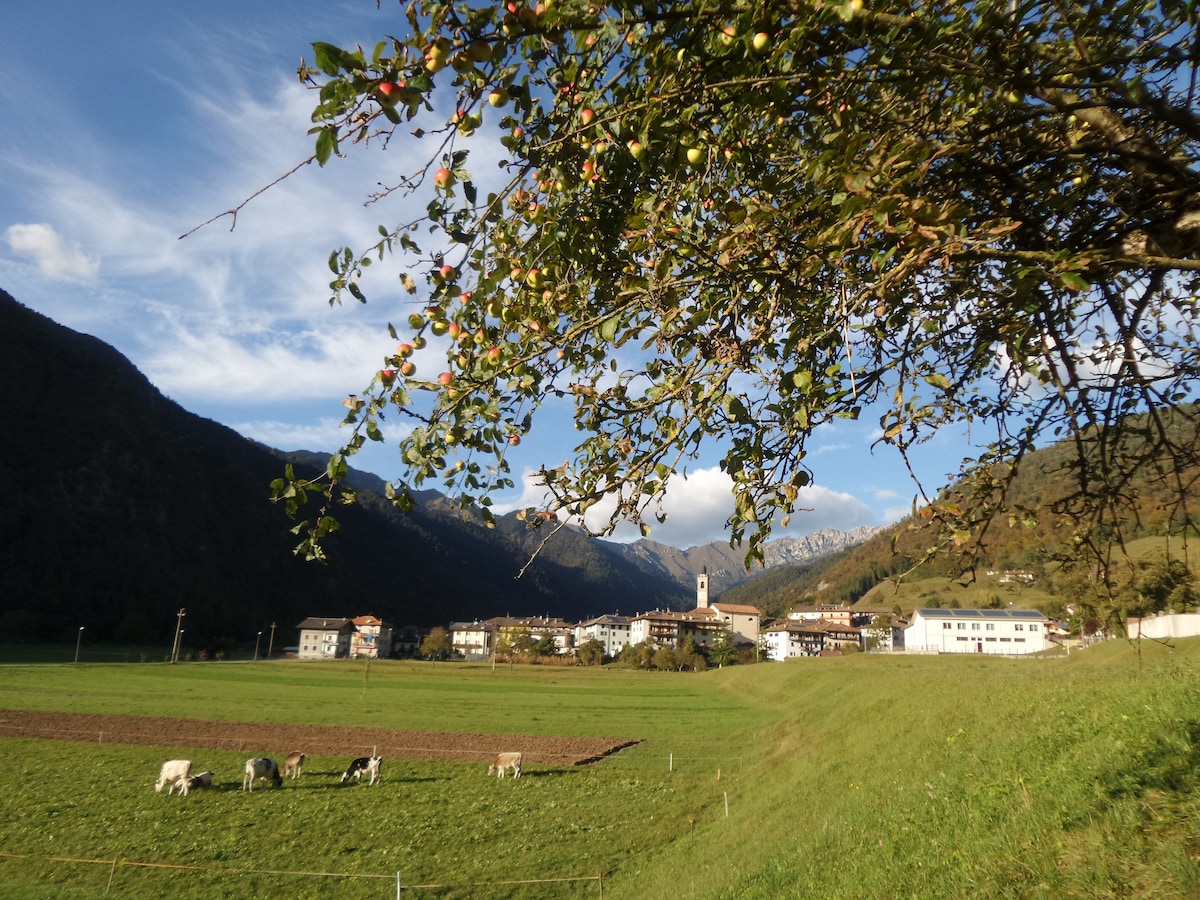
Riva del Garda is the jewel of Lake Garda’s northern tip, where the water meets majestic rock faces in a fairytale landscape. It is a global capital for sailing and mountain biking, attracting a young and active international crowd. The Airbnb market is very active here, featuring an occupancy rate of 55%. Visitors appreciate elegant apartments in the historic center and modern holiday homes with storage for sports equipment, paying an average daily rate of €168. Its energy and mild climate make it a profitable and steadily growing destination for property owners.
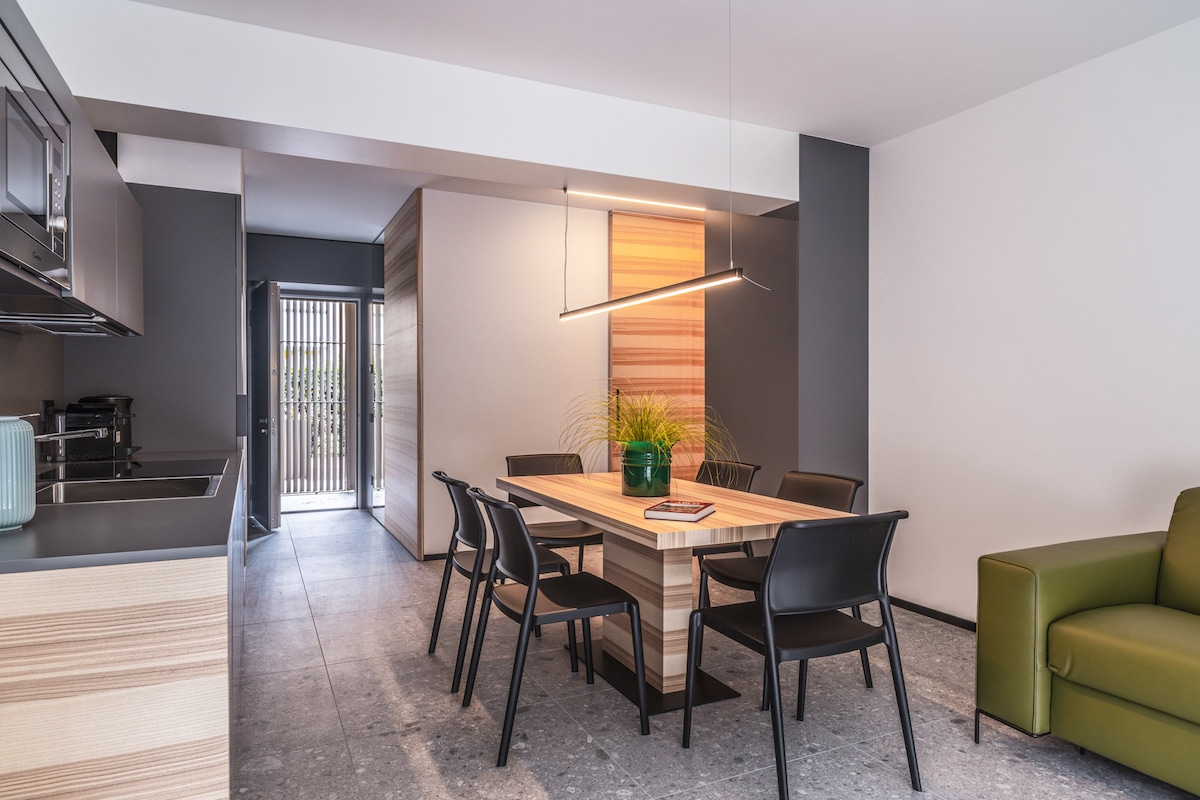
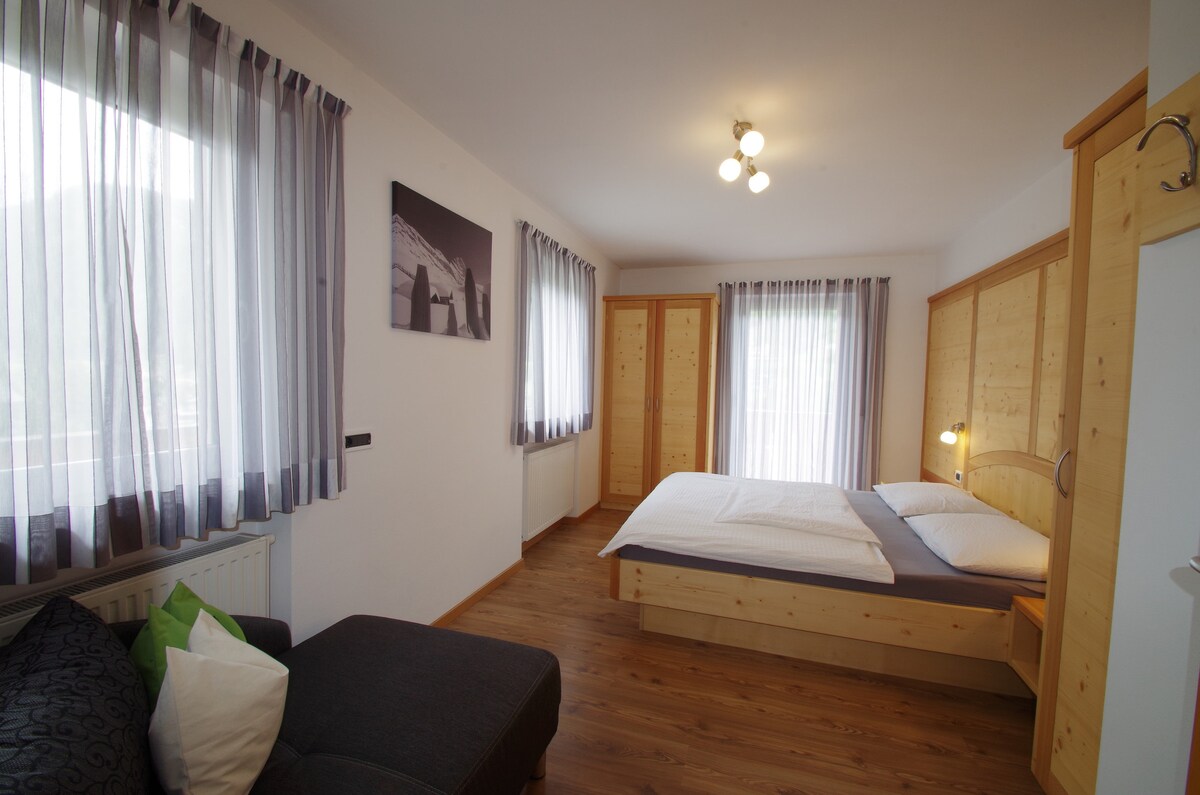
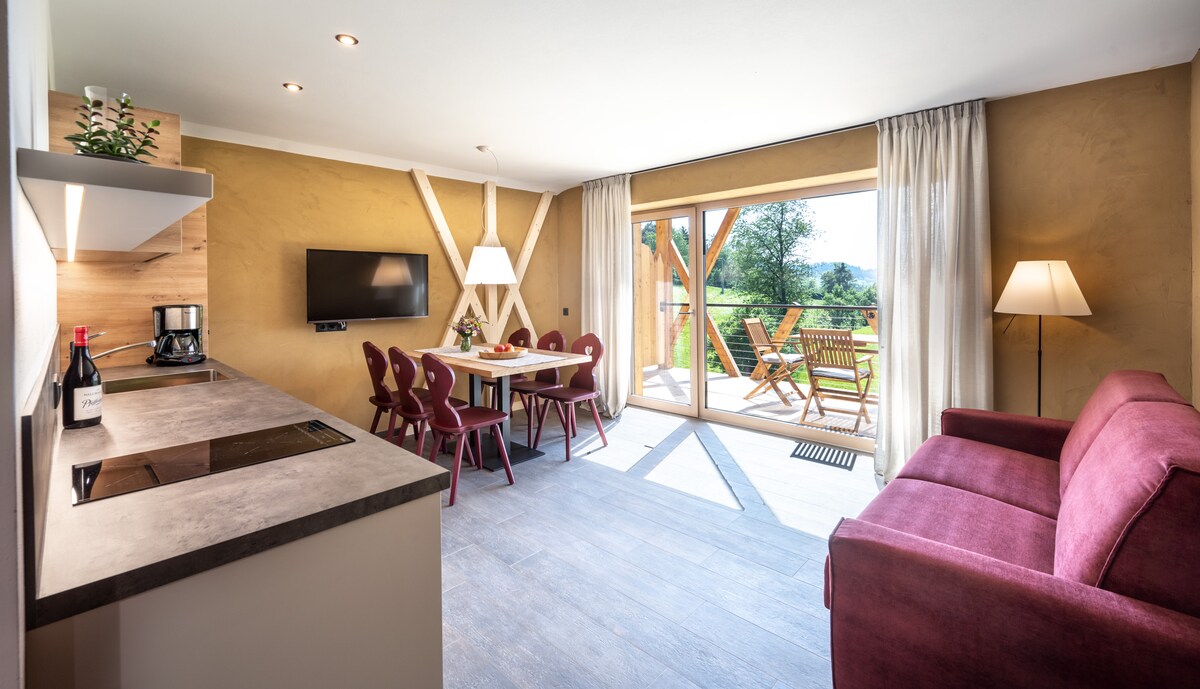
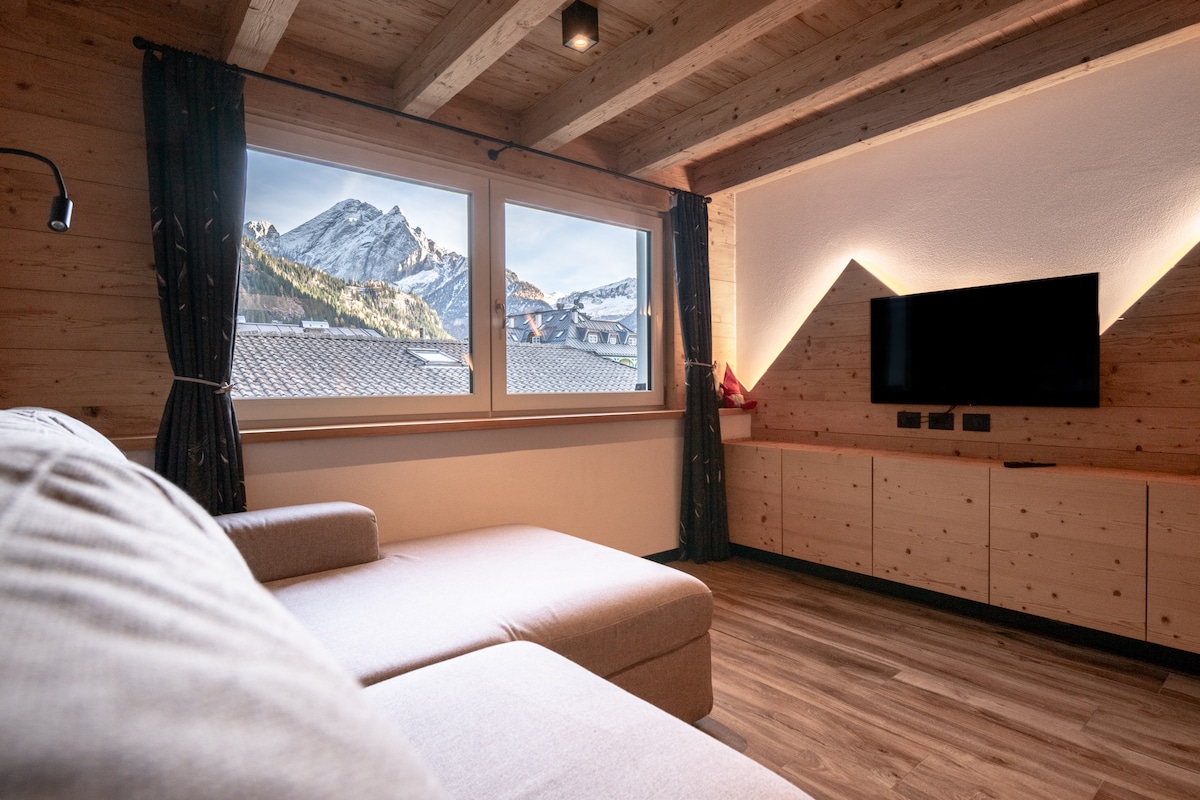
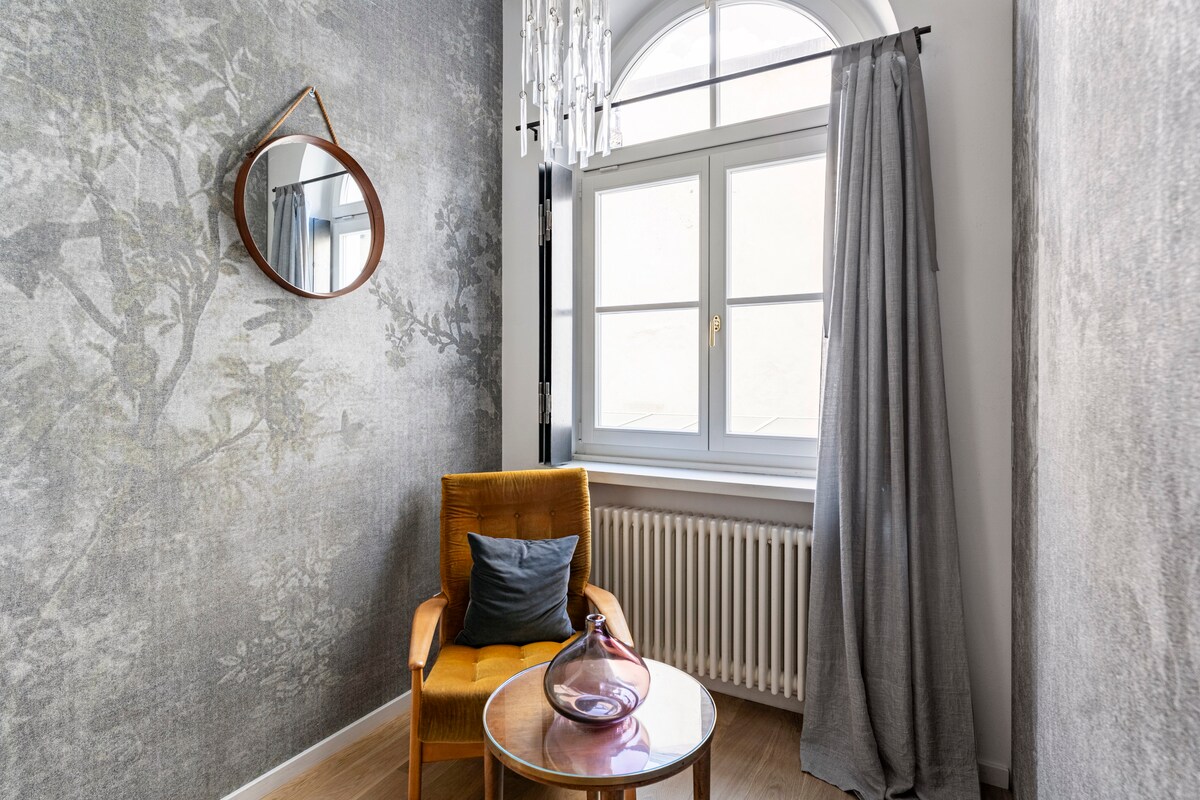
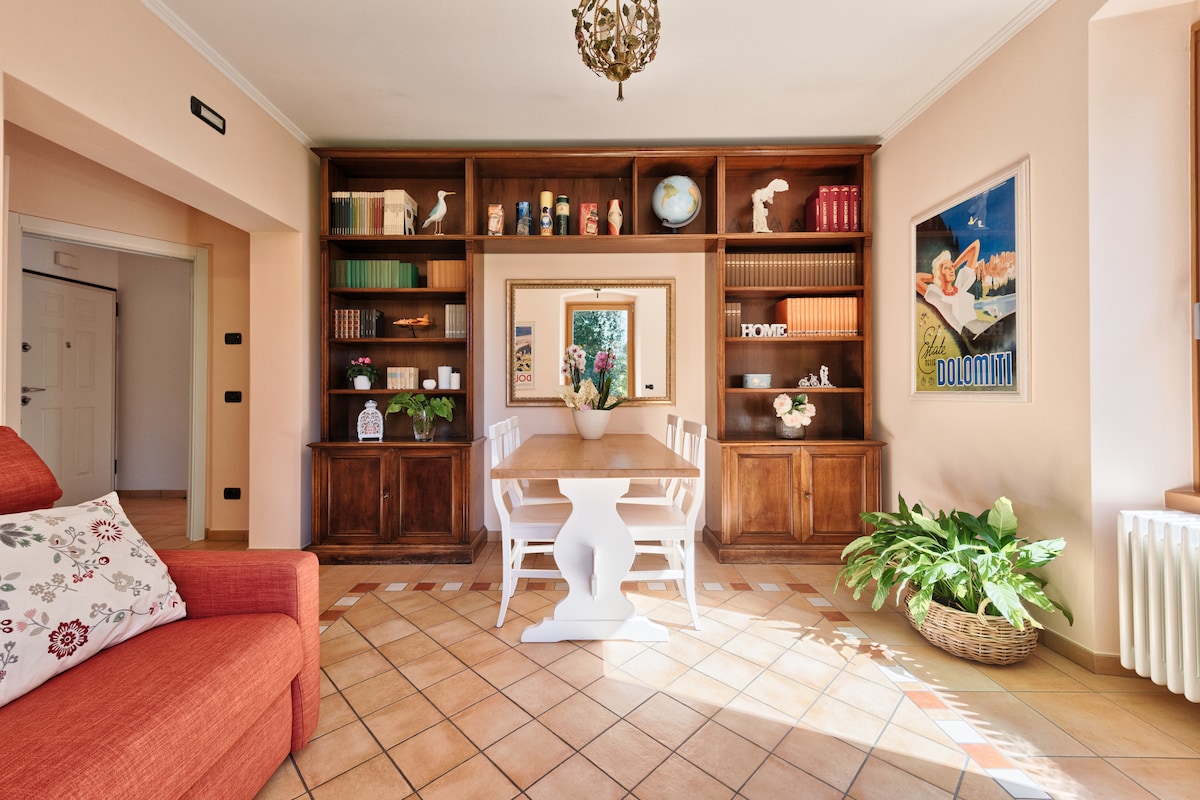
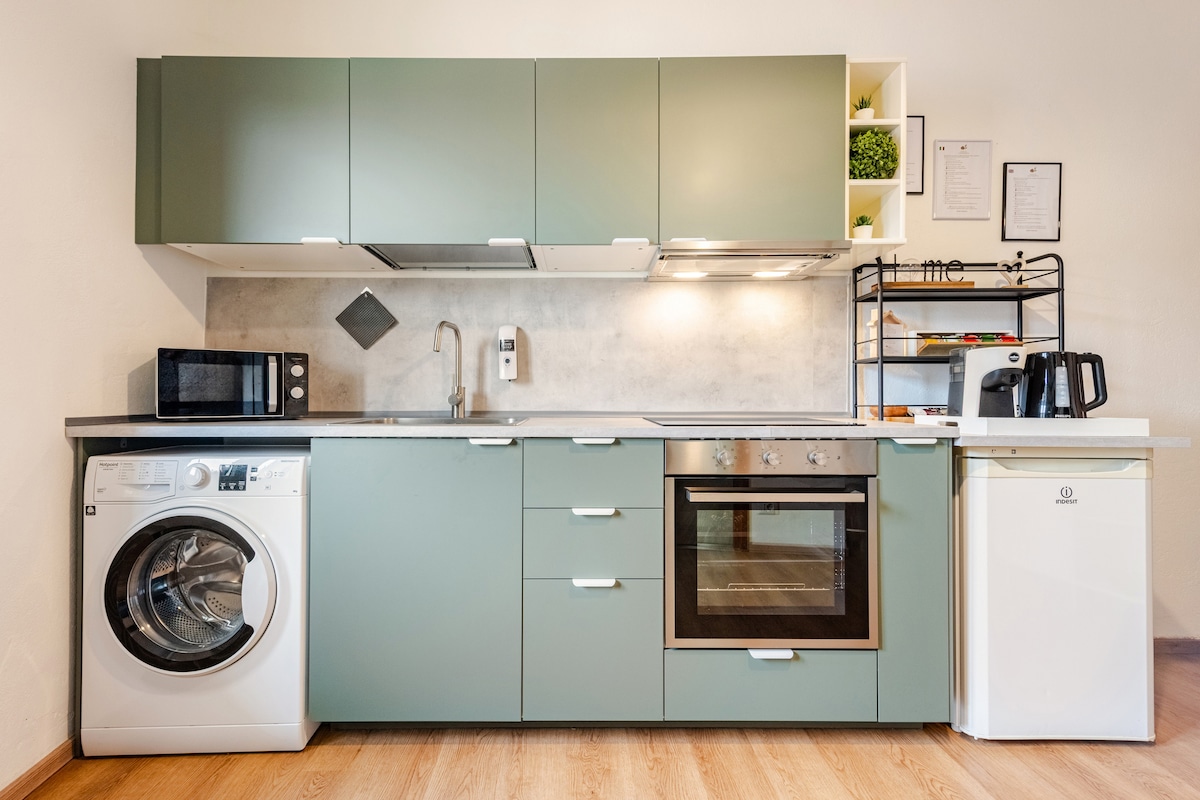
Featured Listings

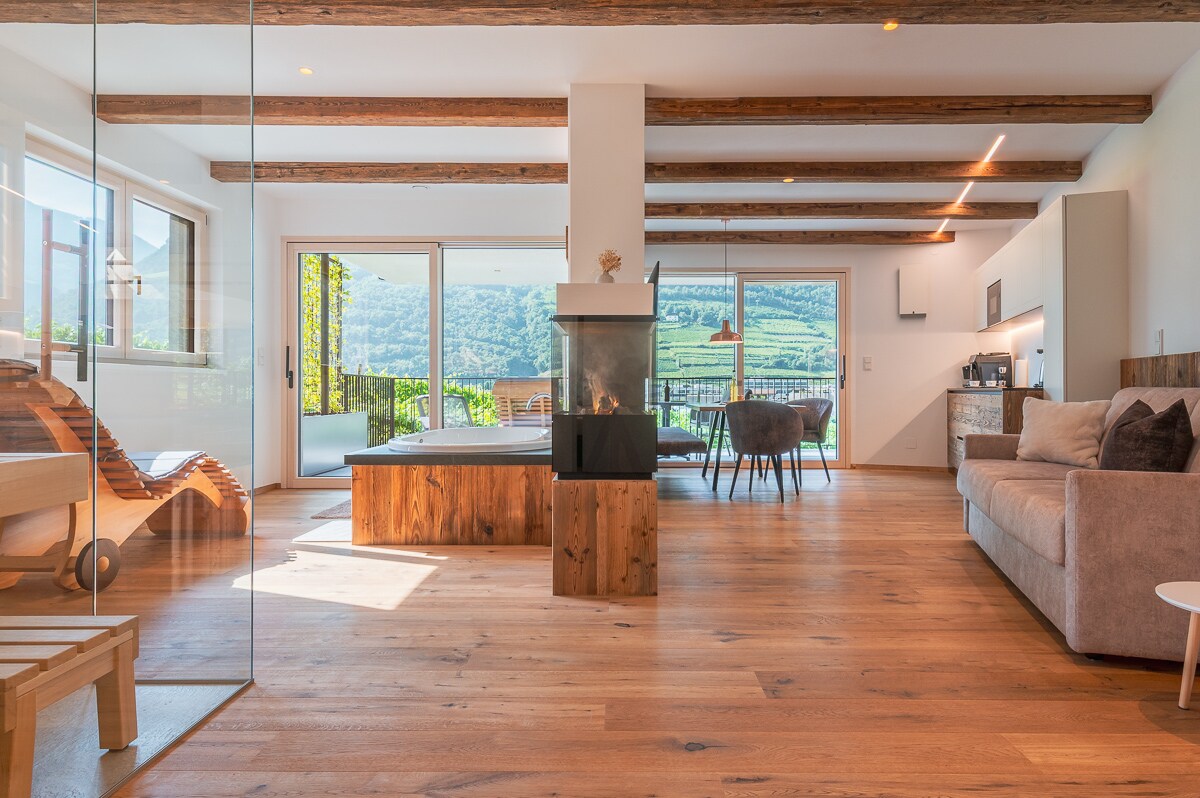
Ortisei, the beating heart of Val Gardena, is one of the world’s most prestigious alpine resorts, famous for its wood carving and direct access to the Sellaronda ski circuit. It is a luxury market experiencing exceptional seasons in both winter for skiing and summer for hiking in the UNESCO Dolomites. The rental market is extraordinarily profitable here, featuring an average daily rate of €327. Visitors seek exclusive designer chalets and the warmth of Tyrolean-style apartments in the vibrant pedestrian center, generating an annual revenue of €74,196. Its reputation for excellence ensures high-level demand.
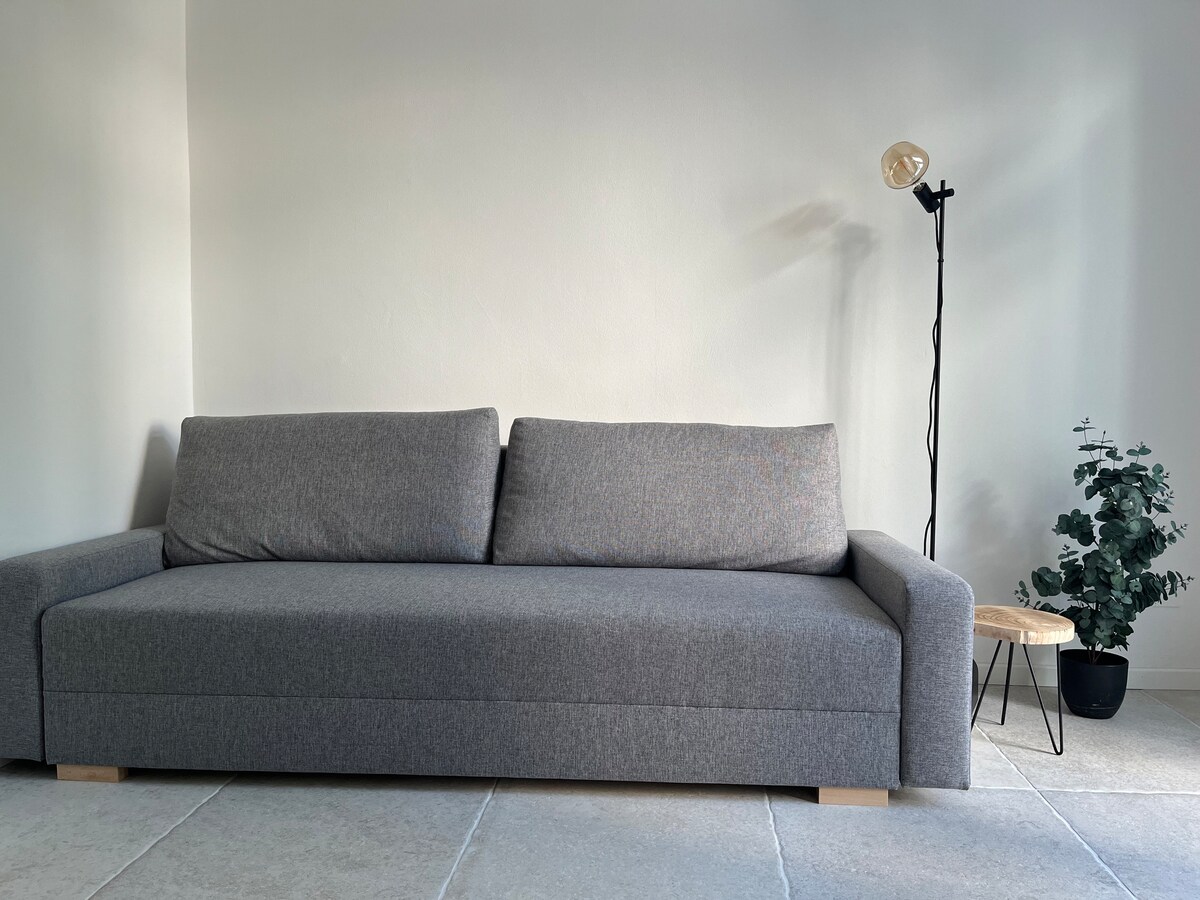
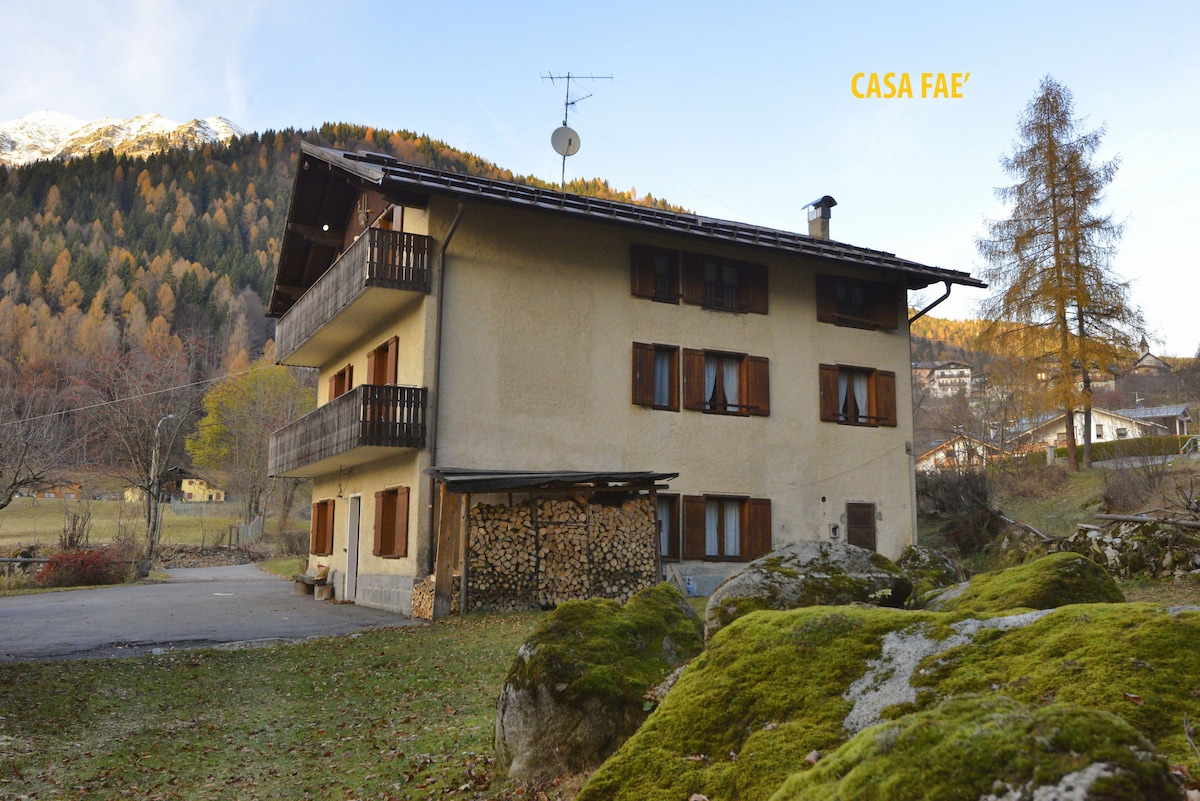
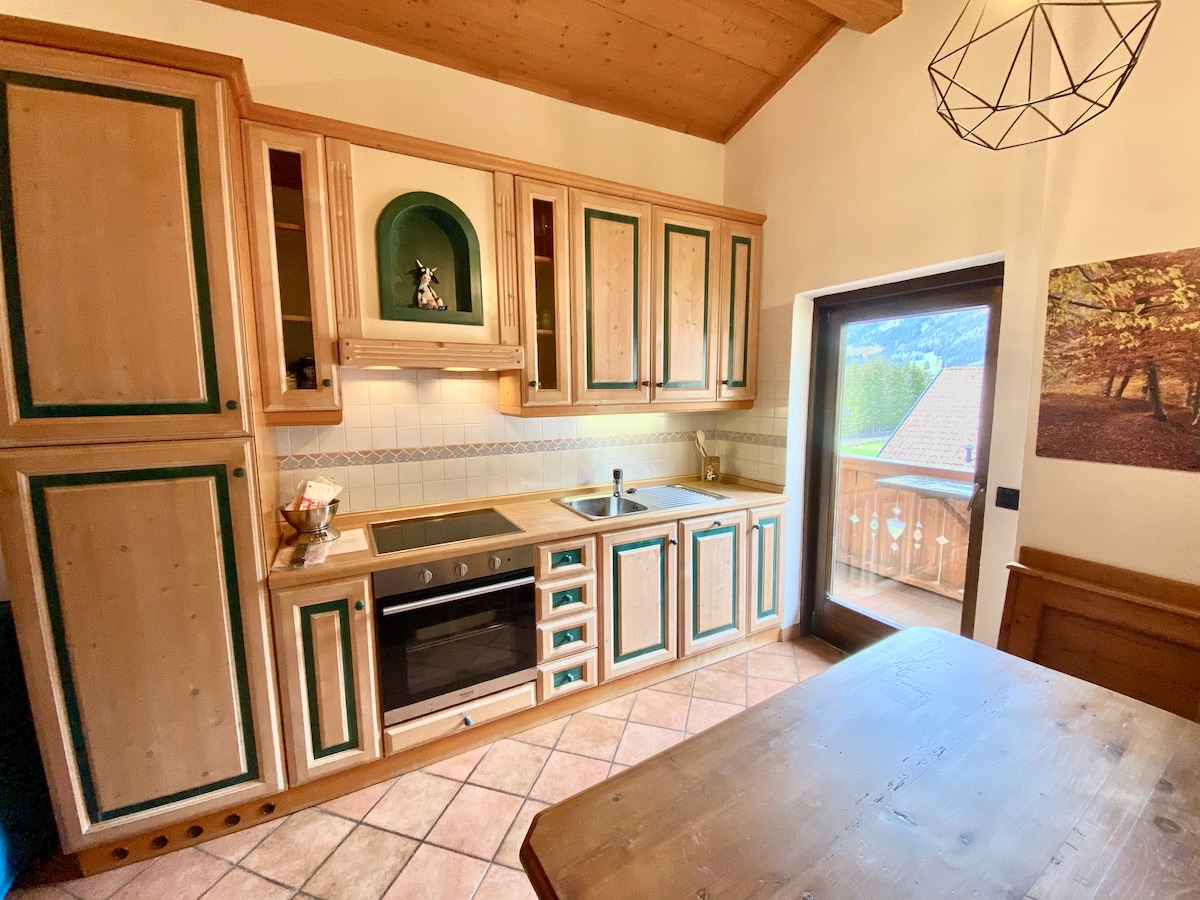
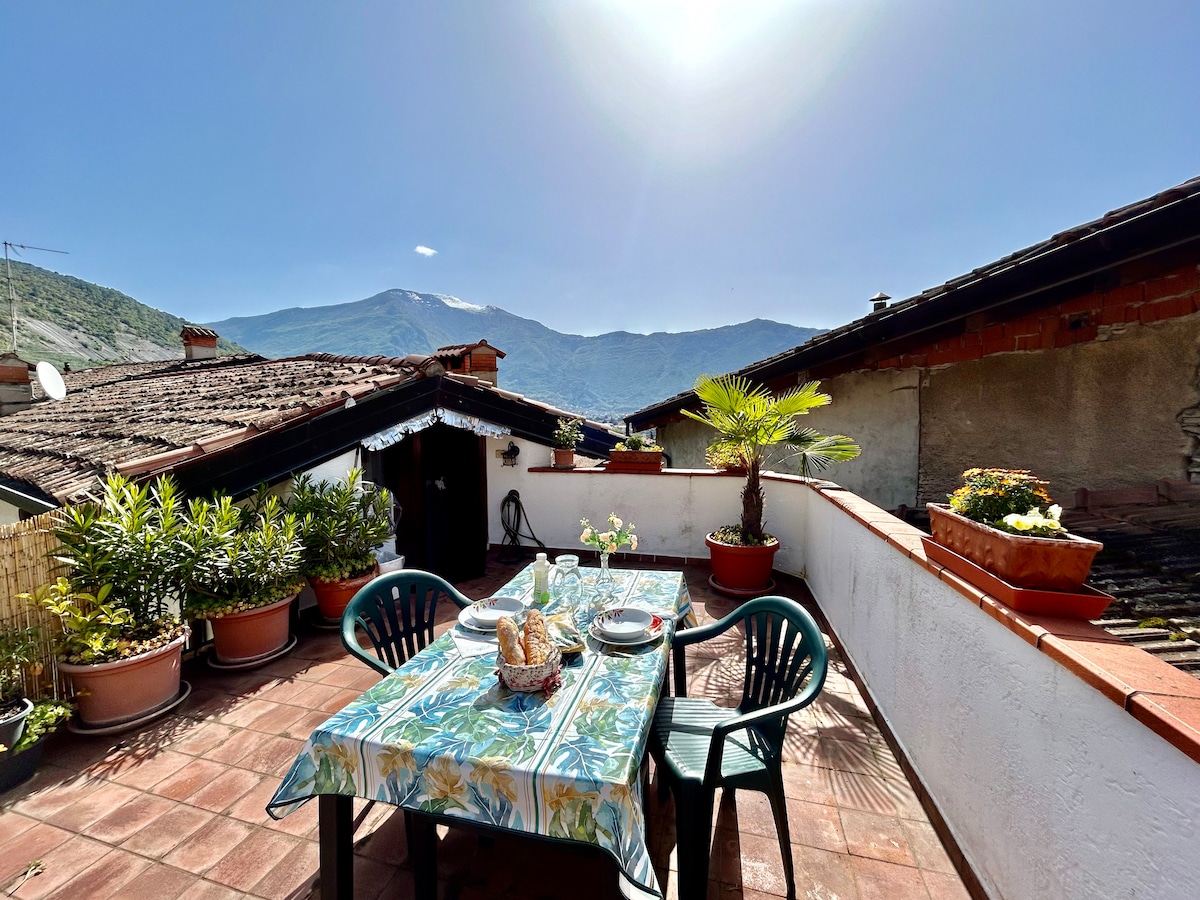
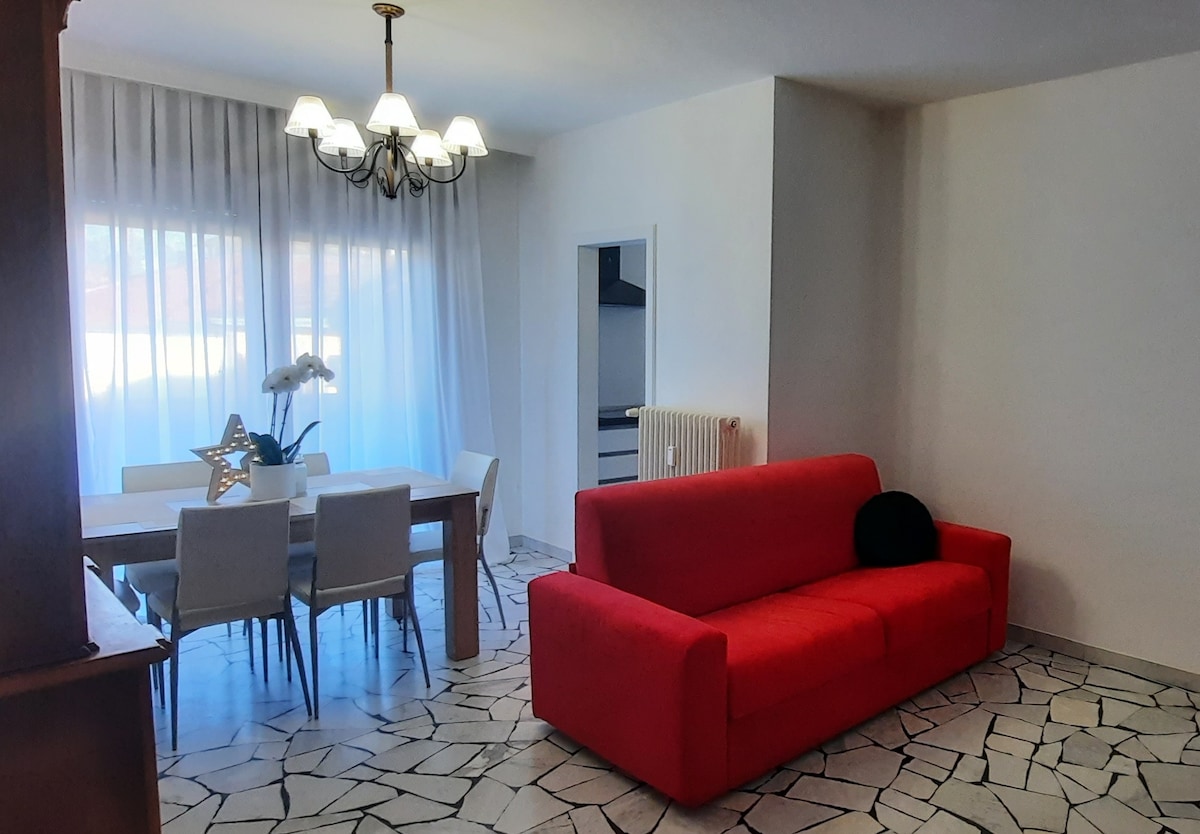
Featured Listings
Merano, the elegant spa city of South Tyrol, enchants with its Mediterranean climate at the foot of the Alps, its medieval porticoes, and the famous Trauttmansdorff Castle Gardens. It is a refined destination attracting international tourism seeking wellness, culture, and alpine landscapes. The Airbnb market is very solid here, featuring an occupancy rate of 58%. Visitors seek the charm of Art Nouveau apartments and modern city-center lofts, paying an average daily rate of €178. Its appeal linked to wellness and Christmas markets ensures steady demand and high profitability year-round.
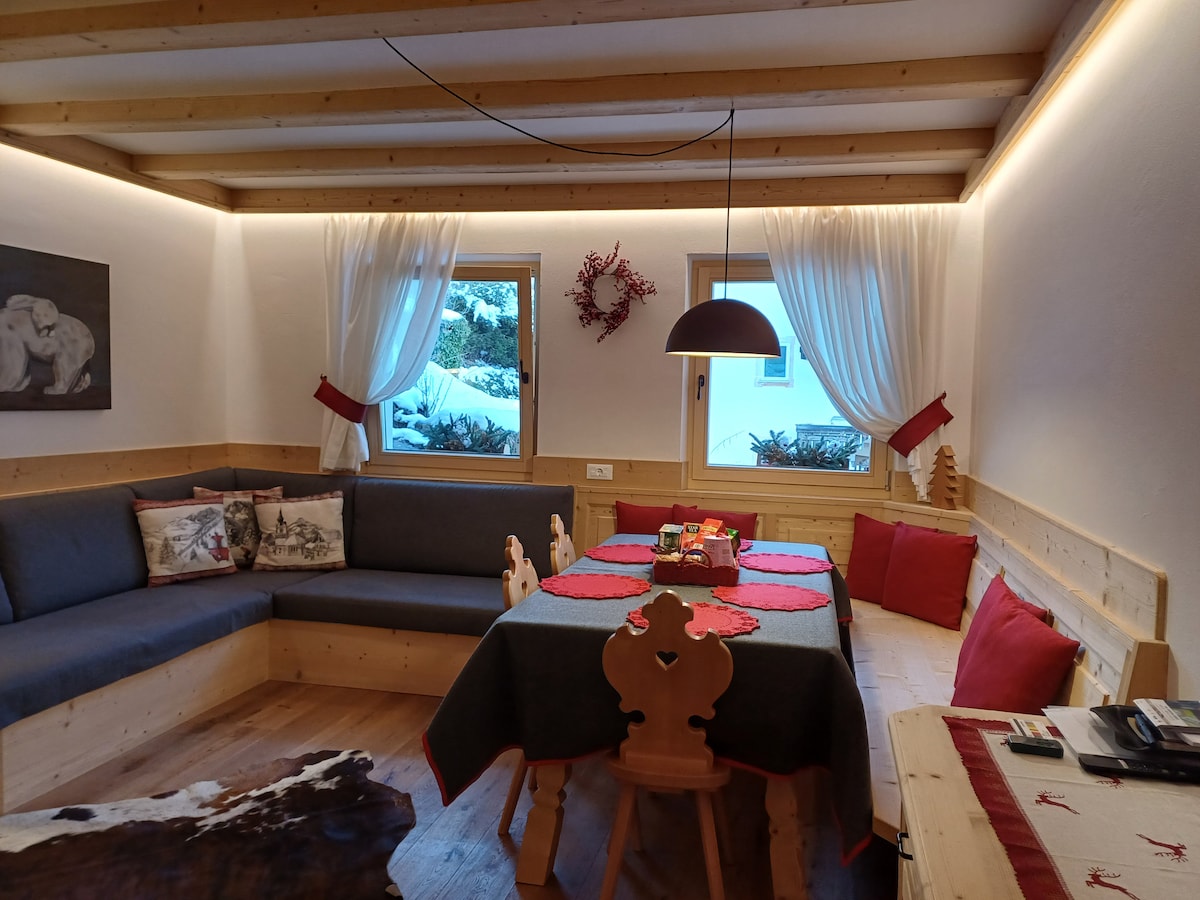
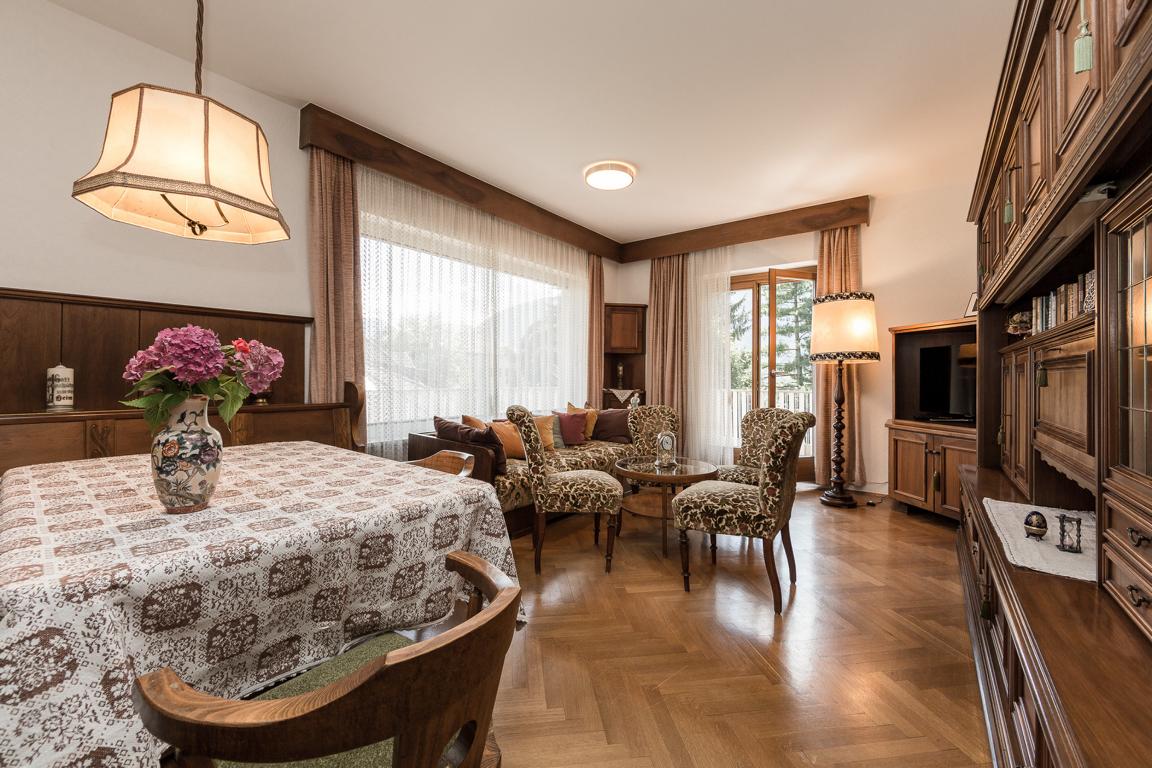
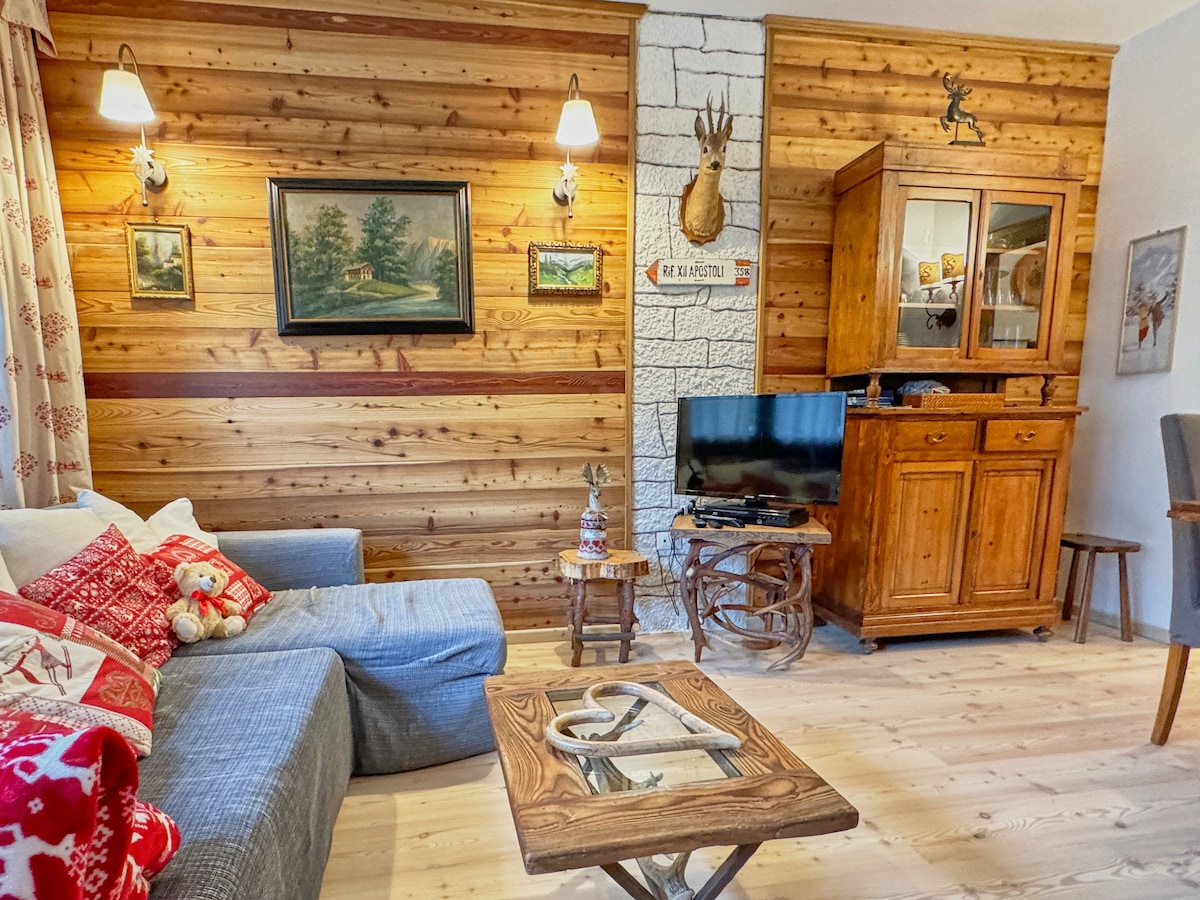
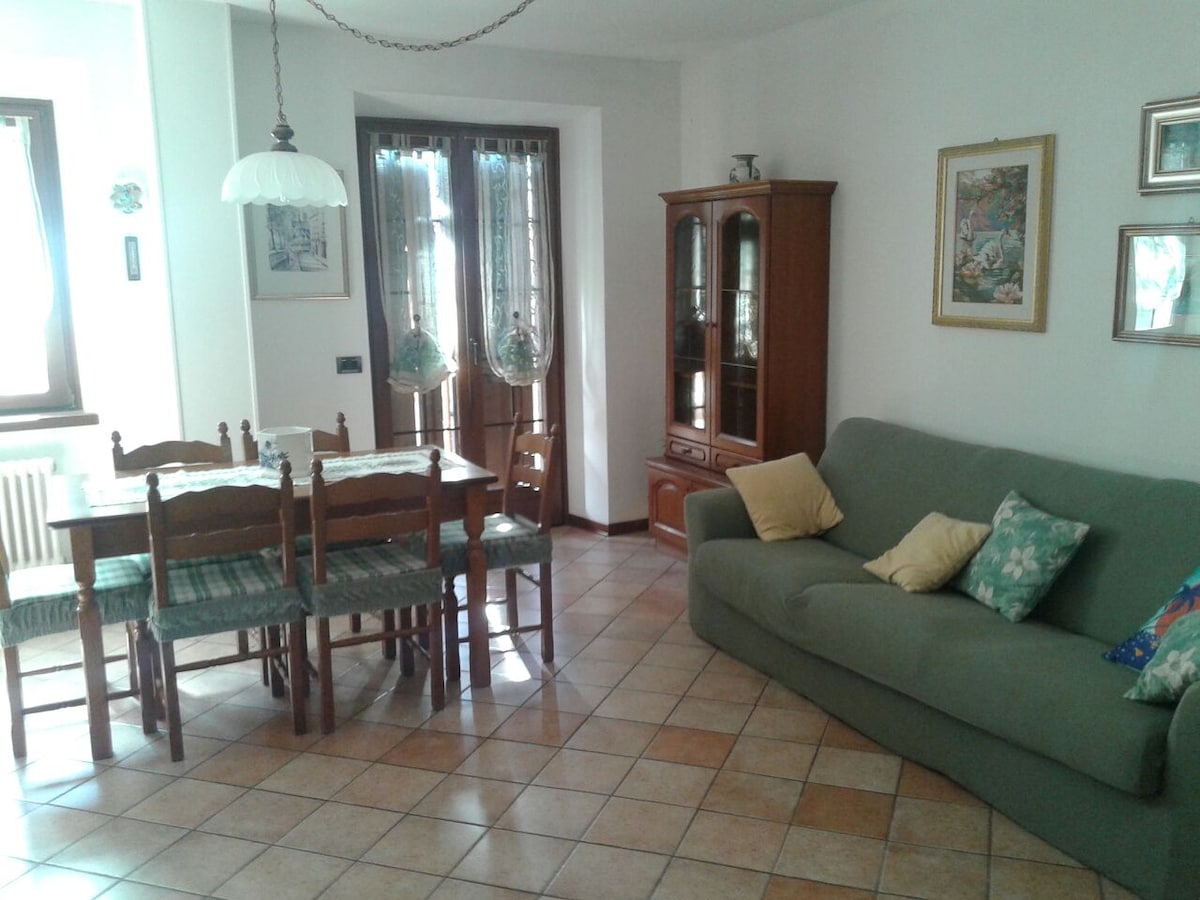
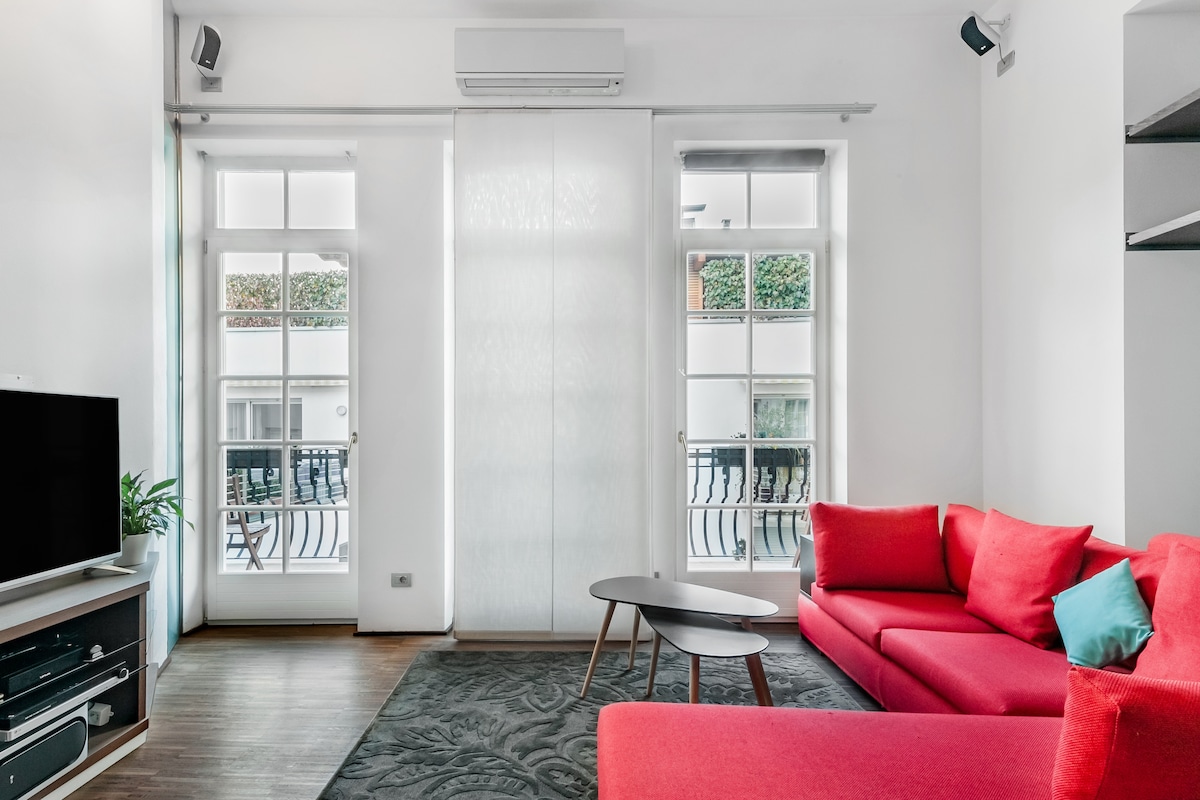
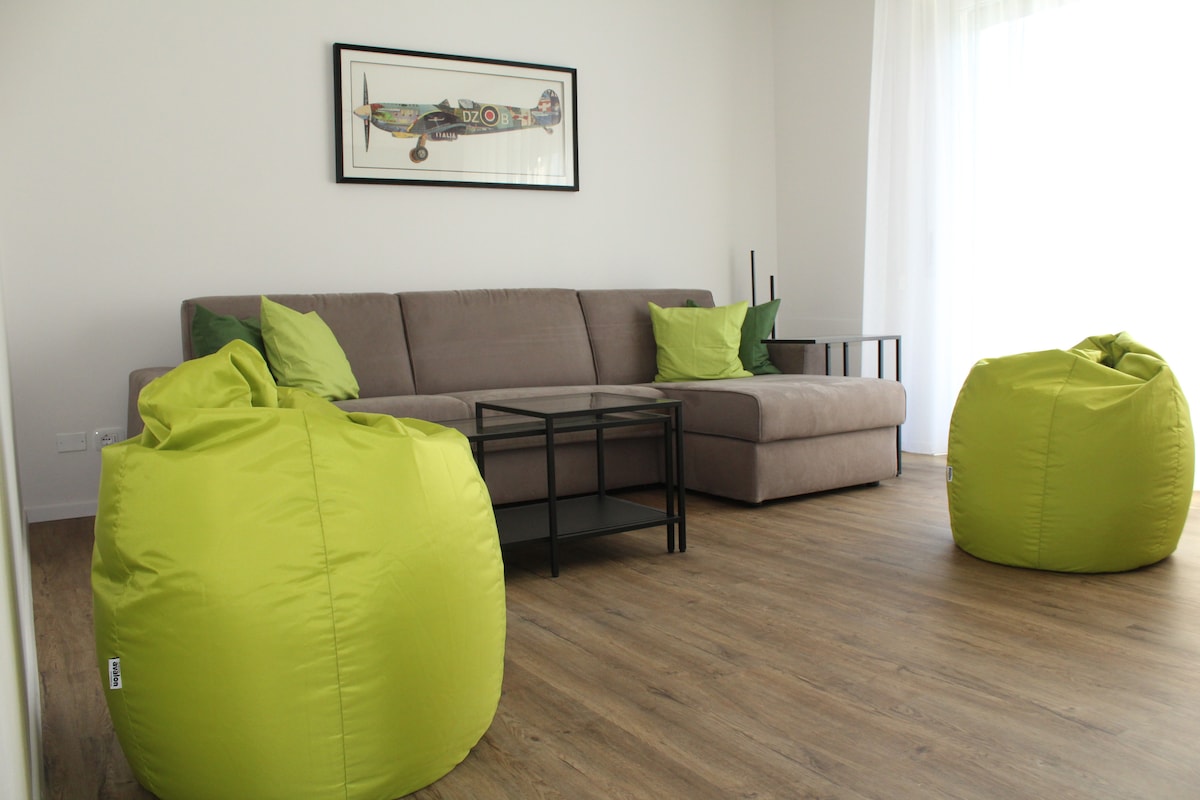
Featured Listings


Castelrotto is the main village of the Alpe di Siusi, Europe’s largest high-altitude meadow, famous for its Baroque bell tower and vibrant South Tyrolean farming traditions. It is a fairytale destination attracting tourists seeking breathtaking Dolomite panoramas and absolute peace. The Airbnb market is very solid here, featuring an occupancy rate of 57%. Visitors seek the charm of apartments in traditional farmsteads and modern rentals near the lifts to the Alpe, paying an average daily rate of €213. Its reputation as a natural paradise ensures steady demand and secure profitability.
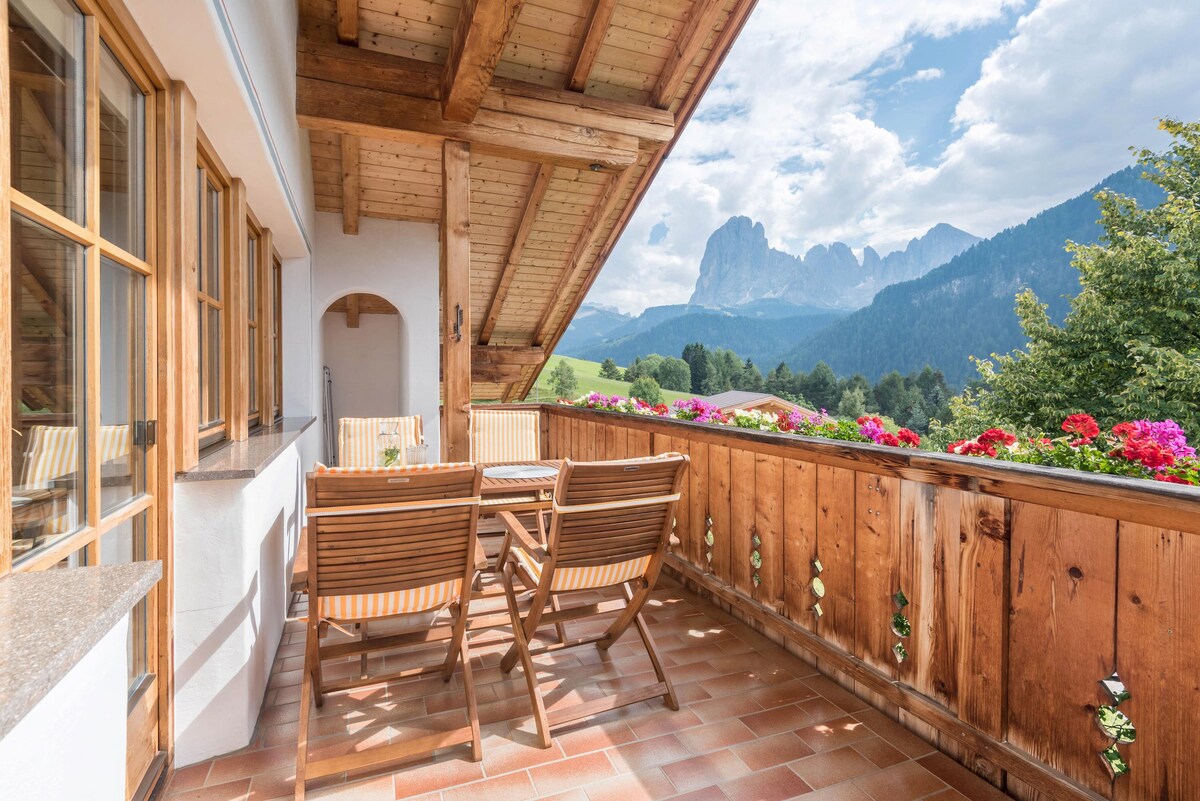
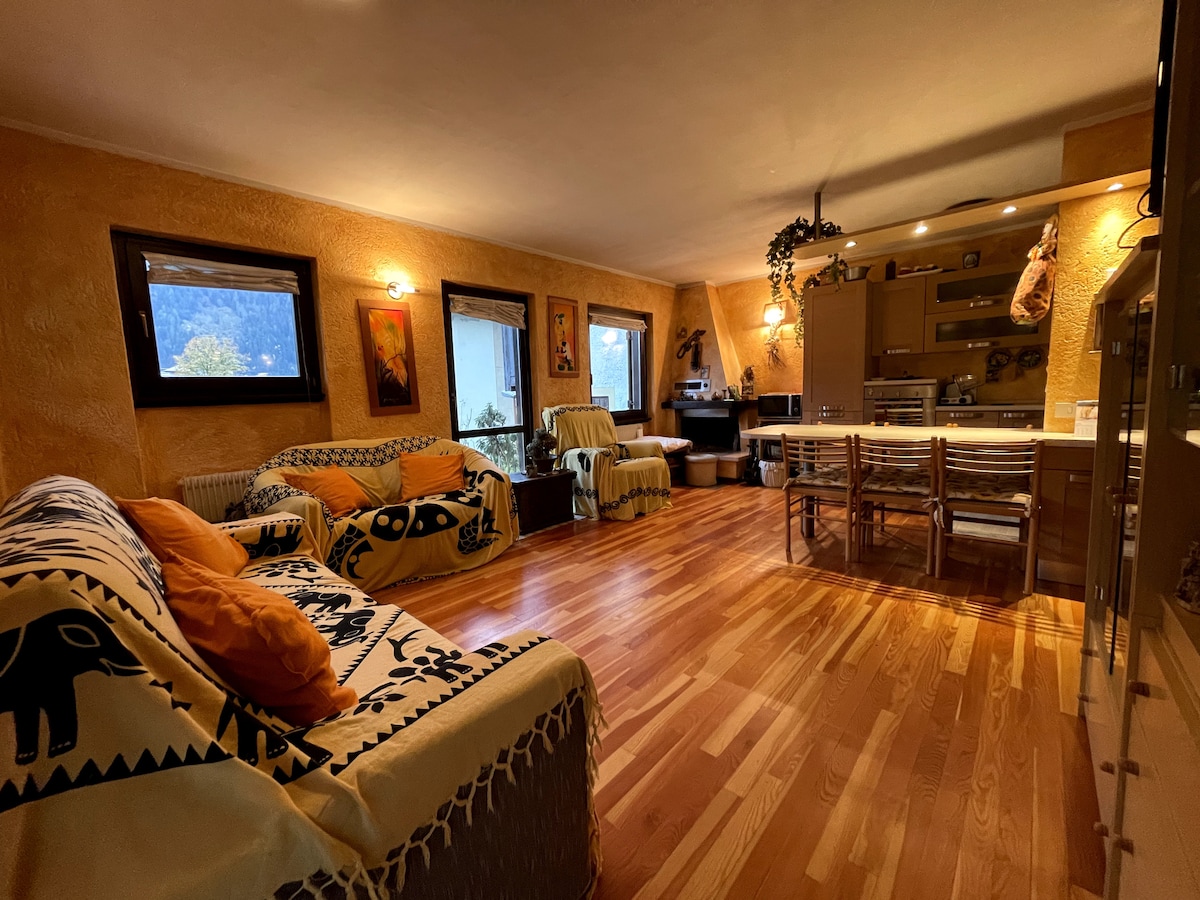
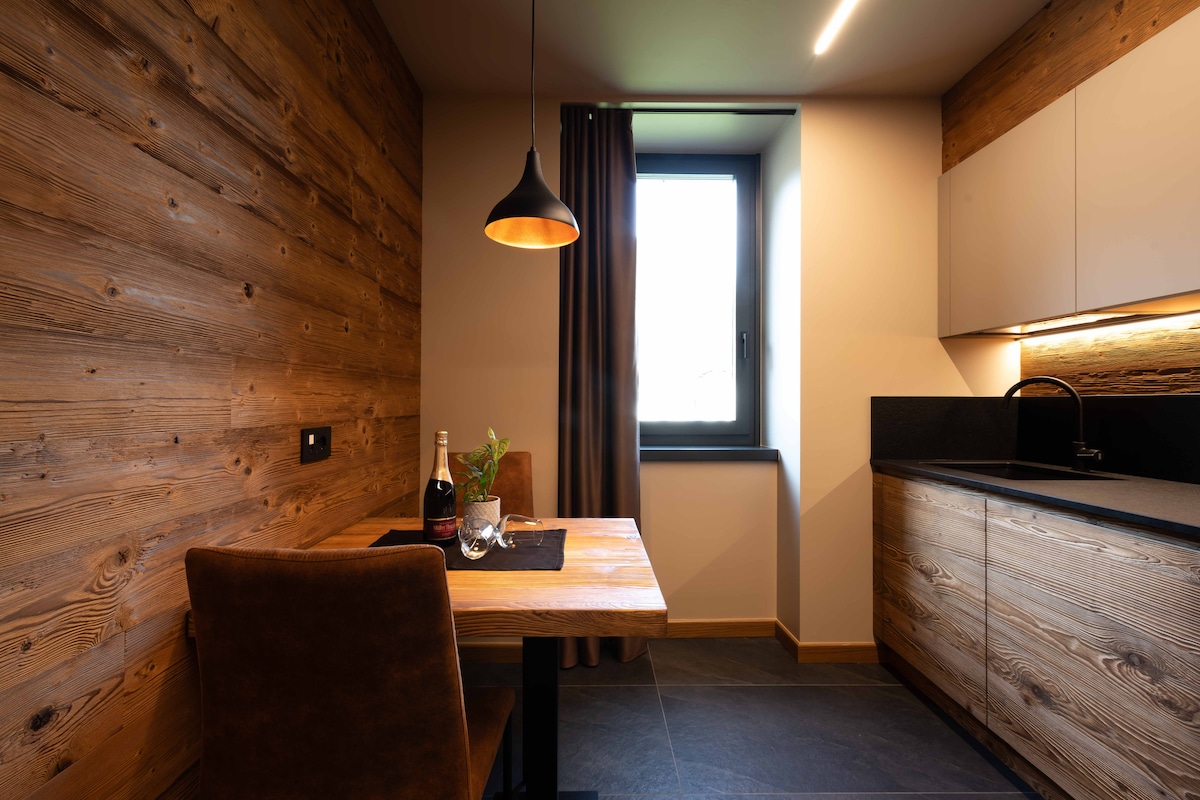
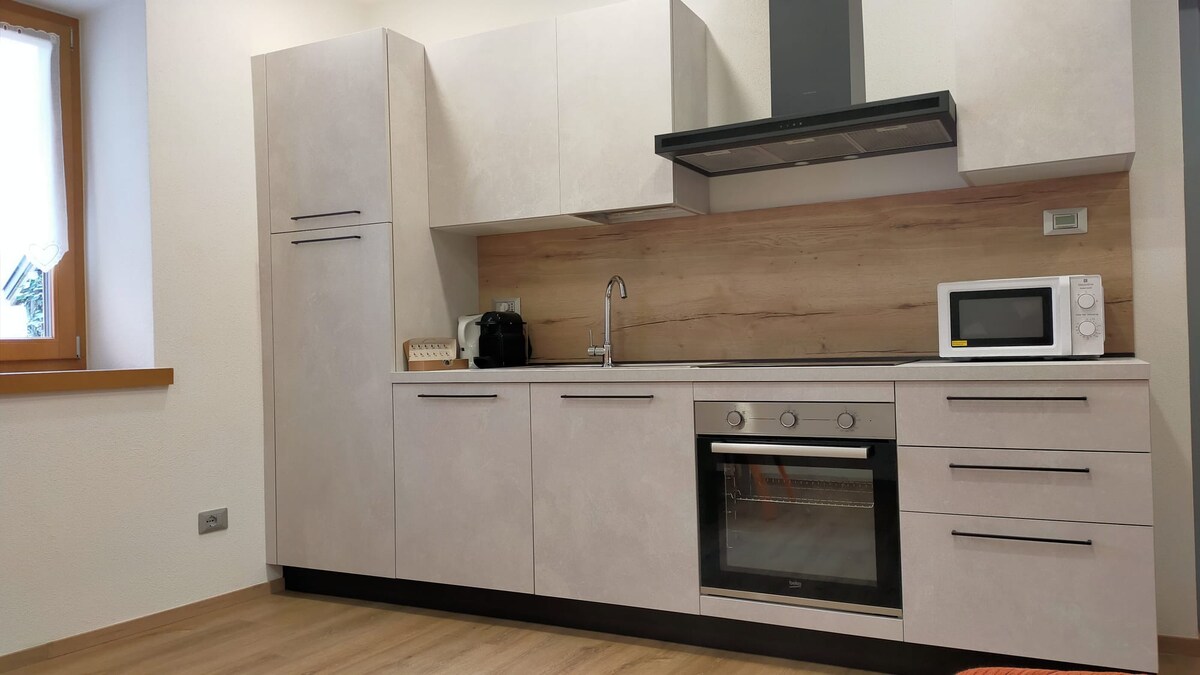
Featured Listings
Pinzolo, nestled between the Brenta Dolomites and the Adamello glaciers, is an authentic and classy alpine destination directly connected to the Madonna di Campiglio ski area. It is a dynamic market attracting families and athletes seeking a well-rounded and less glitzy mountain holiday. The Airbnb market is solid here, featuring an average daily rate of €226. Visitors appreciate cozy village apartments and modern holiday homes near the Doss del Sabion lift, generating an annual revenue of €46,771. Its strategic location and natural charm ensure steady rental demand.
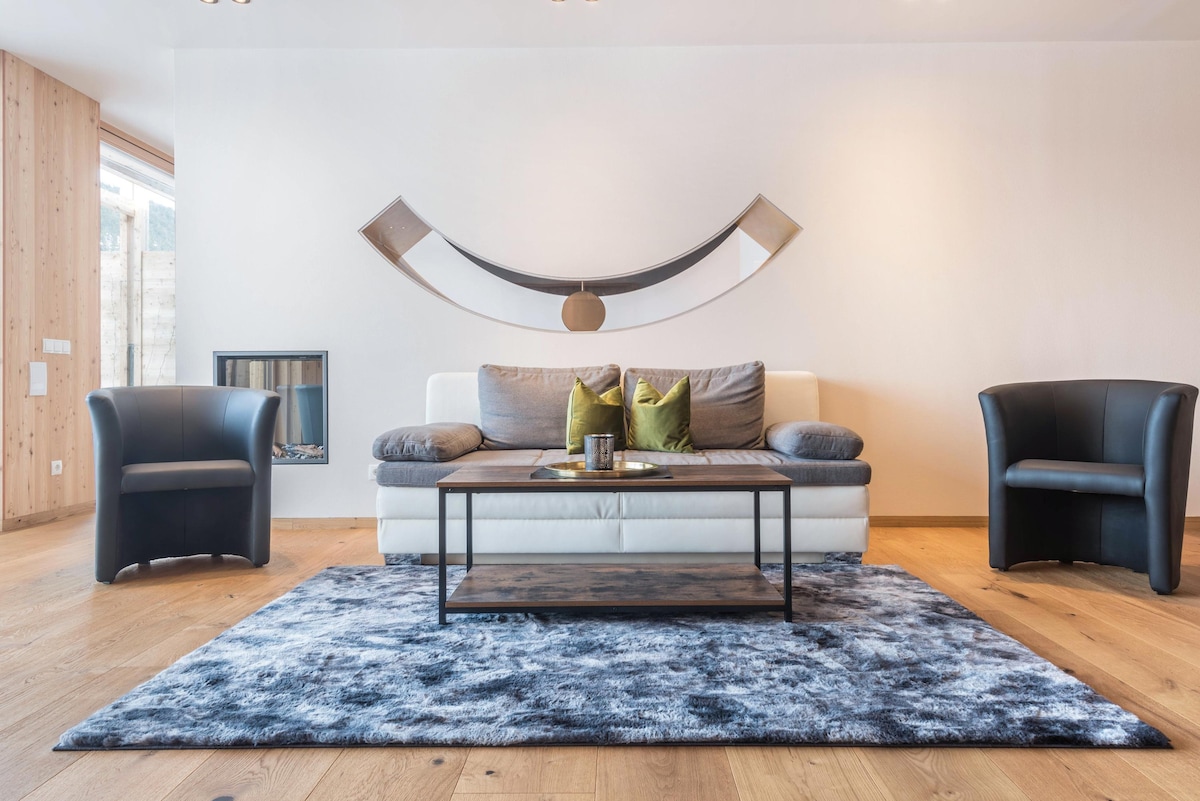
Featured Listings
Canazei is the undisputed ski capital of the Dolomites, strategically located at the heart of the Sellaronda and surrounded by massive peaks like Pordoi and Marmolada. It is a cult destination for snow sports and mountaineering, attracting international tourism year-round. The rental market is very active here, featuring an occupancy rate of 65%. Visitors seek the warmth of Ladin chalets and the functionality of slope-side apartments, paying an average daily rate of €202. Its world-class reputation linked to sports and landscape ensures relentless demand and high profitability.
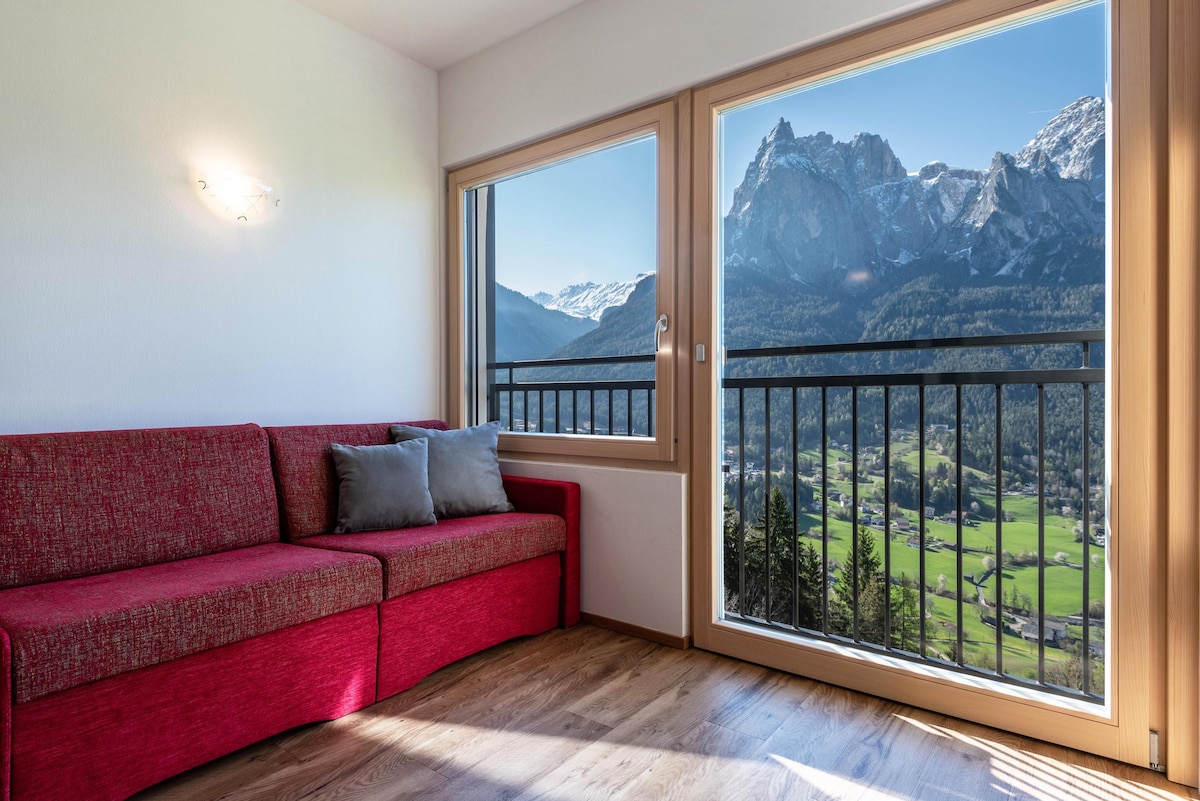
Featured Listings

Ledro, with its emerald lake famous for its UNESCO-listed stilt-house village, is an oasis of peace and untouched nature just a few miles from Lake Garda. It is an ideal destination for slow and active tourism, attracting lovers of relaxation and outdoor living. The rental market is solid here, featuring an occupancy rate of 56%. Visitors appreciate holiday homes nestled in greenery and apartments overlooking the crystal-clear waters, generating an annual revenue of €28,605. Its serene atmosphere and breathtaking alpine landscapes make it a beloved choice for family getaways.
Featured Listings
Bolzano, the gateway to the Dolomites where Italian and German cultures meet, is a vibrant and cosmopolitan city famous for the Ötzi Museum and its enchanting Christmas markets. It is a major economic and tourist hub offering a unique blend of urban elegance and alpine nature. The Airbnb market is very solid here, featuring an occupancy rate of 65%. Visitors seek the charm of apartments in historic buildings and the convenience of rentals near the station and cable cars, paying an average daily rate of €167. Its reputation as an alpine capital ensures steady demand and consistent profitability.
Featured Listings
Arco, located just inland from Lake Garda beneath an imposing medieval castle, is the global capital of sport climbing and an outdoor paradise. It attracts a young and dynamic international crowd seeking sports, nature, and a relaxed atmosphere just minutes from the lake. The Airbnb market is solid here, featuring an occupancy rate of 55%. Visitors appreciate apartments with balconies and modern holiday homes with gear storage, generating an annual revenue of €25,132. Its mild microclimate and constant sporting offer ensure stable profitability for owners.
Featured Listings
Trento, the historic city of the Council nestled in the Adige Valley, is a Renaissance architectural jewel offering exceptional quality of life and cultural energy. Between the MUSE science museum and its frescoed squares, it attracts sophisticated tourists and a strong professional clientele. The Airbnb market is very efficient here, featuring an occupancy rate of 57%. Visitors appreciate elegant city-center apartments and well-connected modern rentals, generating an annual revenue of €25,477. Its academic and economic dynamism ensure consistent year-round profitability for property owners.
Featured Listings
Get Live Trentino Alto Adige, Italy Market Intelligence
Discover detailed Trentino Alto Adige, Italy Airbnb Analytics and explore real-time market data to make accurate investment decisions.
Explore Real-time Analytics