Airbnb Market Data in Victoria, Australia(July 2026)Occupancy, Revenue & Best Areas
Is Victoria still a core Australian STR market in July 2026? The state splits cleanly between CBD apartment weeks in Melbourne, bay-side suburbs like St Kilda, and peninsula or surf-coast escapes from Mornington to Geelong.
State-wide averages sit at A$58,518 annual revenue per listing, 53% occupancy, and A$304 ADR across 32,402 active listings — but Melbourne’s event calendar and Bass Coast school holidays pull in opposite directions.
Underwrite the suburb or shire first; Victoria’s headline metrics hide a wide gap between laneway flats and Phillip Island family houses.
Victoria Airbnb Market Map (July 2026)
Victoria Market Performance
Period: July 2025 - June 2026
How Much Can You Earn with Airbnb in Victoria?
One of the most common questions for potential Airbnb hosts in Victoria is about earning potential. Let's break down the revenue patterns and what you can realistically expect to earn.
Monthly Revenue Trends in Victoria
Is Airbnb a Good Investment in Victoria?
YES — Victoria rewards hosts who match property type to guest intent: CBD events and business travel in inner Melbourne, beach houses on the Mornington Peninsula, and surf-weekend stock on the Surf Coast.
| Market | Avg revenue | Occupancy | Role |
|---|---|---|---|
| Victoria | A$58,518 | 53% | State baseline (32,402 listings) |
| Melbourne | A$58,606 | 70% | CBD & events hub |
| Southbank | A$63,895 | 64% | Arts & convention fringe |
| New South Wales | A$76,220 | 55% | Sydney-scale coastal rival |
| Queensland | A$82,345 | 65% | Subtropical holiday let market |
Who should invest: hosts comfortable with body-corporate rules in Melbourne and Southbank, or buyers targeting peninsula summer weeks with parking and outdoor space.
Who should skip: investors expecting Queensland-style winter occupancy from a Melbourne CBD one-bedroom without a clear event or corporate niche.
Victoria Market Analysis
Who books Melbourne CBD and Southbank?
Melbourne and Southbank fill on sports finals, festival weekends, and mid-week corporate travel when guests want laneway dining and tram links. Nightly rates spike around the Australian Open and spring racing, but body-corporate short-stay caps and owner-occupier noise rules bite concentrated apartment towers. Docklands adds convention and waterfront demand with a different guest mix than Fitzroy or St Kilda terrace stock.
What drives peninsula and Surf Coast ADR?
Rye, Sorrento, and Torquay trade on school-holiday family weeks, hot-tub winter escapes, and Great Ocean Road road trips. Revenue per listing often trails inner Melbourne on paper while acquisition costs and competition profiles differ entirely. Beach houses with parking for two cars and outdoor showers outperform compact units that assume guests will arrive without eskies, boards, or dogs.
What to buy in regional Victoria?
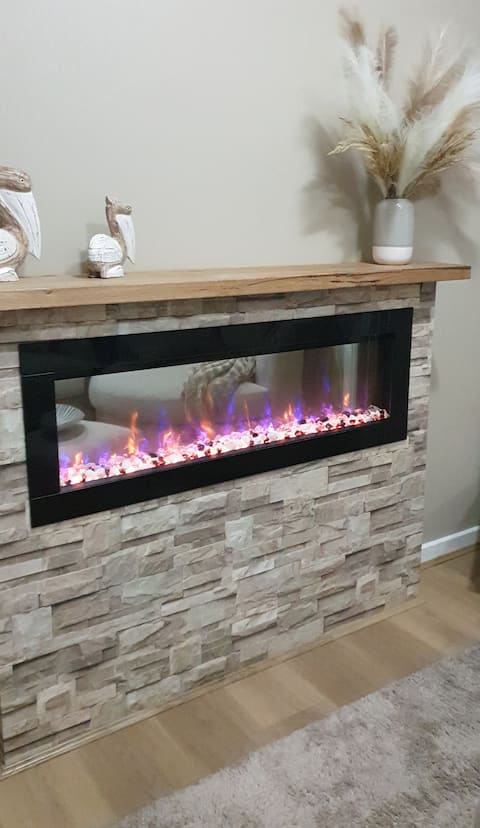
Geelong suits hosts priced out of Melbourne who still want V/Line access to events, while Bright and Mount Buller book opposite alpine seasons from bay towns like Cowes. Spa country around Daylesford adds couples weekends with fireplace marketing that peninsula stock rarely needs in summer.
Most Profitable Areas in Victoria
Victoria’s short-stay demand clusters on Melbourne’s inner suburbs and a ring of bay, surf, and alpine towns — not evenly across every postcode. The markets below combine inventory depth with annual revenue that hosts can actually model.
Top performing towns & suburbs
Melbourne:2,863 listings averaging A$58,606 at 70% occupancy — CBD and inner-suburb apartments for events and corporate travel.
Southbank:1,117 listings at A$63,895 with 64% occupancy — arts precinct, convention centre, and casino fringe.
Rye:747 listings earning A$72,871 — Mornington Peninsula family beach weeks.
Docklands:669 listings at A$63,328 — waterfront towers and business-event spillover.
Cowes:767 listings at A$53,644 — Phillip Island penguin parade and summer holiday houses.
Sorrento:326 listings earning A$103,142 — premium peninsula village with ferry links to Queenscliff.
St Kilda:434 listings at A$47,895 — beach, Luna Park, and live-music weekend demand.
Lorne:402 listings at A$71,774 — Great Ocean Road gateway with strong summer occupancy.
Torquay:420 listings earning A$66,071 — surf coast and Bells Beach event weekends.
Daylesford:431 listings at A$68,315 — spa country cabins and couples escapes.
Peninsula & bay family markets
Rye, Sorrento, and Cowes attract Melbourne families who want beaches, BBQ decks, and room for multi-generational groups. January school holidays drive occupancy, while winter weekends need fireplaces, hot tubs, or explicit work-from-beach Wi-Fi promises. Parking for boats and jet skis is a real filter — listings that bury access instructions in paragraph four tend to collect review complaints.
Alpine & spa country
Mount Buller and Bright run a ski-and-cycling calendar distinct from bay towns, with steep revenue peaks when snow or autumn leaves align. Daylesford and Lorne trade on couples weekends and Great Ocean Road touring rather than corporate mid-weeks. Underwrite heating costs, firewood delivery, and linen turnover for muddy hiking boots — alpine and spa guests notice those details in star ratings.
Top 10 Airbnb Markets in Victoria
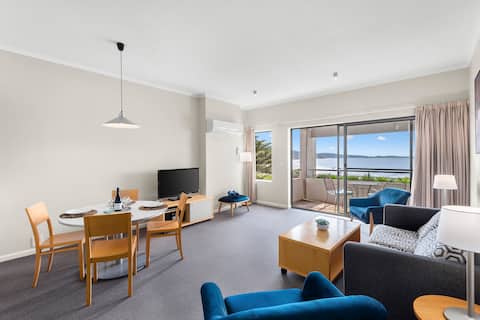
Melbourne is Australia’s undisputed cultural and sporting capital, world-famous for its hidden laneways, exceptional coffee culture, and non-stop event calendar. As a premier global destination, it attracts a massive and diverse mix of business and leisure travelers throughout the year. The Airbnb market is incredibly vast, with over 16,759 listings and a solid occupancy rate of 59%. Visitors seek stylish urban apartments in the CBD or character homes in trendy suburbs like Fitzroy or St Kilda, generating an annual revenue of A$58,852. Its status as a global hub ensures constant demand and a highly dynamic environment for hosts.
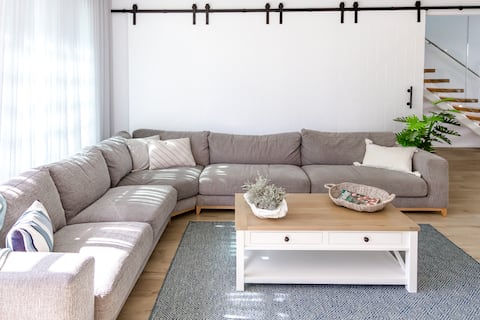
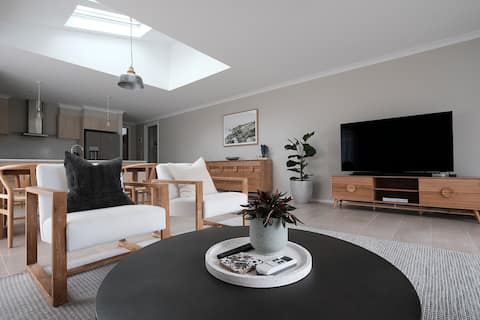
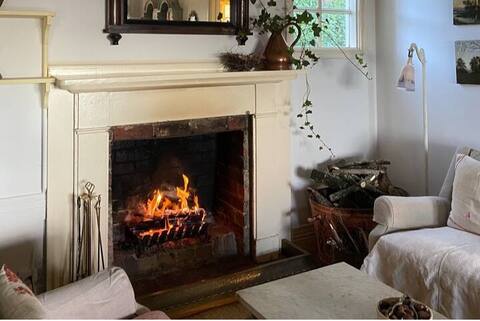
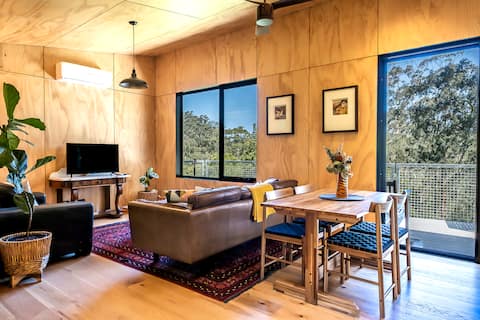
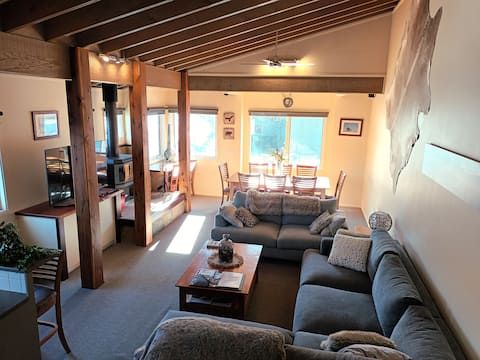
Featured Listings
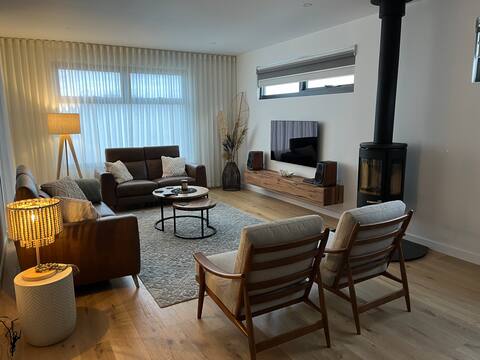
Geelong is a vibrant regional hub serving as the gateway to the world-famous Great Ocean Road and the Bellarine Peninsula. It blends a revitalized industrial waterfront with a thriving arts and dining scene. The vacation rental market is strong, featuring over 1,538 listings and an occupancy rate of 45%. Visitors favor well-located city apartments and coastal homes near Eastern Beach, resulting in an annual revenue of A$53,116. Its mix of urban energy and coastal accessibility, combined with major events like the Festival of Sail, ensures consistent appeal and steady returns for hosts.
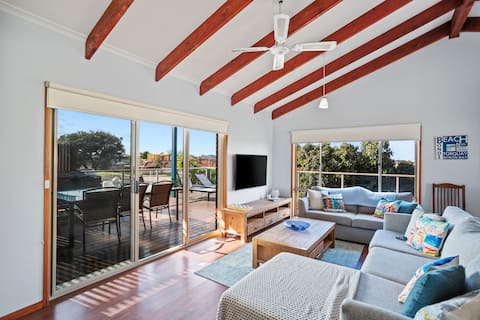
Cowes is the charming and vibrant hub of Phillip Island, world-famous for its Penguin Parade and the Grand Prix Circuit. It offers a perfect blend of north-facing beaches, coastal activities, and a friendly village atmosphere. The short-term rental market is very active, featuring an occupancy rate of 41%. Visitors flock to holiday homes with large decks and beachside apartments, providing hosts with a steady annual revenue of A$53,644. Its consistent popularity as a weekend getaway from Melbourne and its major international sporting events ensure high seasonal peaks and a reliable income for property owners.
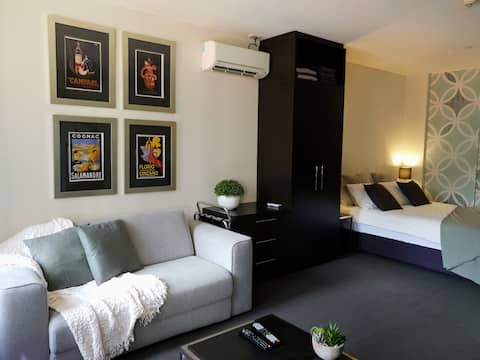
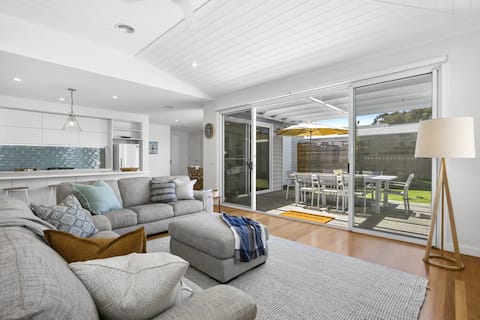
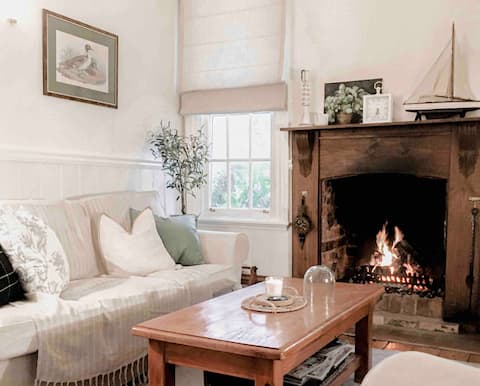
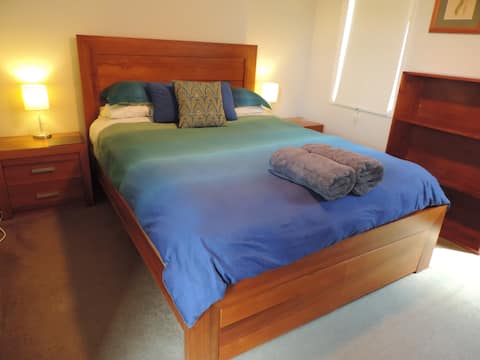
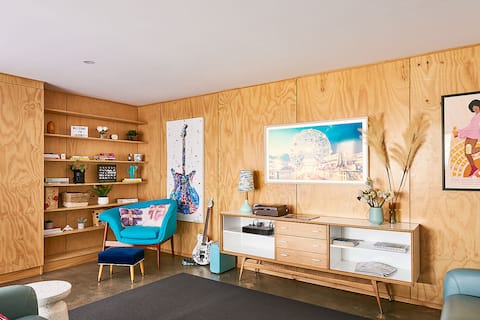
Featured Listings
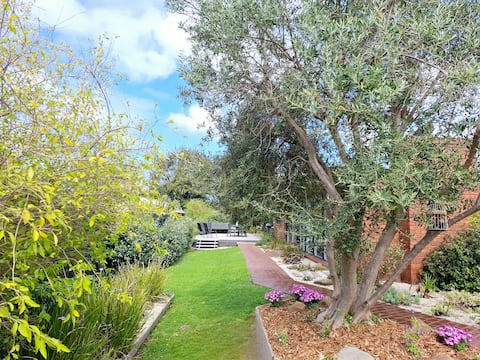
Bright is a stunning alpine village in the Ovens Valley, famous for its incredible autumn colors, world-class cycling, and proximity to the Victorian ski fields. It is a premier year-round destination that thrives on nature, adventure, and local gourmet produce. The short-term rental market is high-performing, with an average daily rate of A$397. Visitors seek charming holiday homes and stylish cottages with mountain views, generating an annual revenue of A$71,779. Its consistent appeal to outdoor enthusiasts and families seeking a mountain escape ensures strong occupancy and premium pricing throughout the seasons.
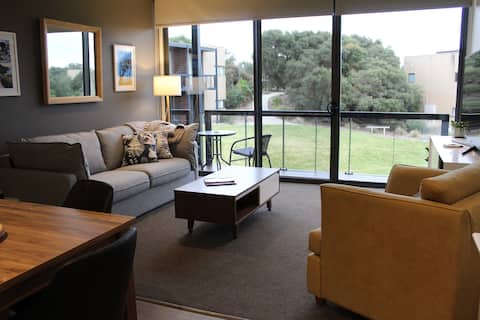
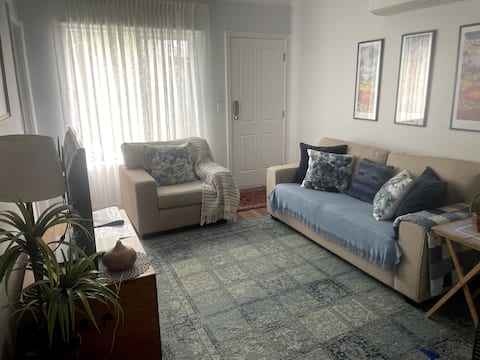
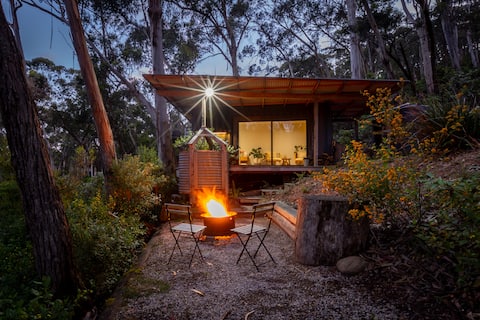
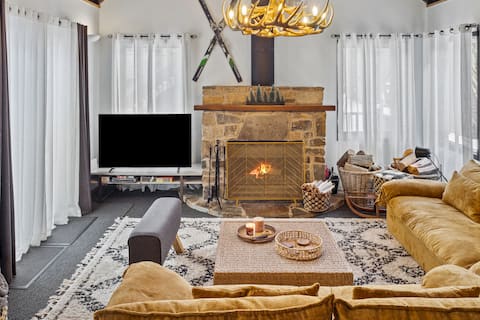
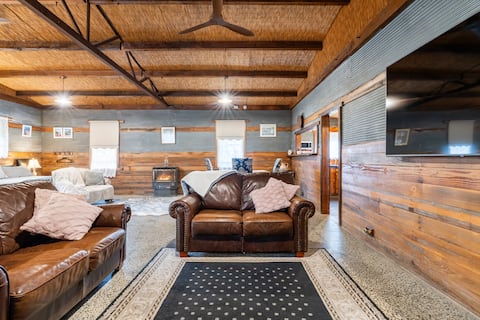
Featured Listings

Daylesford is Australia’s spa capital, a sophisticated and scenic village in the Central Highlands famous for its natural mineral springs and thriving arts and dining scene. It’s a premier destination for romantic getaways and wellness retreats year-round. The Airbnb market is exceptionally high-yielding, featuring an average daily rate of A$393. Visitors seek luxury architectural homes, charming cottages, and stylish studios, driving an annual revenue of A$68,315. Its proximity to Melbourne and its status as a wellness icon ensure consistent demand and premium pricing, making it a top-tier market for high-quality hosts.
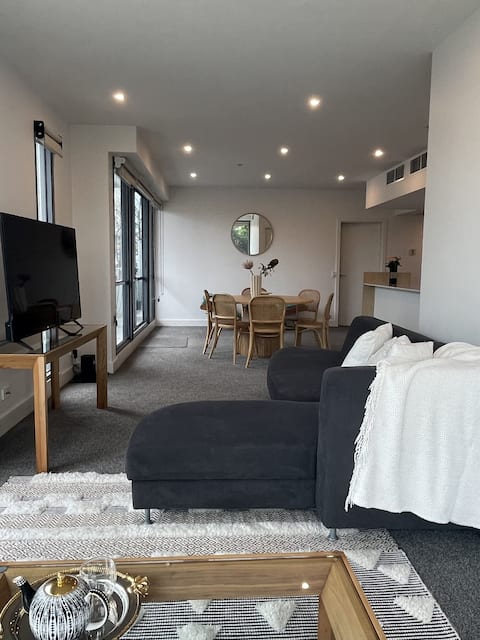
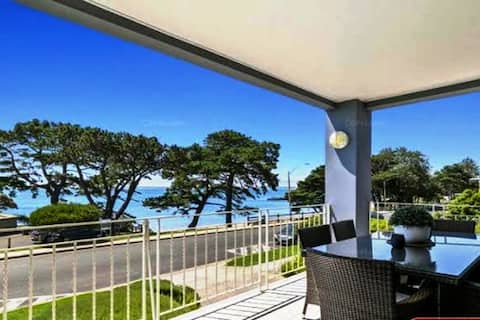
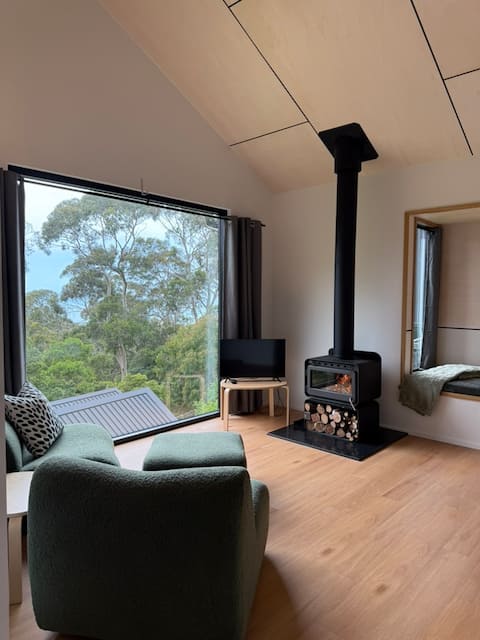
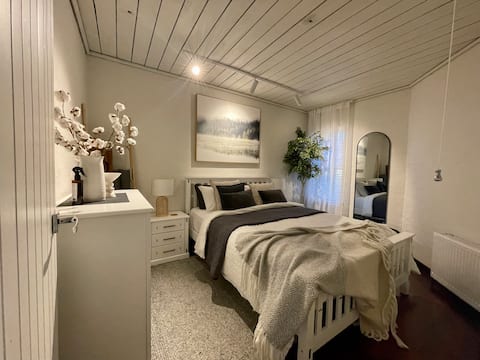
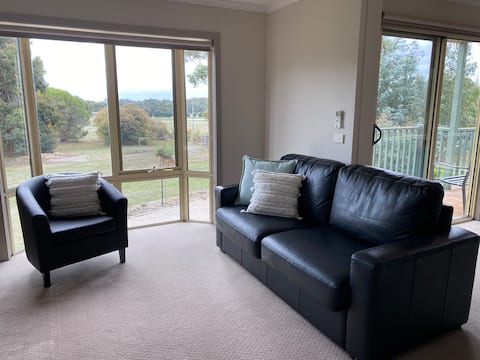
Featured Listings
Lorne is the most sophisticated and iconic resort town on the Great Ocean Road, where the forest meets the sea in a breathtaking setting. Famous for its stylish boutiques, dining scene, and the annual Falls Festival, it attracts a high-end clientele seeking a premium coastal experience. The vacation rental market is exceptional, featuring an average daily rate of A$496. Visitors seek luxury beach houses and apartments with expansive ocean views, driving a strong annual revenue of A$71,774. Its unique blend of upscale lifestyle and natural beauty makes it one of the most desirable and lucrative markets in Victoria.
Featured Listings
Torquay is the official gateway to the Great Ocean Road and the world’s surfing capital, home to the iconic Bells Beach. It offers a dynamic coastal lifestyle that attracts surfers, families, and nature lovers year-round. The Airbnb market is robust, with an occupancy rate of 46%. Travelers favor modern beach houses and stylish apartments close to the surf shops and main beach, resulting in an annual revenue of A$66,071. Its global surf brand and spectacular coastal scenery ensure it remains a premier destination for domestic and international visitors, providing excellent returns for hosts.
Featured Listings
Apollo Bay is a picturesque coastal town on the Great Ocean Road, offering a relaxed and family-friendly atmosphere surrounded by the lush Otway Ranges. It’s a popular base for exploring the 12 Apostles and the Otway National Park. The short-term rental market is strong, with an occupancy rate of 45%. Visitors favor spacious holiday homes and apartments near the beach and harbor, providing hosts with an annual revenue of A$64,448. Its spectacular natural setting and consistent appeal as a key stop on one of the world’s most famous drives ensure steady demand and reliable returns.
Featured Listings

Dinner Plain is Australia’s highest and most unique alpine village, famous for its distinct stone and timber architecture and its proximity to Mount Hotham. It offers a true mountain escape that thrives in winter for snow sports and in summer for hiking and high-country adventures. The vacation rental market is premium, featuring an average daily rate of A$865. Visitors seek character-filled chalets and cozy apartments, generating a significant annual revenue of A$118,296. Its high-altitude brand and year-round activities ensure it remains a prestigious and lucrative market for alpine property investment.
Featured Listings
The City of Ballarat is a premier historic destination famous for its gold rush heritage, grand Victorian architecture, and the iconic Sovereign Hill. As a thriving regional hub, it attracts a mix of cultural tourists, business travelers, and families. The Airbnb market is robust, featuring an occupancy rate of 57%. Visitors favor well-located character homes and modern city apartments, resulting in an annual revenue of A$44,384. Its constant stream of events, including the Ballarat International Foto Biennale and Begonia Festival, ensures consistent appeal and steady returns for property owners.
Featured Listings
Get Live Victoria, Australia Market Intelligence
Discover detailed Victoria, Australia Airbnb Analytics and explore real-time market data to make accurate investment decisions.
Explore Real-time Analytics