Best Airbnb Markets in Campania, Italy
Navigating the Campania, Italy rental market is easier when you have a clear overview of the best-performing locations. Our analysis covers the top 10 areas, providing you with a data-backed look at where the market is currently heading.
The numbers provided represent broad averages and are intended to kickstart your research process. For a deeper analysis with custom metrics and property-level insights, trust GuestFavorites to give you the full picture.
Campania Airbnb Market Map (June 2026)
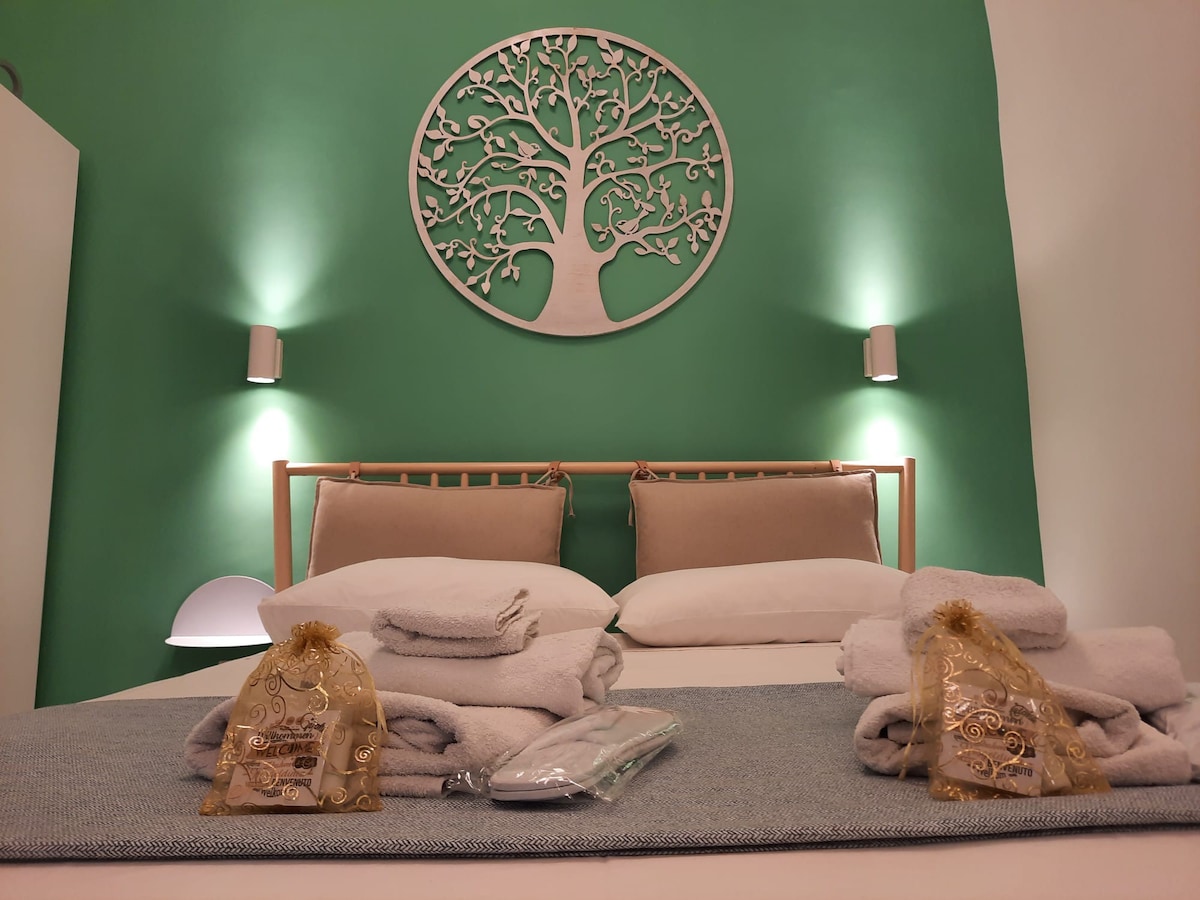
Naples, the city of sun and myth suspended between Vesuvius and the sea, is one of the world’s most powerful and vibrant Airbnb markets—an unparalleled burst of art, history, and flavor. With over 5,957 listings, it is an incredibly dynamic and international market, boasting an occupancy rate of 59%. Visitors seek the authentic charm of apartments in the UNESCO-listed historic center or the exclusivity of residences in Posillipo and along the Caracciolo waterfront, paying an average daily rate of €118. Its status as a global icon of culture and gastronomy ensures strong and consistent year-round profitability.
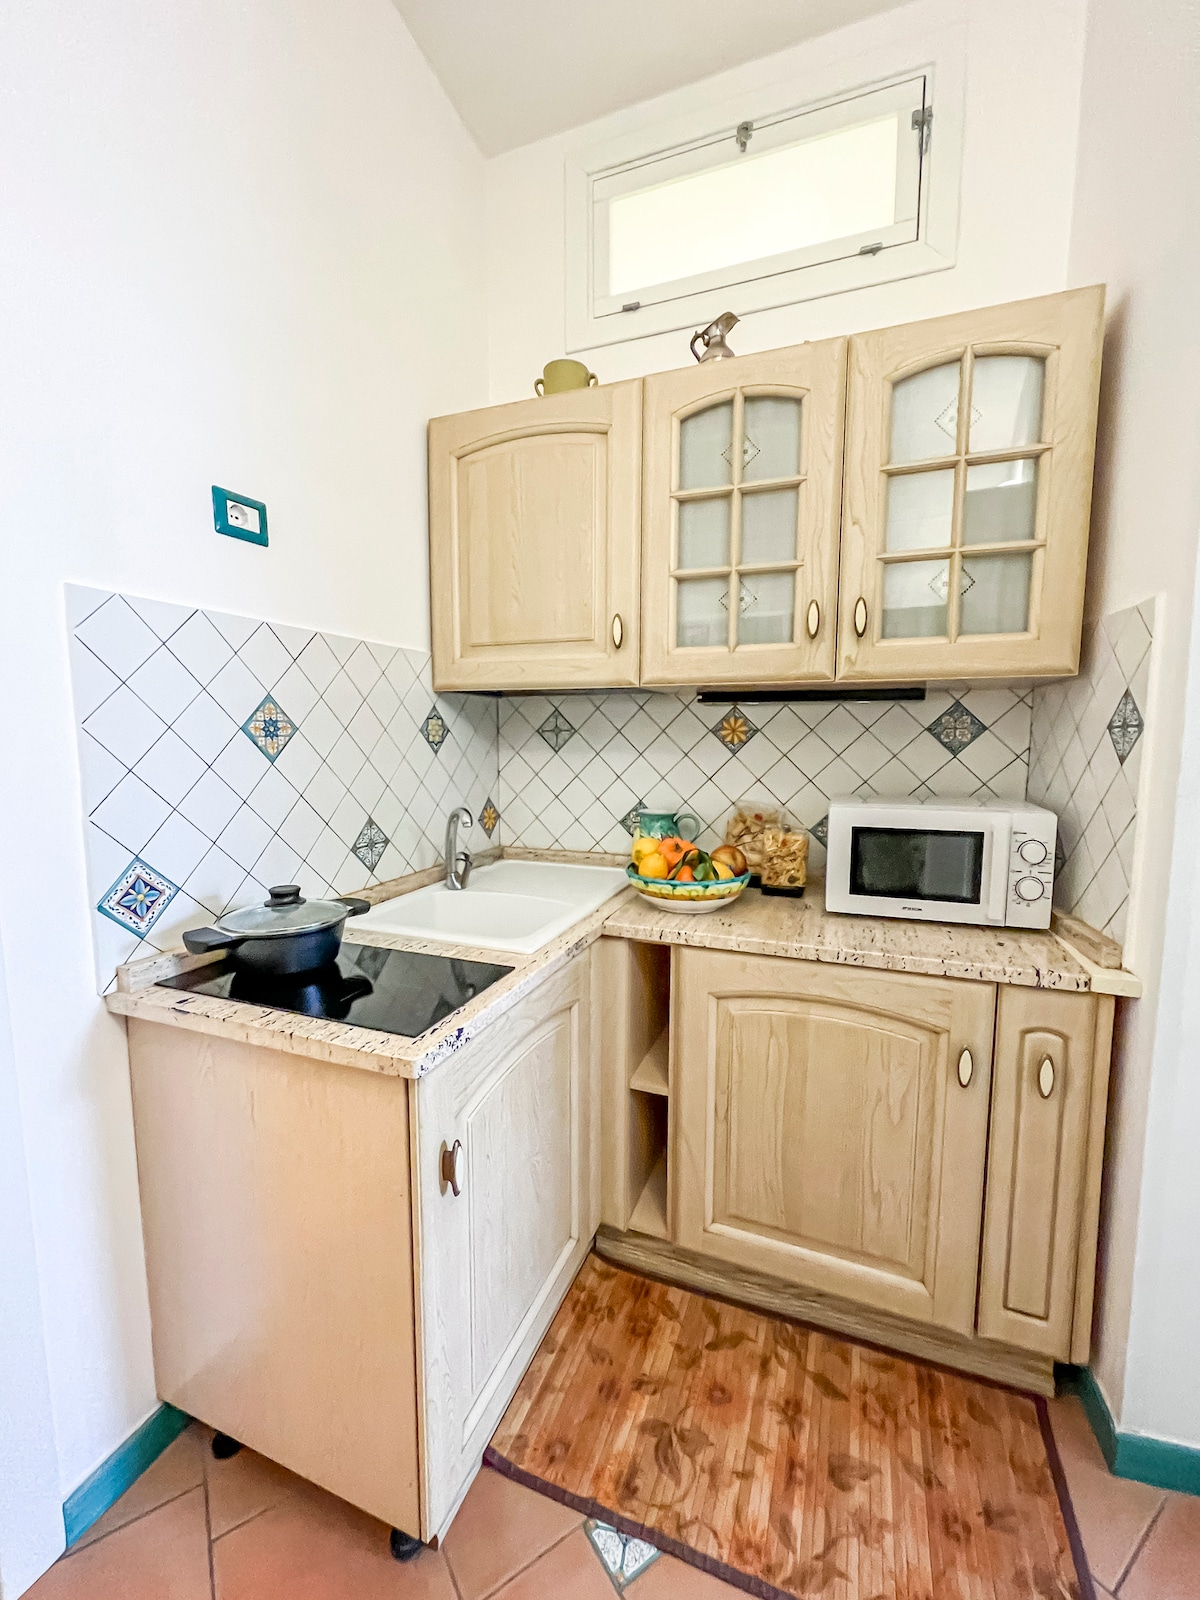
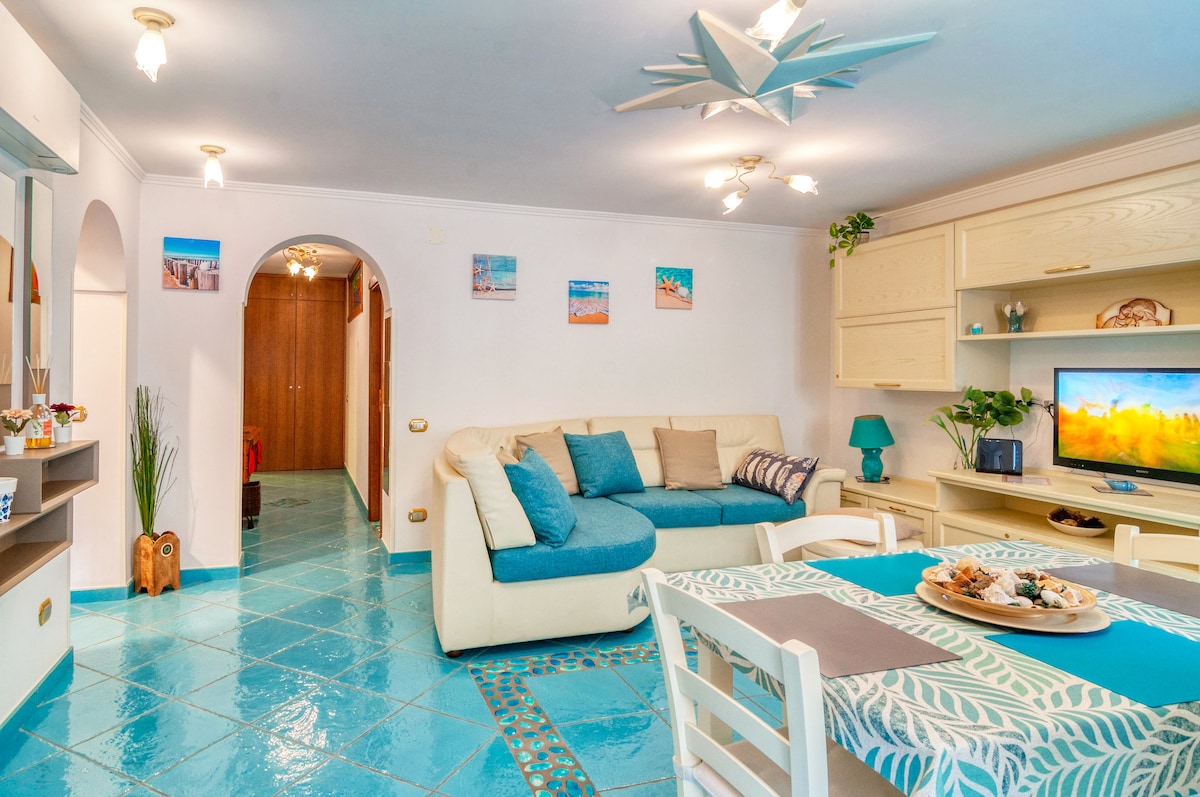
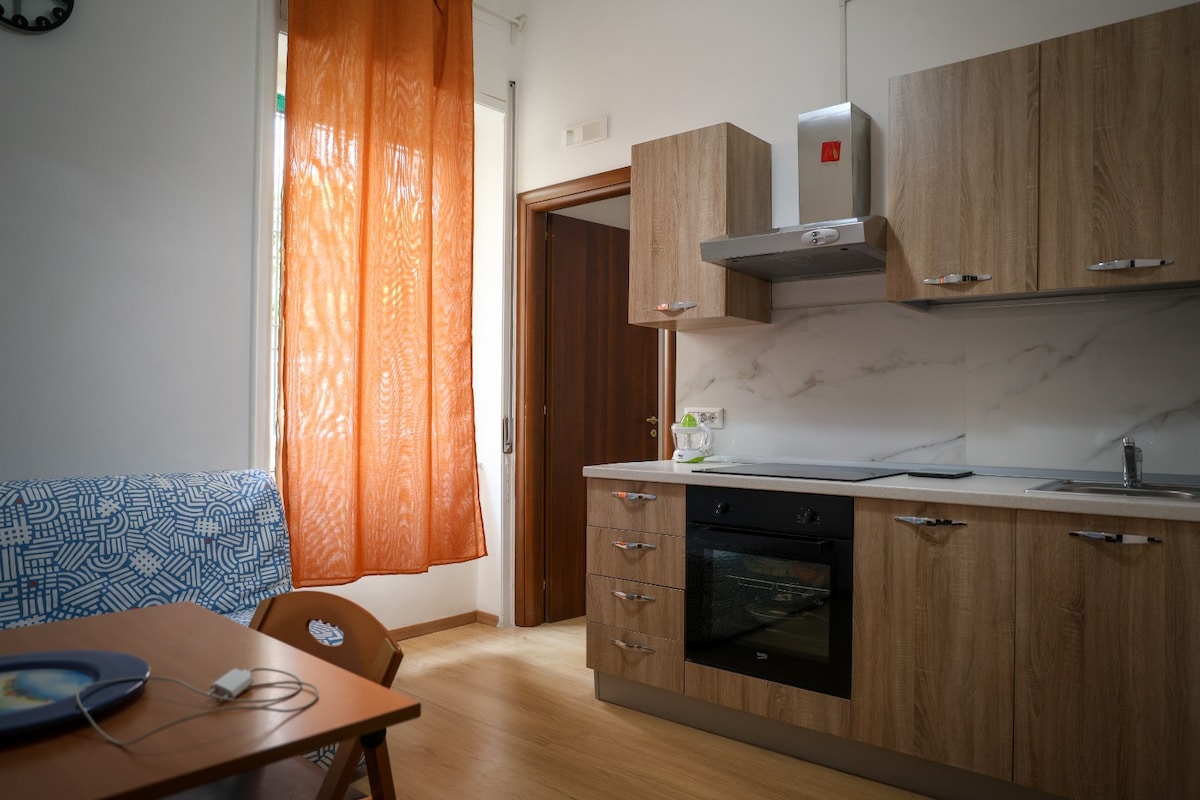
Featured Listings
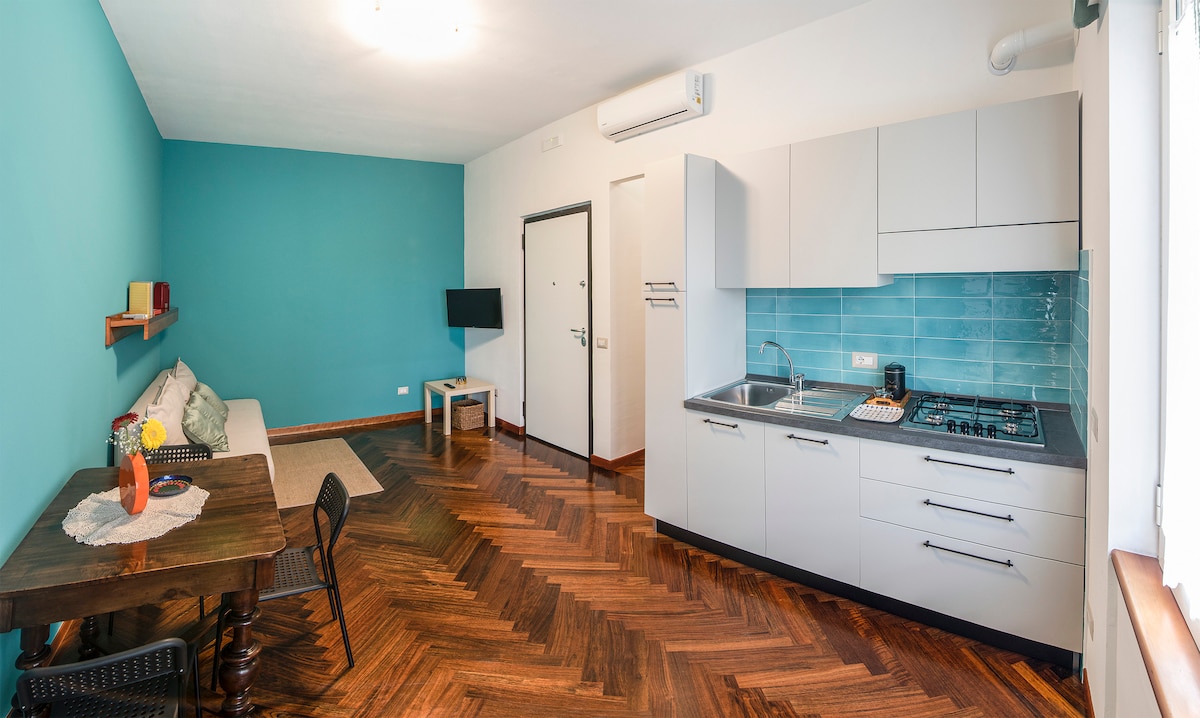
Sorrento, the land of sirens perched on a massive tuff terrace, enchants with its lemon gardens, seaside cliffs, and legendary views over the Gulf of Naples. It is an elite destination merging 19th-century elegance, fine craftsmanship, and world-class hospitality. The rental market is extraordinarily profitable here, featuring an occupancy rate of 68%. Visitors seek exclusive apartments with sea-view terraces and charming villas nestled in greenery, paying an average daily rate of €360. Its image of timeless luxury ensures high-profile demand and exceptional profitability.
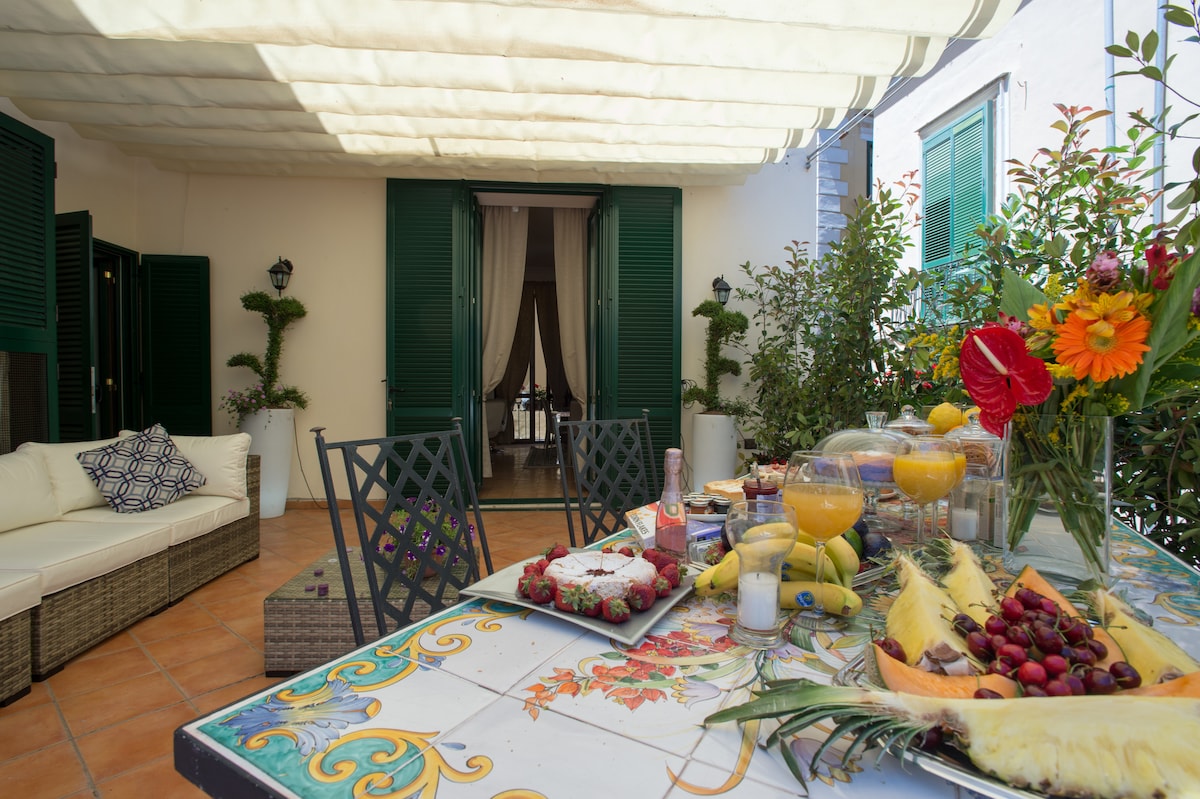
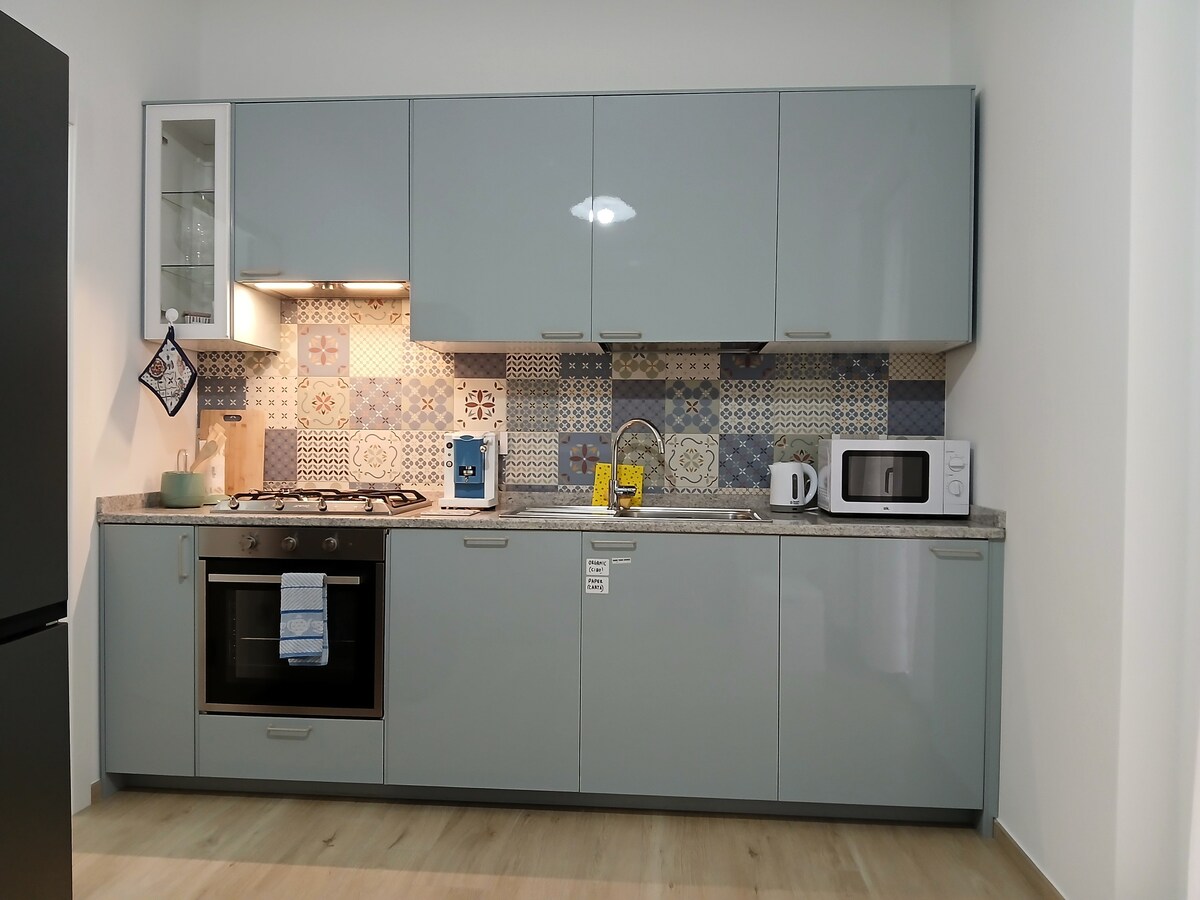
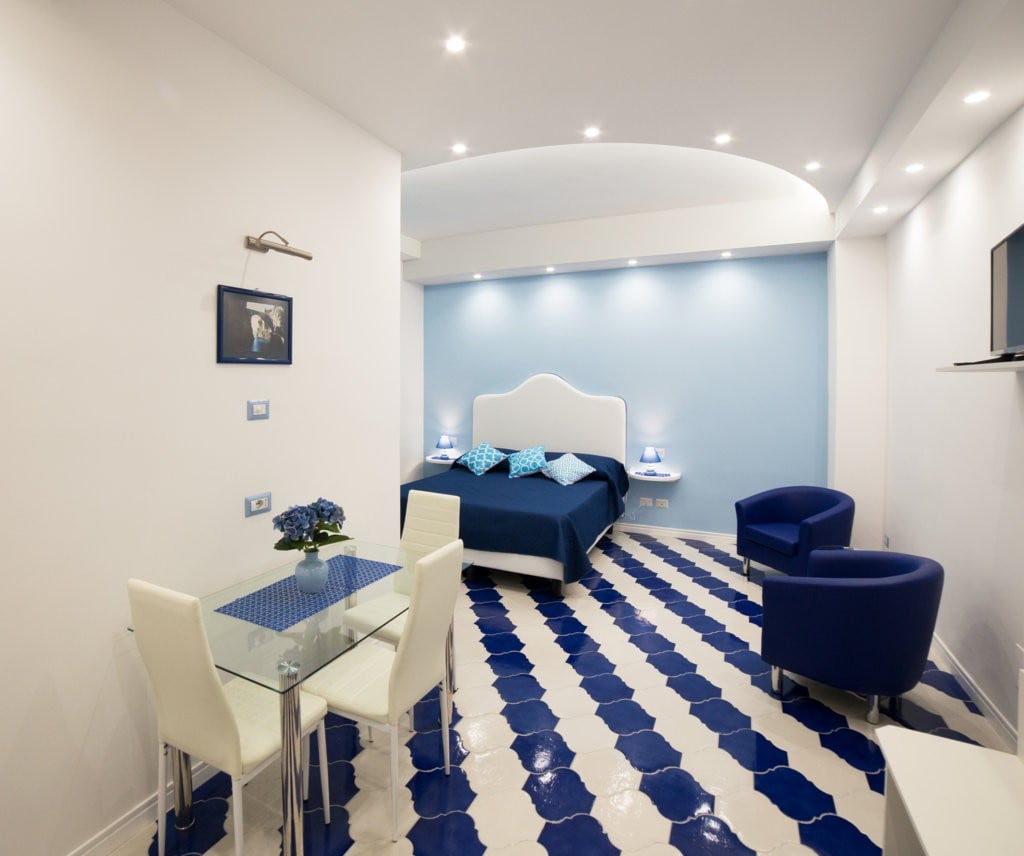
Featured Listings
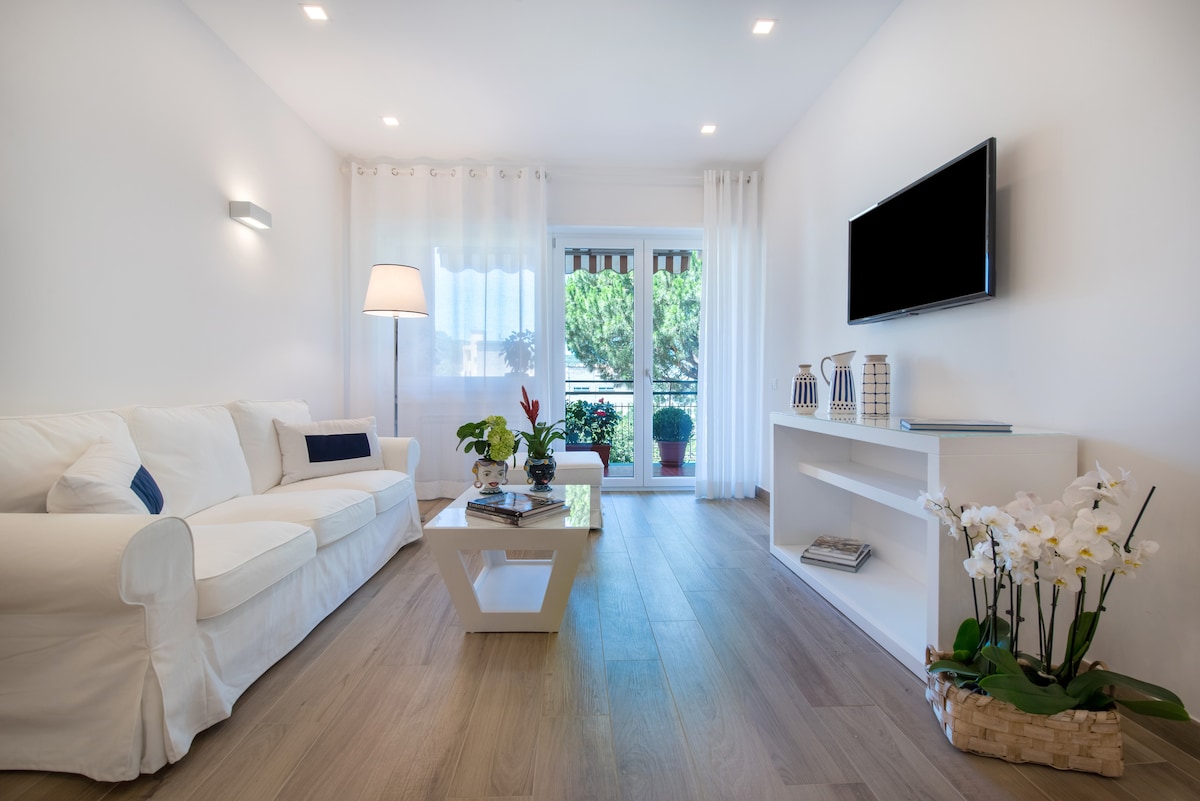
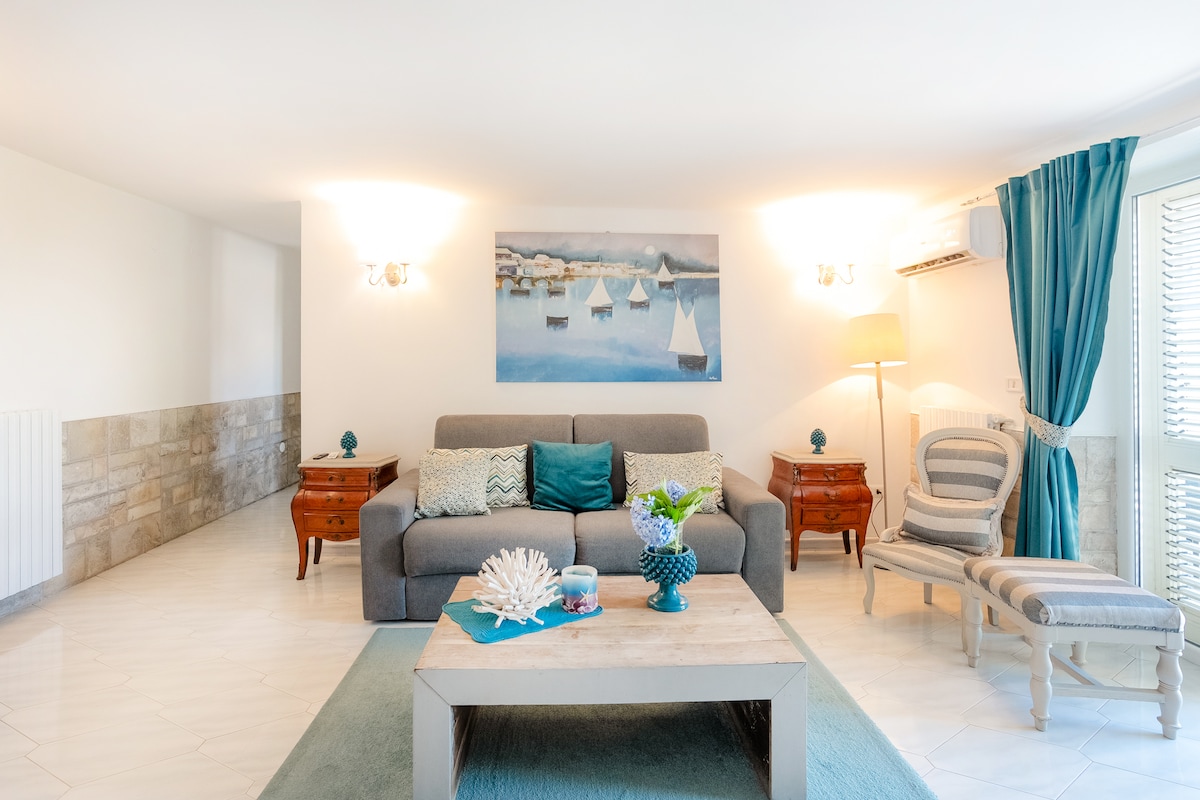
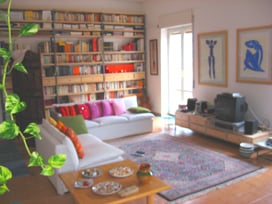
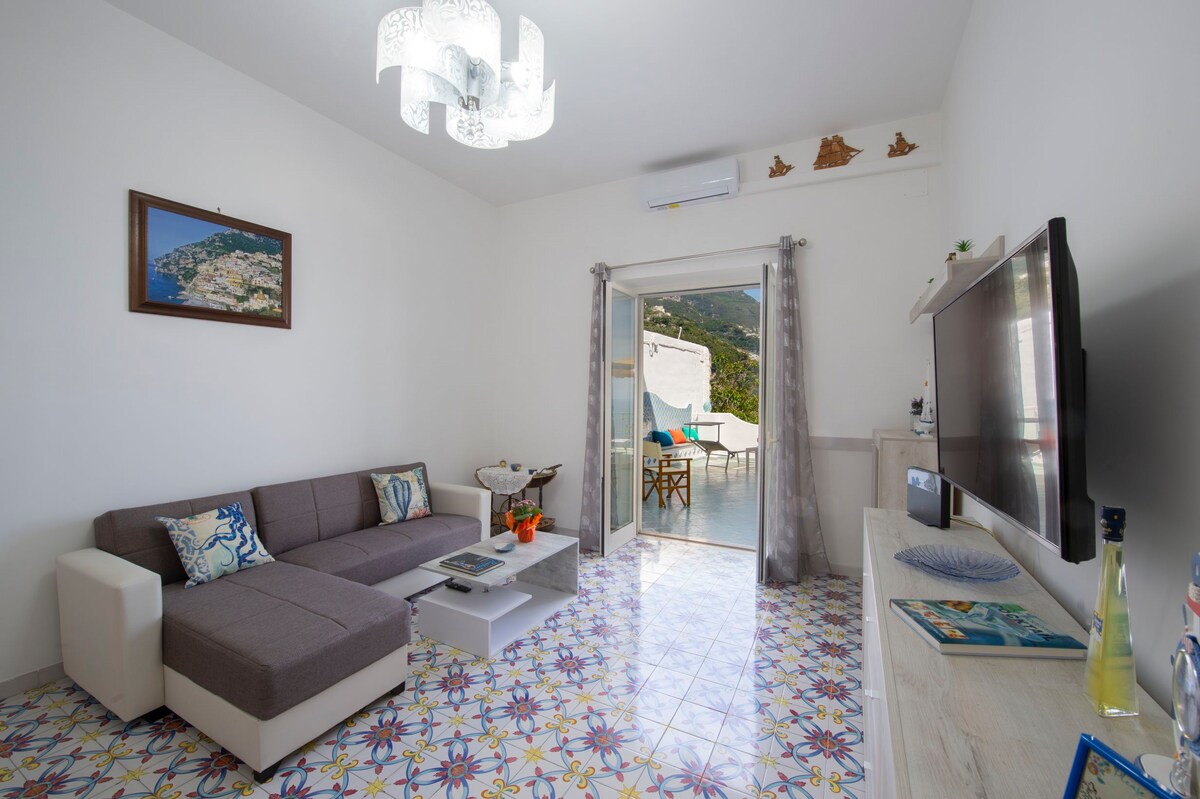
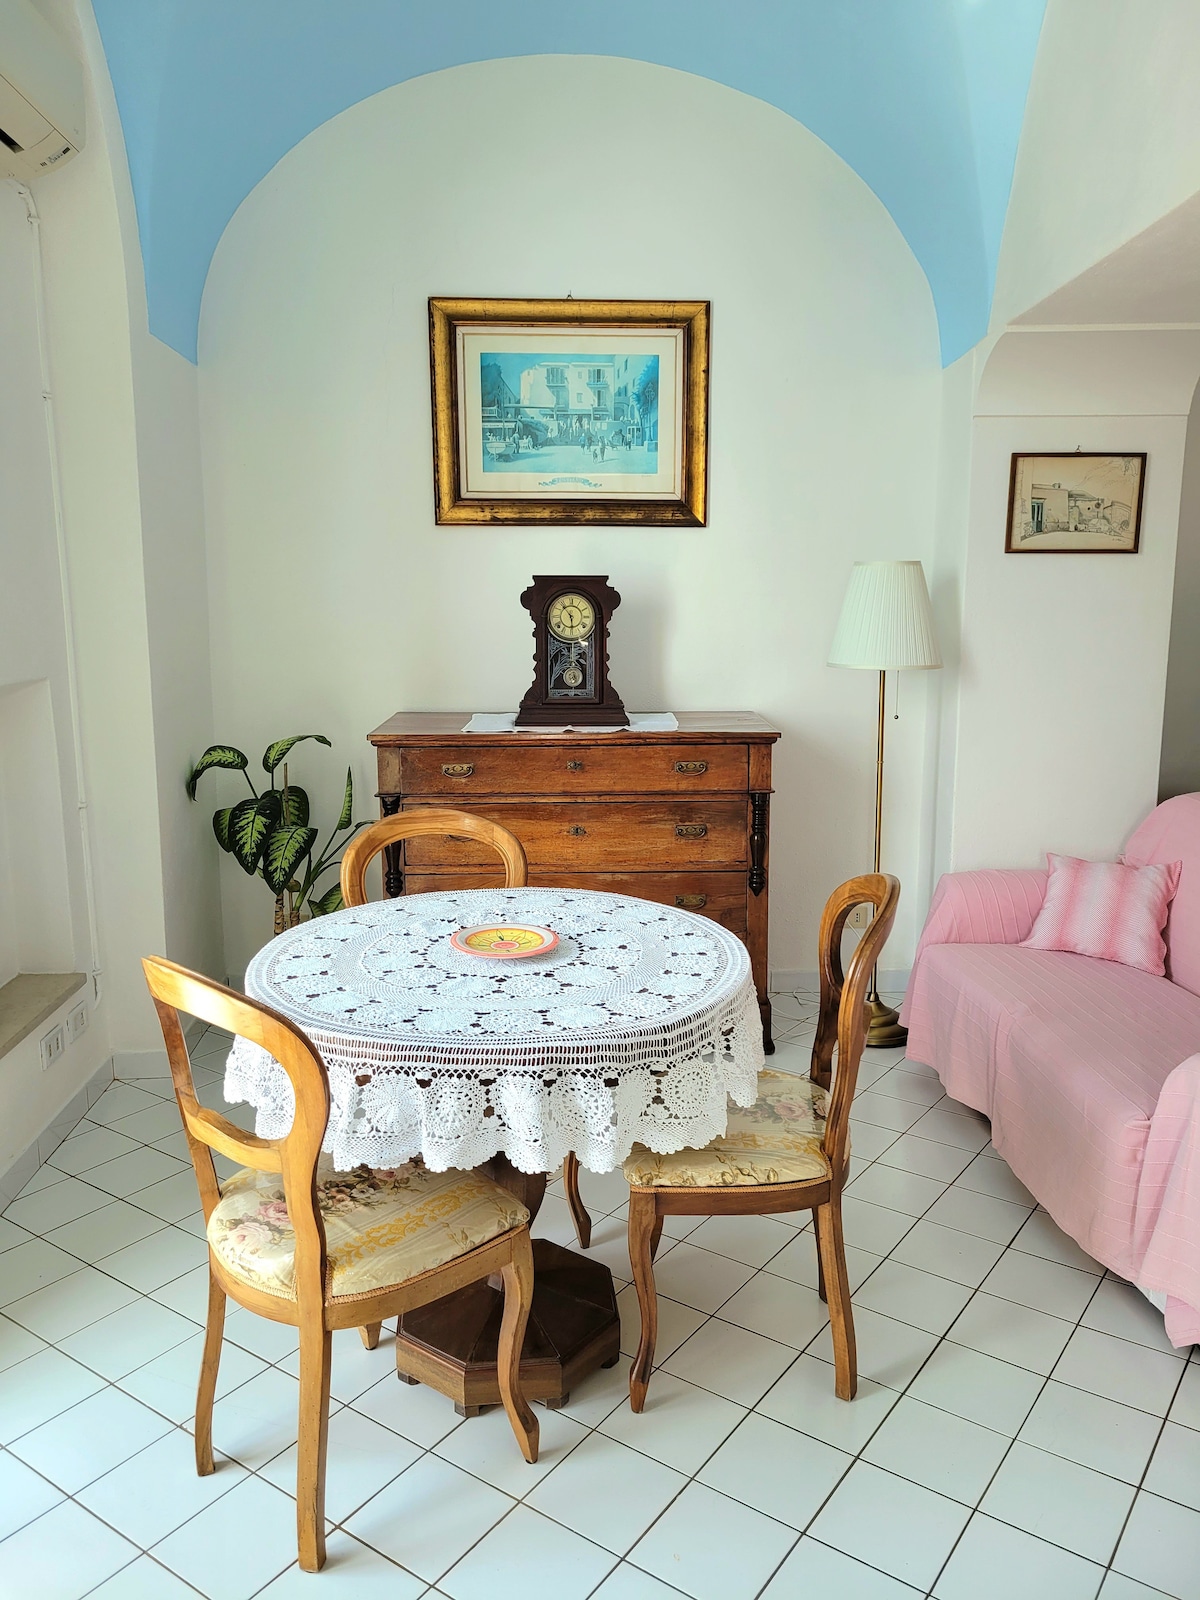
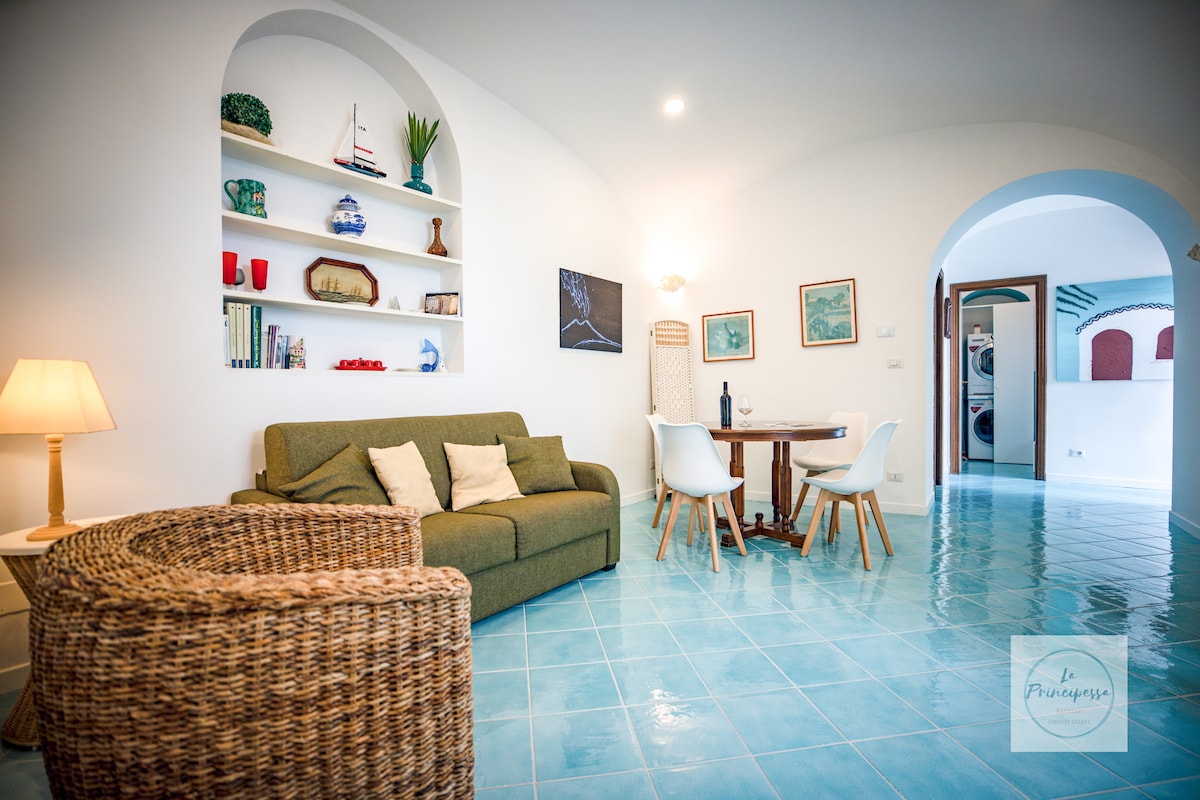
Positano is the vertical jewel of the Amalfi Coast, a dreamlike village where pastel-colored houses climb the cliffs above crystal-clear waters. It is a legendary destination attracting the international jet-set seeking absolute beauty, Positano fashion, and breathtaking views. The Airbnb market is among the most prestigious in the world, featuring an average daily rate of €669. Visitors seek absolute exclusivity in cliffside residences and the charm of ancient village apartments, generating an annual revenue of €160,729. Its legendary aura ensures relentless high-level demand.
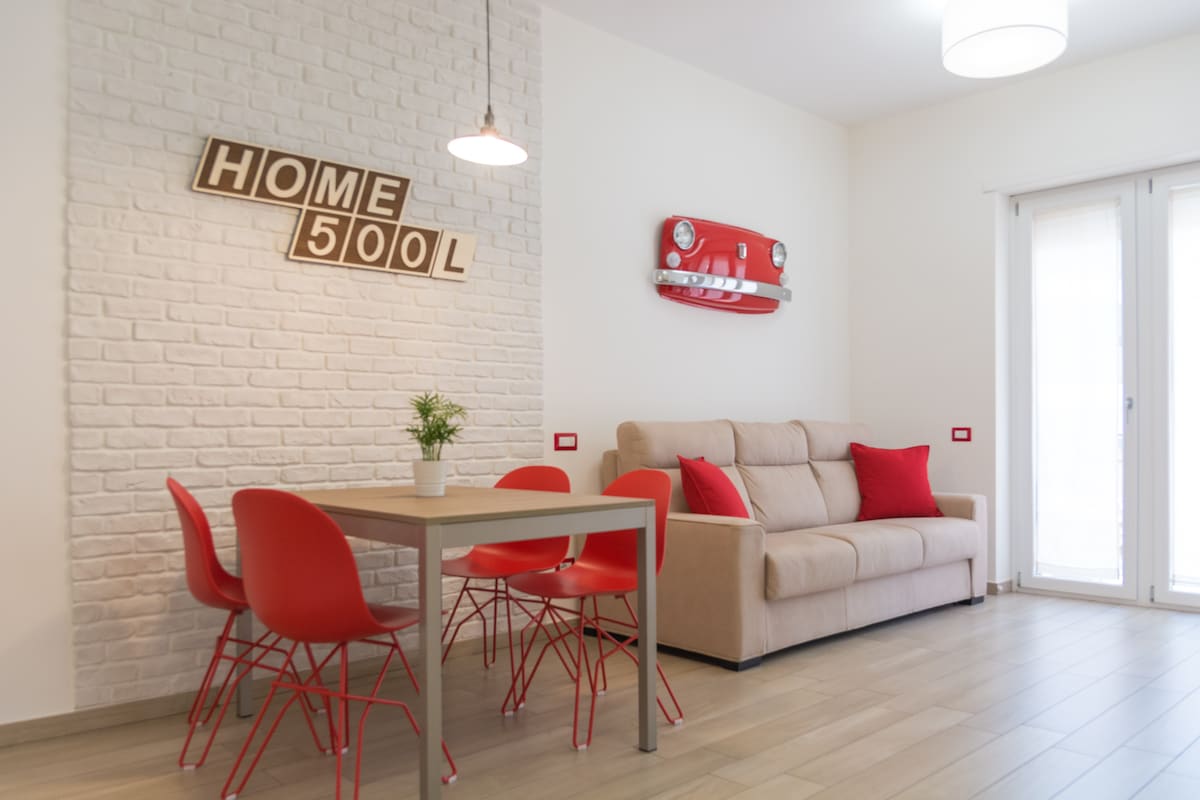
Featured Listings

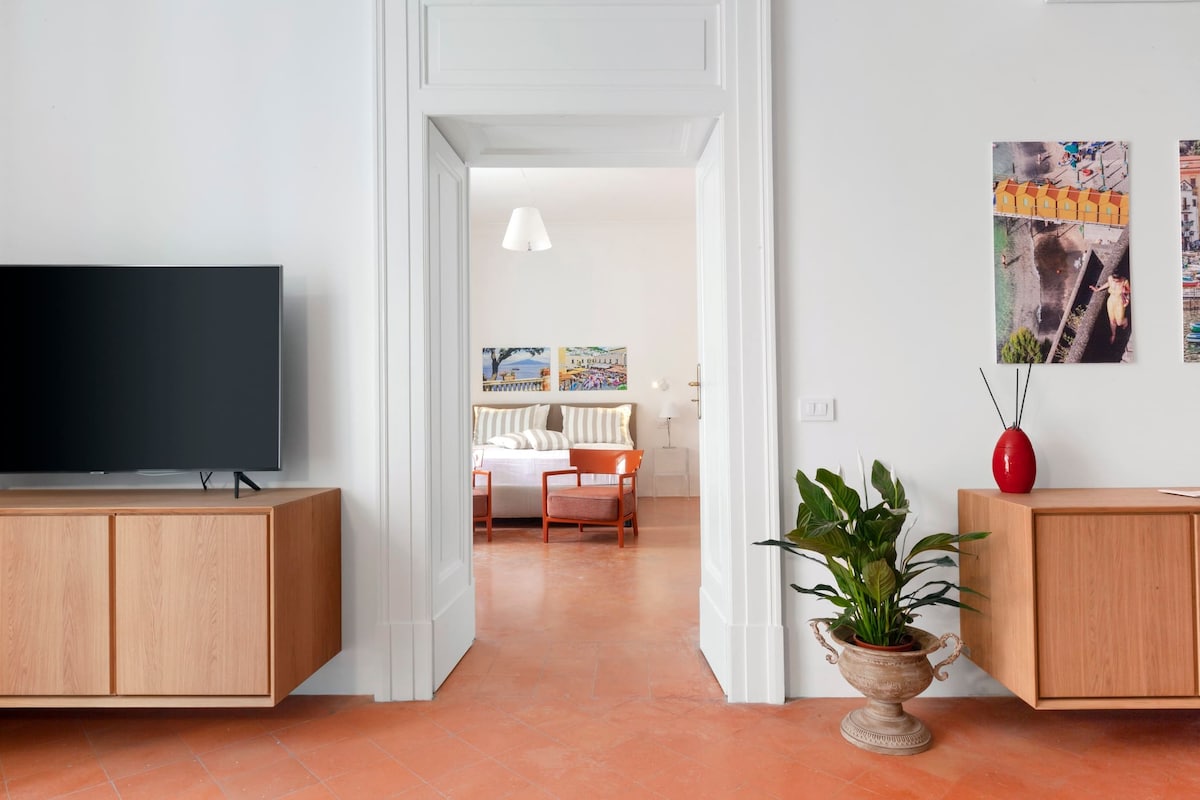
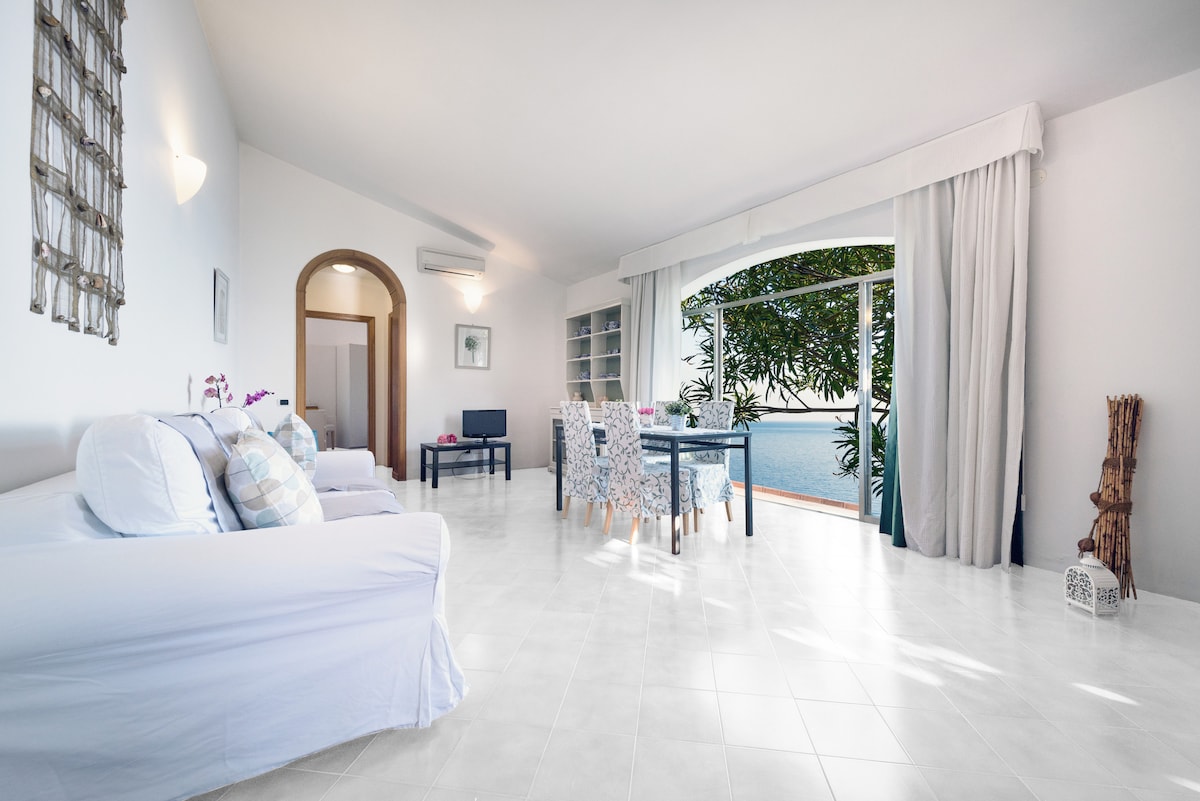
Massa Lubrense, located at the very tip of the Sorrento Peninsula facing Capri, offers an oasis of peace and untouched nature among ancient olive groves and hidden coves like Nerano. It is a prestigious destination attracting international tourism seeking privacy, Michelin-starred dining, and breathtaking seascapes away from the crowds. The rental market is highly profitable here, featuring an average daily rate of €466. Visitors seek exclusive cliffside villas with pools and the charm of renovated farmhouses, generating an annual revenue of €102,141. Its serene atmosphere ensures consistent profitability.
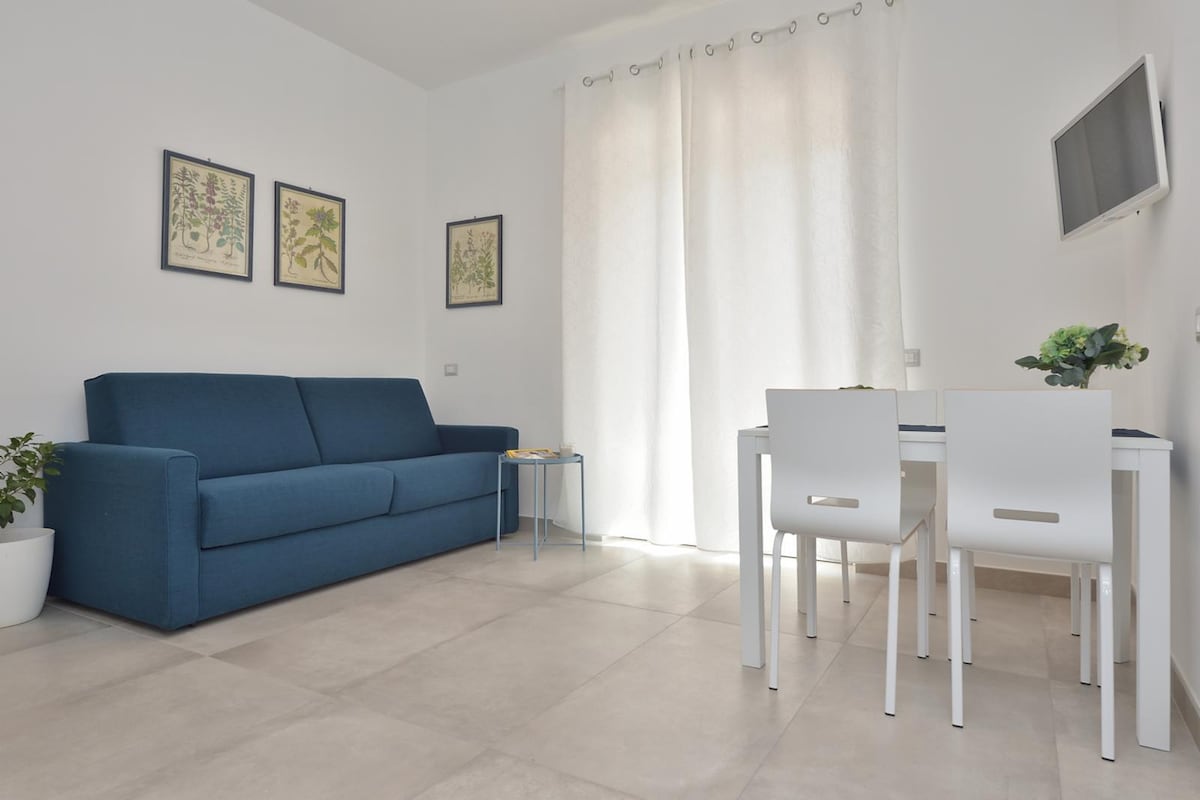
Featured Listings
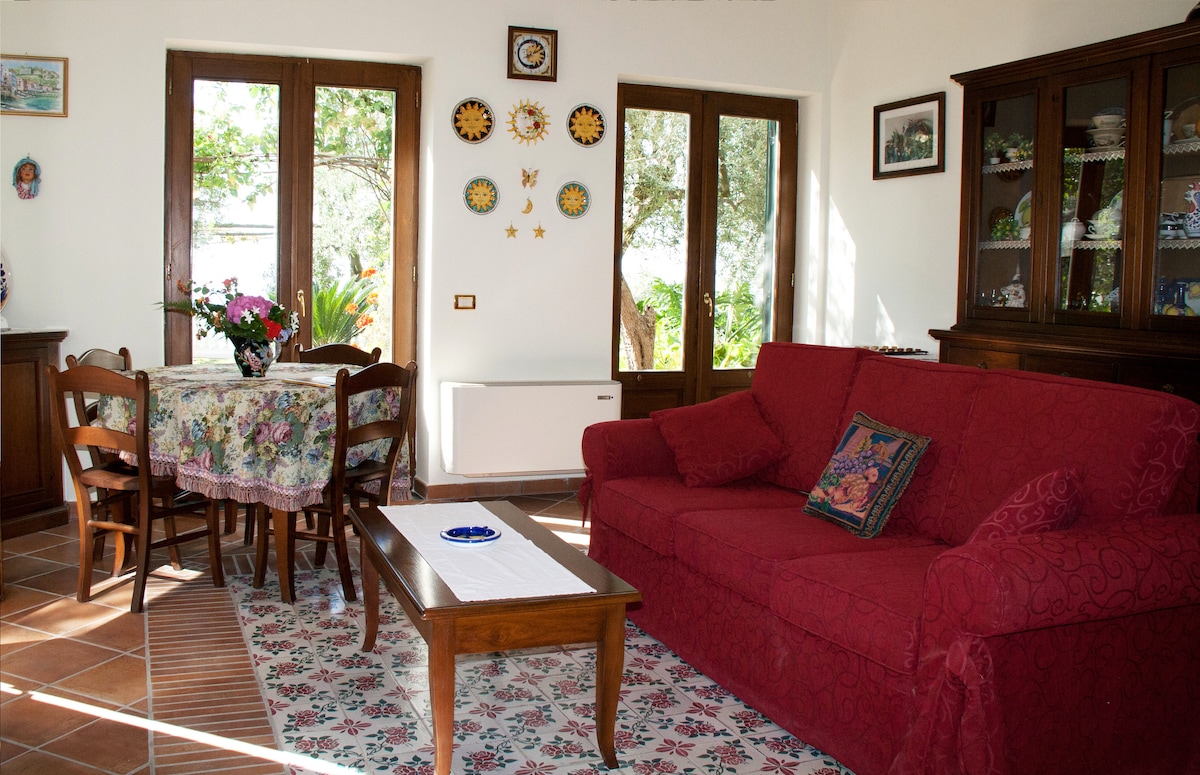
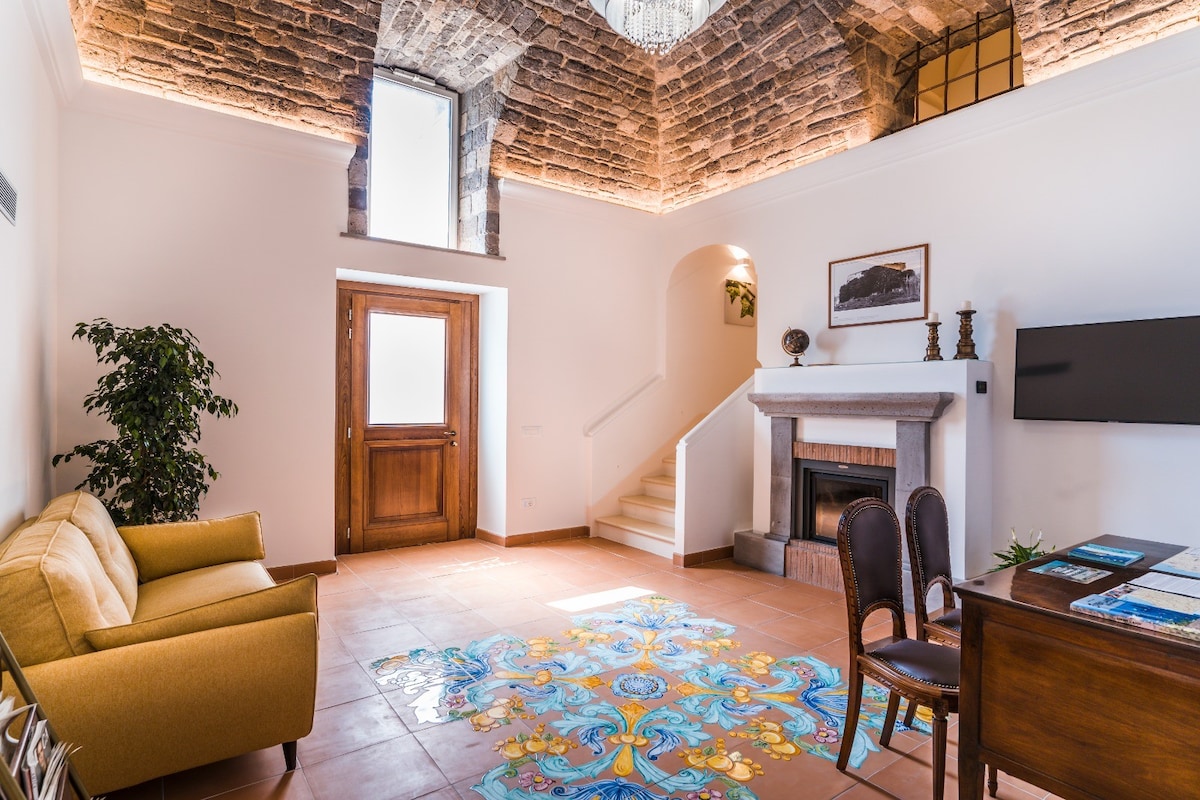
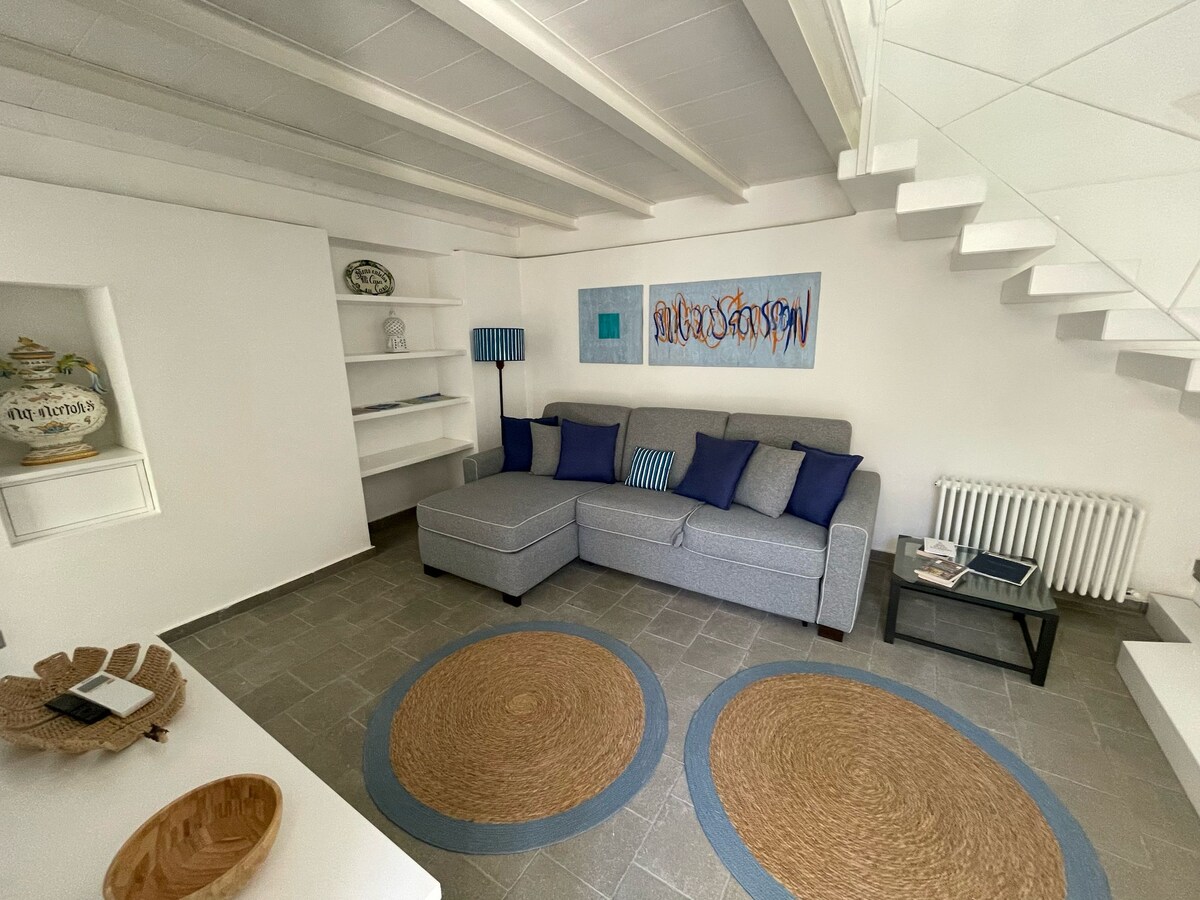
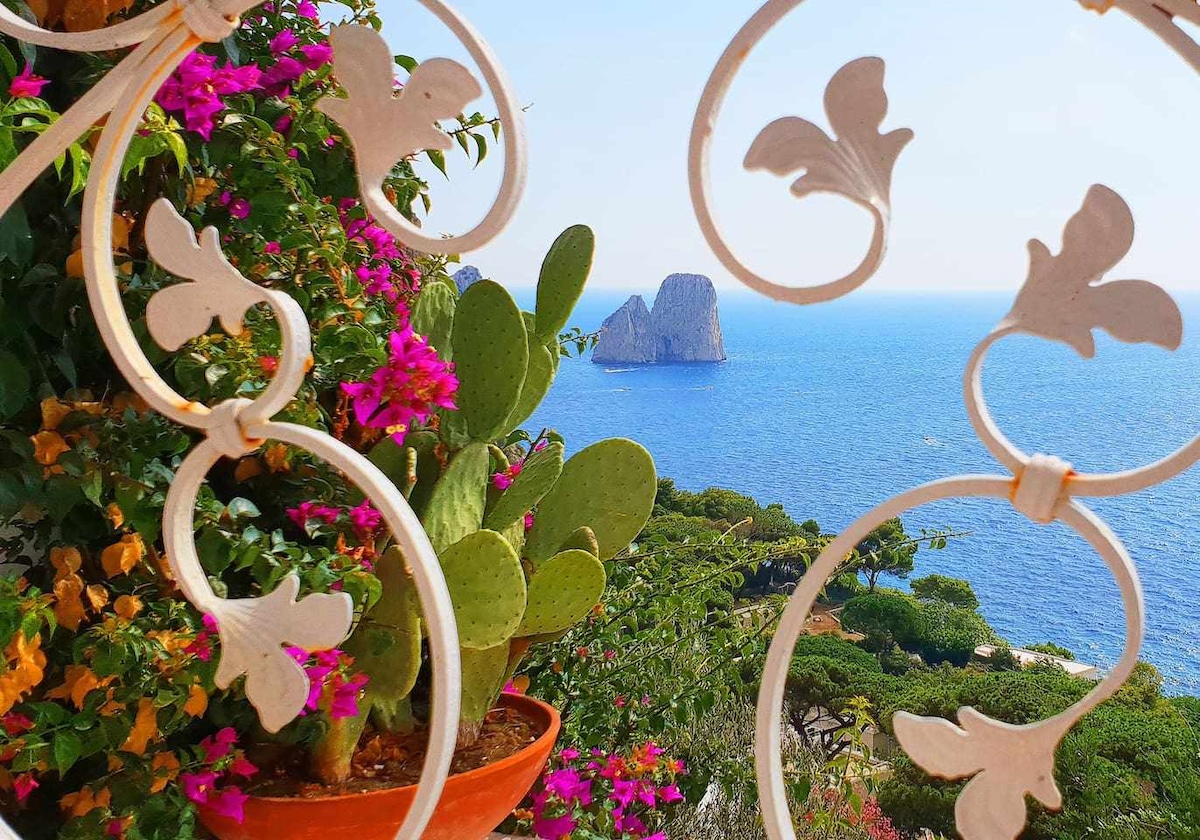
Capri, the blue island that has enchanted emperors and poets, is a global icon of Mediterranean luxury and style, famous for its Faraglioni rocks and the legendary Piazzetta. It is an unparalleled elite market attracting high-profile international clients seeking exclusivity, wild nature, and dreamlike views. The Airbnb market is extraordinarily profitable here, featuring an average daily rate of €494. Visitors seek the charm of old-town apartments and the exclusivity of whitewashed villas nestled in Mediterranean scrub, generating an annual revenue of €97,959. Its legendary image ensures high-profile demand.
Featured Listings
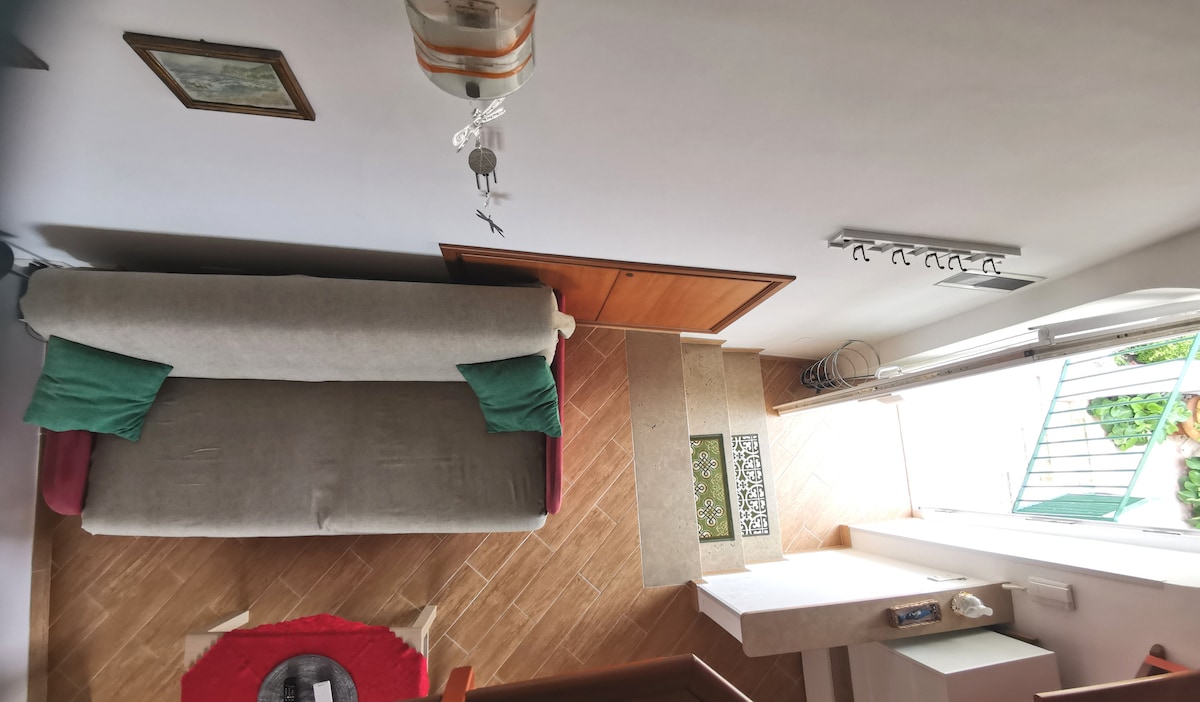

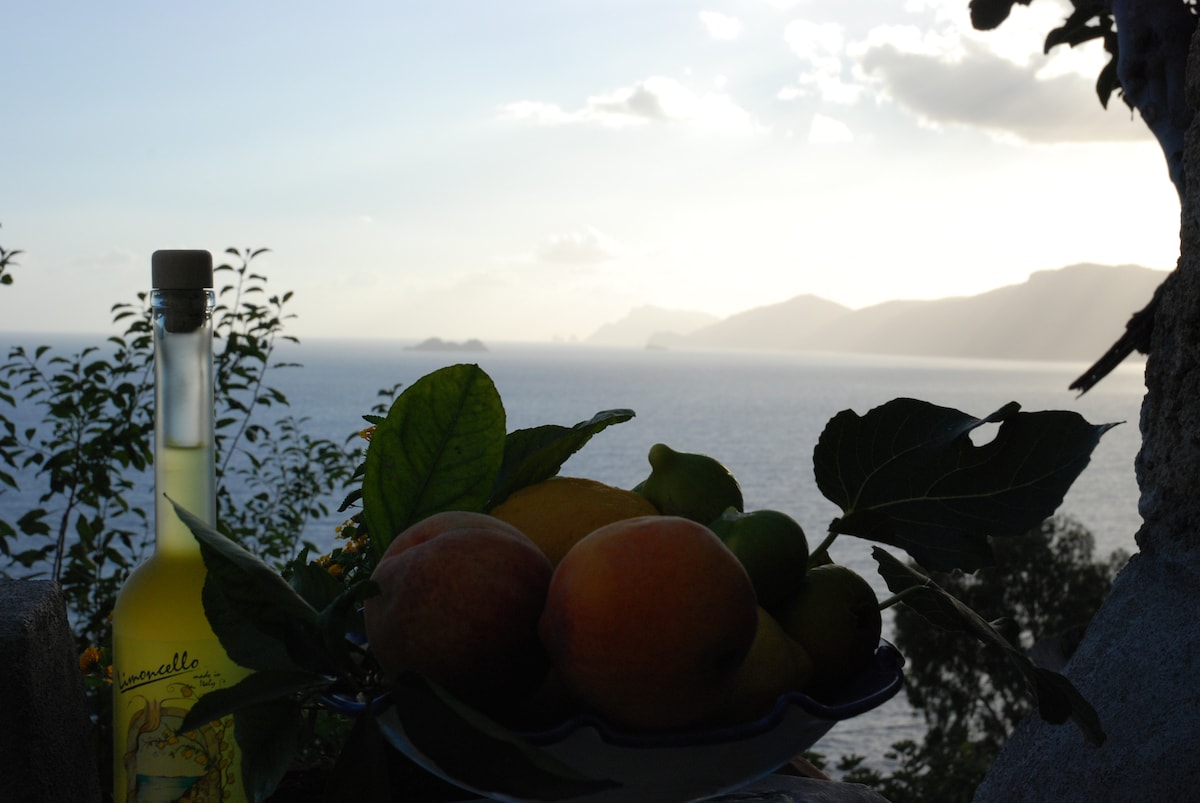
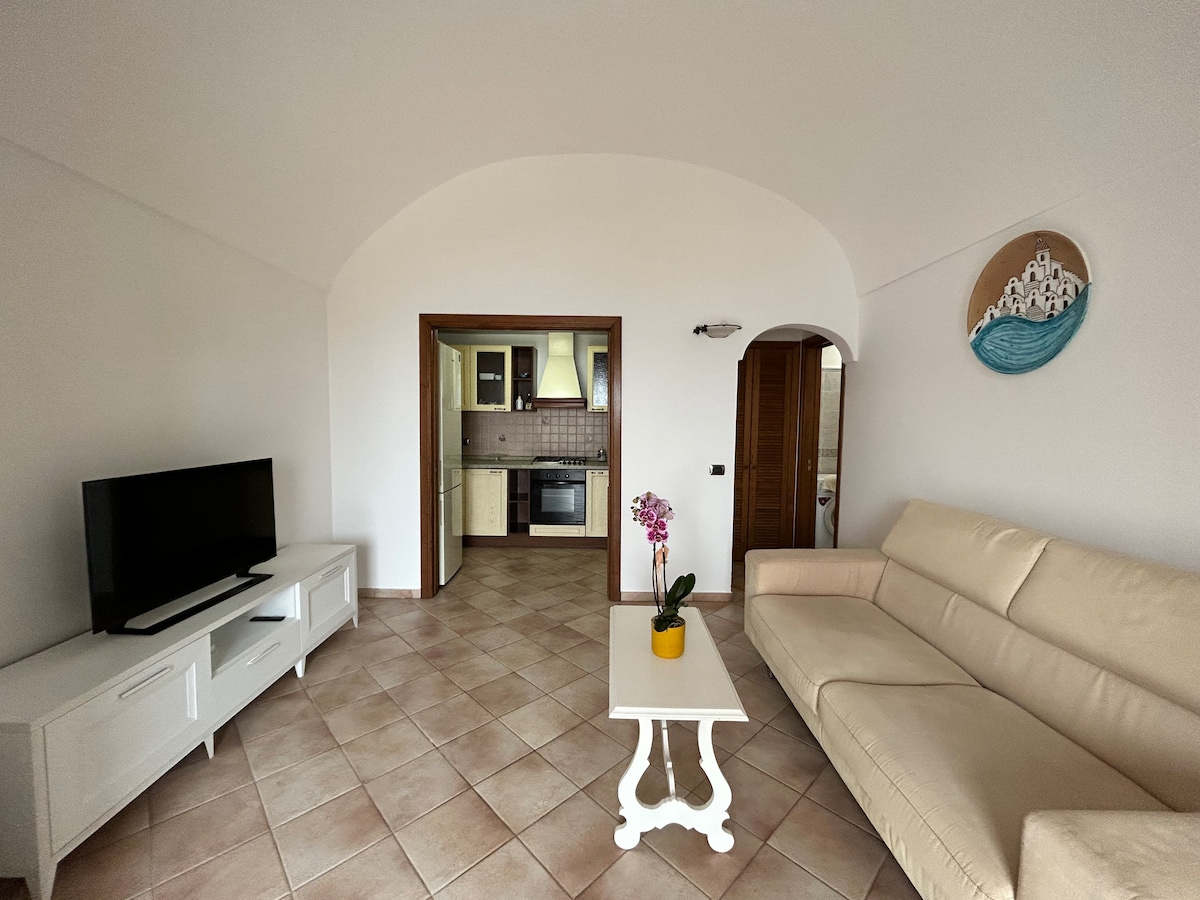
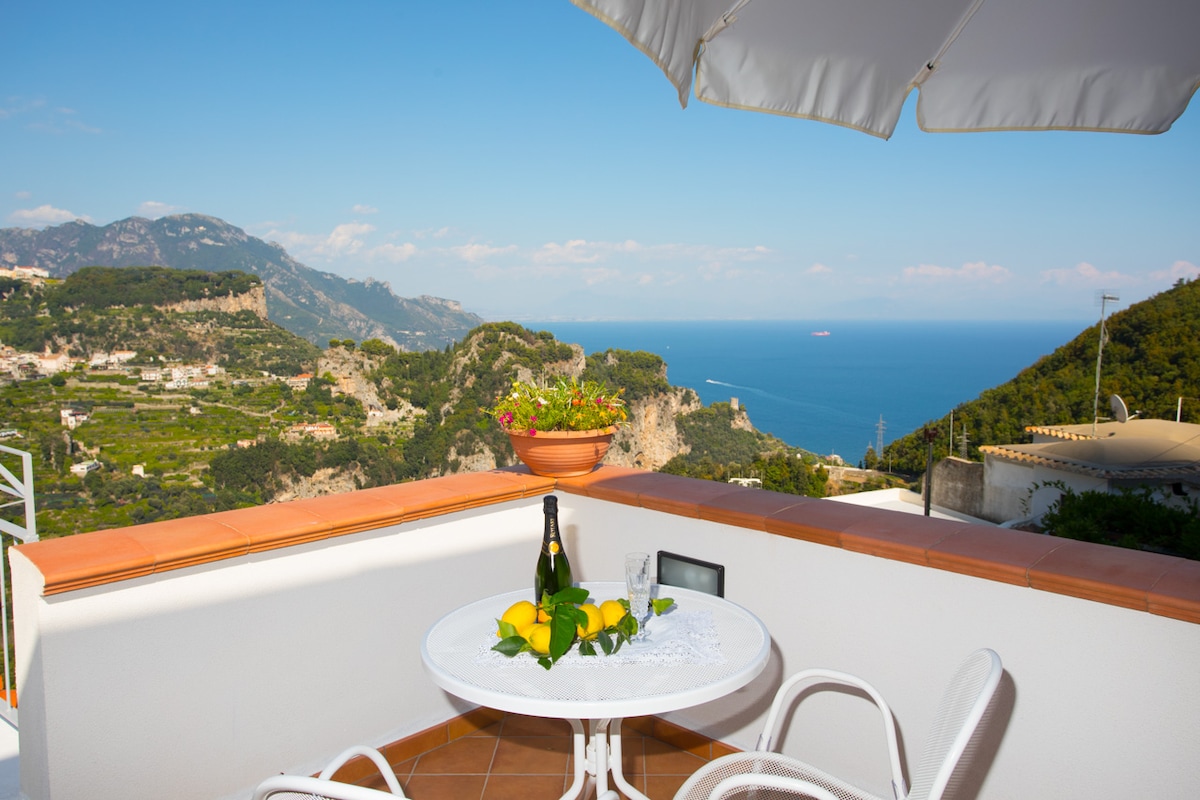
Praiano, the village of the sun nestled between Amalfi and Positano, offers an atmosphere of peace and rare authenticity on the coast, famous for its breathtaking sunsets and whitewashed houses. It is a prestigious destination attracting international tourism seeking relaxation, spectacular trails like the Path of the Gods, and infinite views. The rental market is extraordinarily profitable here, featuring an average daily rate of €423. Visitors seek exclusive cliffside apartments with terraces and the charm of traditional residences, generating an annual revenue of €100,037. Its serene beauty ensures high-level demand.
Featured Listings

Amalfi, the ancient Maritime Republic that gives its name to the Divine Coast, enchants with its Moorish cathedral, stone alleys, and the scent of Amalfi lemons. It is a legendary destination attracting international tourism seeking history, crystal-clear waters, and the pure essence of the Mediterranean. The Airbnb market is very powerful here, featuring an occupancy rate of 60%. Visitors seek the charm of historic city-center apartments and the exclusivity of residences overlooking the tiny harbor, paying an average daily rate of €317. Its central coast location and world-class fame ensure high and consistent profitability.
Featured Listings
Salerno is a vibrant city rich in history, merging its glorious Medical School past with modern urban energy and its role as the gateway to the Cilento and Amalfi Coasts. Between the Trieste Promenade and the Luci d'Artista festival, it attracts international tourism and a strong professional clientele year-round. The Airbnb market is very efficient here, featuring an occupancy rate of 59%. Visitors appreciate elegant city-center apartments and modern rentals well-connected to the station and harbor, paying an average daily rate of €120. Its role as a logistical and tourism hub ensures consistent year-round profitability for owners.
Featured Listings
Maiori, located in a wide valley with the longest beach on the Amalfi Coast, enchants with its noble palaces, coastal towers, and the Lemon Path connecting it to Minori. It is a welcoming and spacious seaside destination, ideal for families and those seeking convenience without sacrificing the charm of the Divine Coast. The Airbnb market is very active here, featuring an occupancy rate of 58%. Visitors appreciate modern apartments near the sea and holiday homes in historic districts, paying an average daily rate of €266. Its tourism energy and beautiful terrain ensure consistent year-round profitability for owners.
Featured Listings
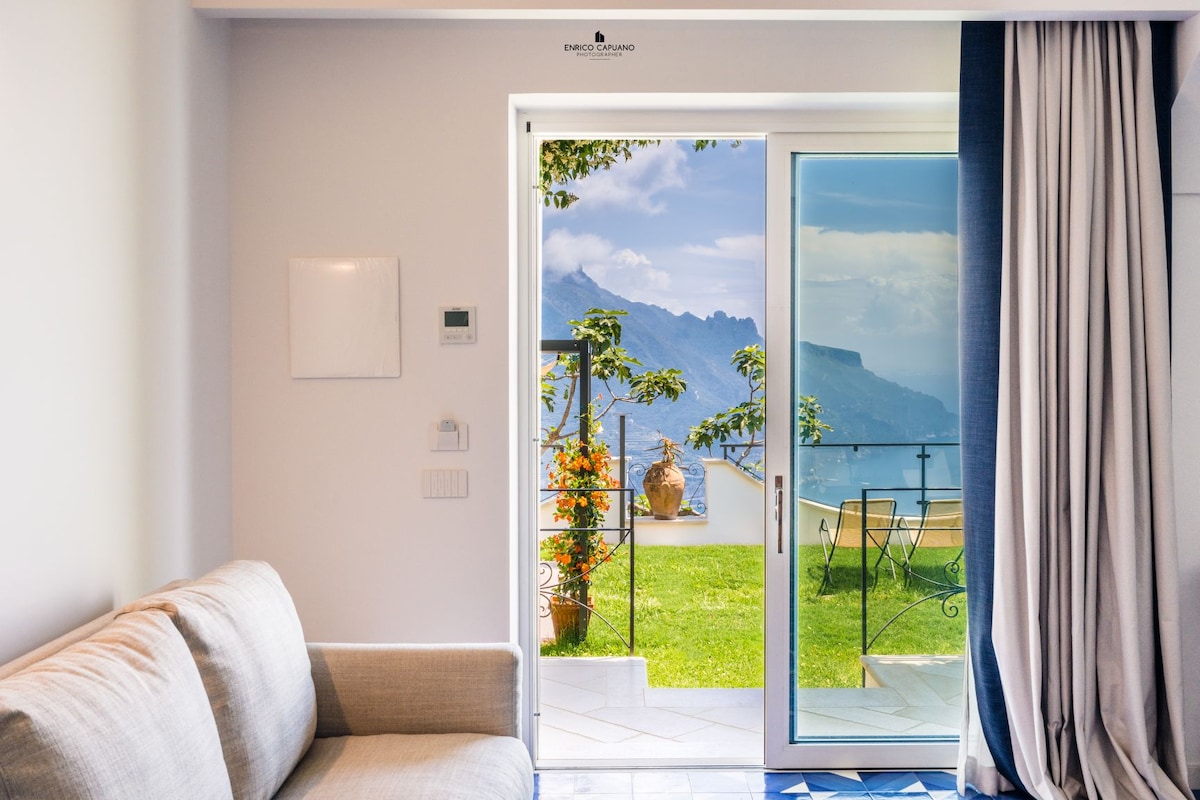
Ravello, the ‘City of Music’ suspended between sky and sea, is a destination of absolute enchantment famous for Villa Rufolo, Villa Cimbrone, and its infinite views over the Amalfi Coast. It is an elite market attracting a sophisticated international clientele seeking peace, culture, and timeless beauty away from the coastal bustle. The rental market is extraordinarily profitable here, featuring an average daily rate of €387. Visitors seek exclusive apartments in historic palaces and the charm of residences nestled in hanging gardens, generating an annual revenue of €82,397. Its world-class prestige ensures high-level demand.
Featured Listings
Get Live Campania, Italy Market Intelligence
Discover detailed Campania, Italy Airbnb Analytics and explore real-time market data to make accurate investment decisions.
Explore Real-time Analytics