Airbnb Market Data in Gold Coast City, Queensland(July 2026)Occupancy, Revenue & Best Areas
In a competitive landscape like Gold Coast City, Queensland, understanding market dynamics is the key to outperforming other hosts. We’ve filtered through the top 6 locations to bring you a clear picture of the current short-term rental performance and local trends.
While these averages provide a reliable snapshot of the region, every property is unique. For a more granular view, including seasonal performance and competitor benchmarking, visit GuestFavorites to refine your strategy.
Gold Coast City Airbnb Market Map (July 2026)
Gold Coast City Market Performance
Period: July 2025 - June 2026
How Much Can You Earn with Airbnb in Gold Coast City?
One of the most common questions for potential Airbnb hosts in Gold Coast City is about earning potential. Let's break down the revenue patterns and what you can realistically expect to earn.
Monthly Revenue Trends in Gold Coast City
Top 6 Airbnb Markets in Gold Coast City
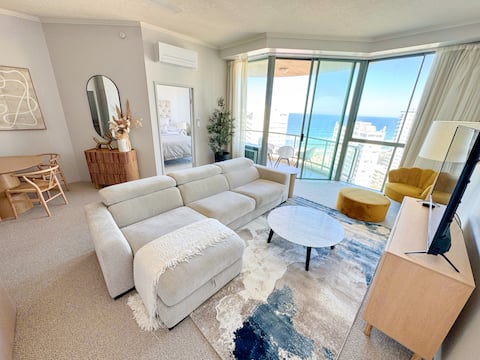
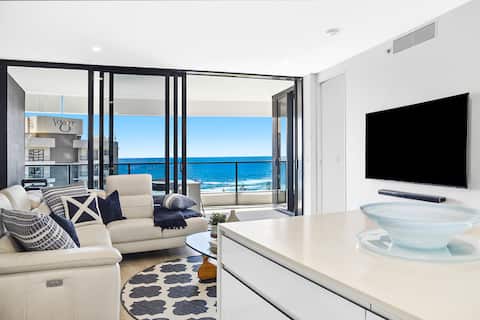
Surfers Paradise is the glittering heart of the Gold Coast, famous for its high-rise skyline, iconic beach, and non-stop energy. As a premier global tourist destination, it attracts a massive mix of domestic and international visitors year-round. The Airbnb market is incredibly powerful here, featuring 2,400 listings and a high occupancy rate of 73%. Visitors seek luxury high-rise apartments with ocean views and proximity to Cavill Avenue, driving an impressive annual revenue of A$97,795. Its status as a holiday icon ensures a highly lucrative and dynamic environment for hosts.
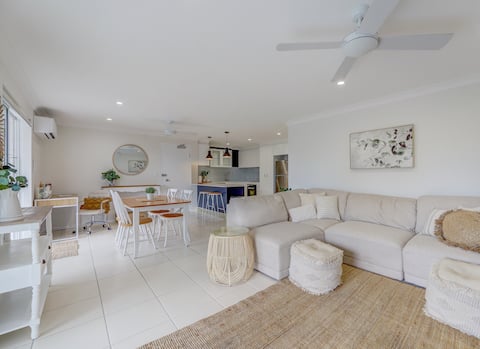
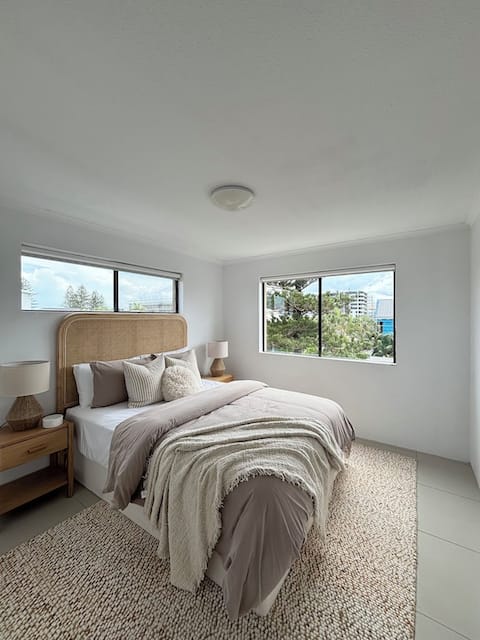
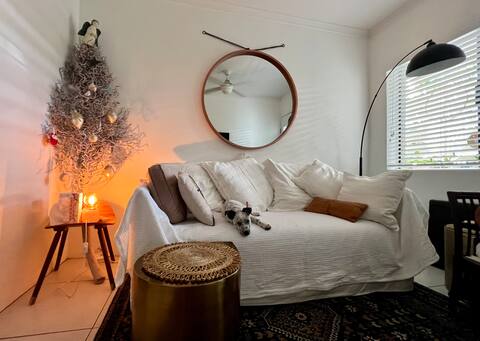
Featured Listings
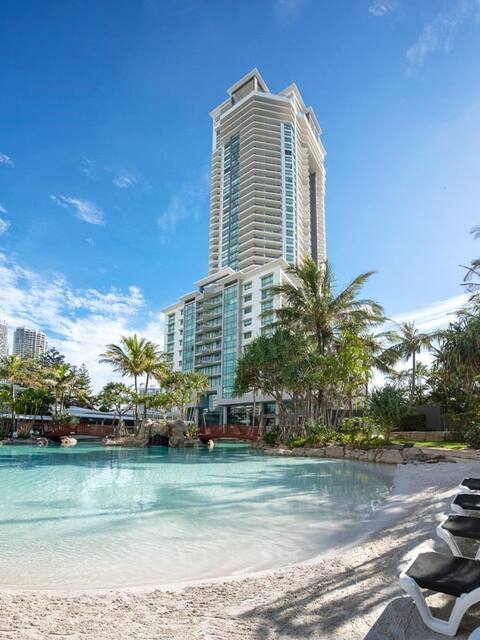
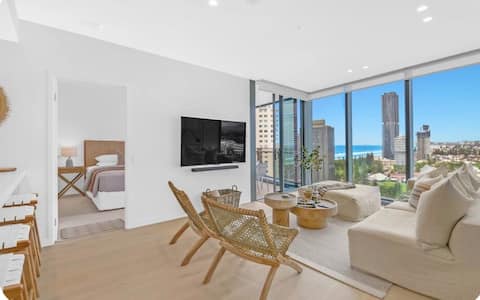
Broadbeach is the stylish and sophisticated neighbor to Surfers Paradise, known for its premium dining scene, upscale shopping at Pacific Fair, and the Star Casino. It offers a slightly more relaxed but equally luxurious coastal experience. The vacation rental market is high-performing, with an average daily rate of A$373. Visitors seek modern high-rise apartments with ocean views and easy access to the convention center, generating a strong annual revenue of A$97,842. Its appeal to both business and leisure travelers ensures consistent demand and high profitability throughout the year.
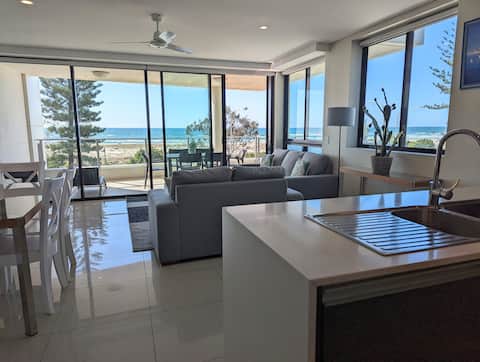
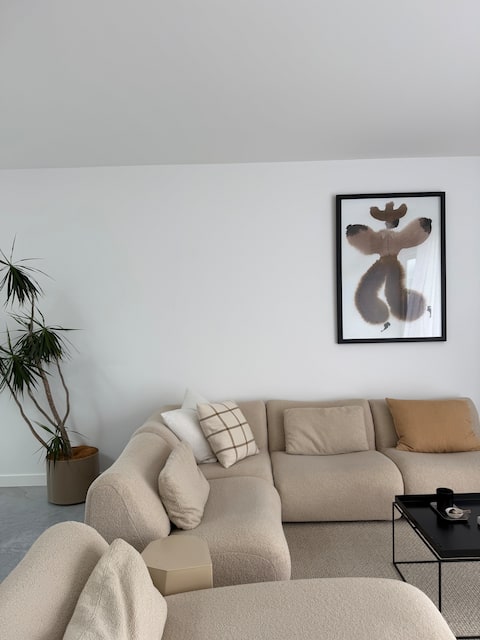
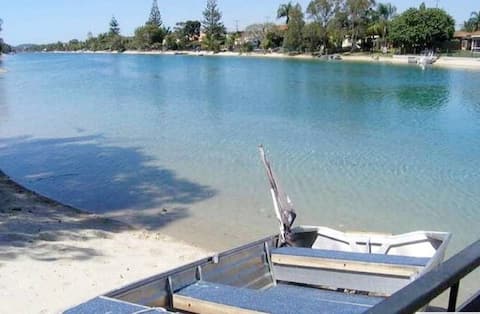
Featured Listings
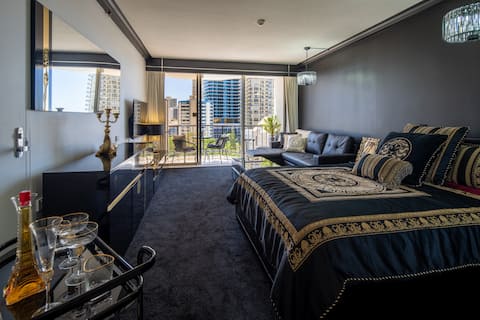
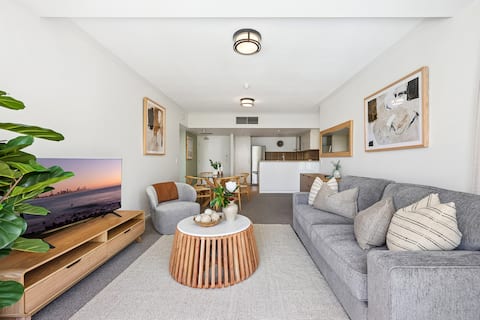
Burleigh Heads is the Gold Coast’s cool and cultural hub, beloved for its world-class surf break, iconic headland, and thriving boutique and dining scene. It blends a nostalgic surf-town vibe with modern sophistication, attracting a trendy and loyal crowd. The Airbnb market is high-performing, with an average daily rate of A$400. Visitors seek stylish beach apartments and character homes within walking distance of James Street, generating an annual revenue of A$94,253. Its unique “Burleigh vibe” and stunning natural setting ensure it remains a top-tier destination for both locals and tourists.
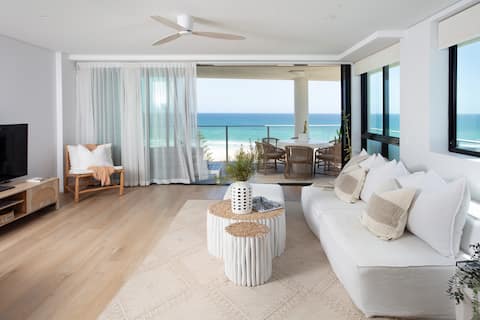
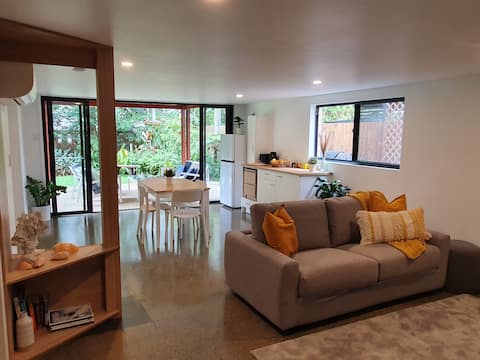
Featured Listings
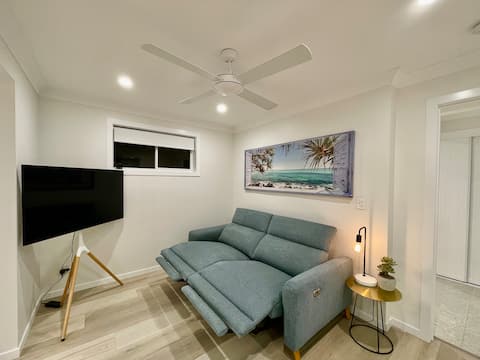
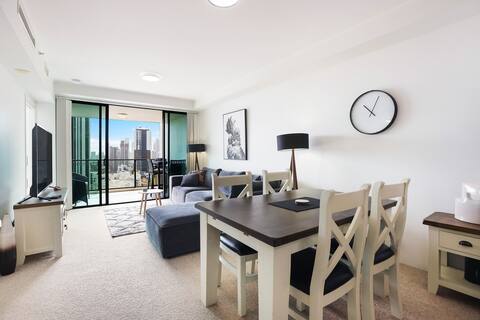
Coolangatta, the southernmost tip of the Gold Coast, offers a unique blend of world-class surf breaks and a relaxed seaside atmosphere that feels worlds away from the hustle of Surfers Paradise. Famous for the legendary waves at Snapper Rocks and Rainbow Bay, it attracts a dedicated surfing community and families seeking pristine north-facing beaches. The Airbnb market here is exceptionally robust, featuring a 64% occupancy rate. Visitors seek high-rise apartments with panoramic ocean views and trendy coastal units, generating a substantial annual revenue of A$88,483. Its status as a premier holiday destination with a laid-back vibe ensures consistent year-round demand.
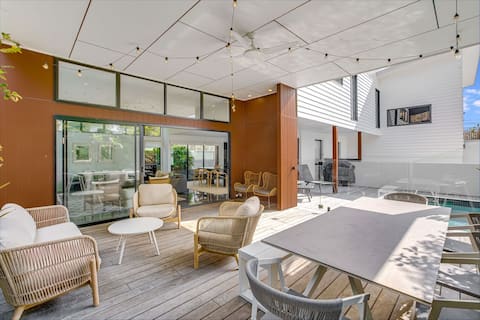
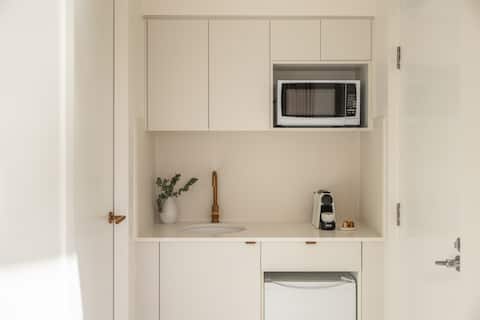
Featured Listings
Mermaid Beach is an exclusive residential enclave on the Gold Coast, prized for its golden sands, boutique cafes, and ‘Millionaire’s Row’ beachfront prestige. It offers a more sophisticated and peaceful alternative to its busier neighbors, attracting high-end travelers and families looking for coastal luxury. The vacation rental market is high-performing, boasting a 68% occupancy rate and a strong average daily rate of A$345. Guests seek stylish beach houses and upscale apartments, contributing to a remarkable annual revenue of A$85,782. Its blend of upscale tranquility and proximity to the city’s best dining makes it a prime choice for high-yield rental property.
Featured Listings
Palm Beach is the Gold Coast’s rising star, known for its pristine beaches, beautiful estuaries, and a rapidly growing scene of trendy cafes and bars. It offers a more authentic and less crowded coastal experience compared to its northern neighbors. The vacation rental market is performing strongly, with an occupancy rate of 67%. Travelers seek modern beach houses and stylish new apartments, generating an annual revenue of A$101,446. Its combination of natural beauty and a cool, local vibe makes it a highly desirable destination for travelers seeking a modern Gold Coast getaway.
Featured Listings
Get Live Gold Coast City, Queensland Market Intelligence
Discover detailed Gold Coast City, Queensland Airbnb Analytics and explore real-time market data to make accurate investment decisions.
Explore Real-time Analytics