Best Airbnb Markets in Queensland, Australia
Maximizing your returns in Queensland, Australia depends on choosing the right location with proven demand. We have carefully reviewed the top 10 markets to help you spot emerging trends and high-performing zones for your Airbnb portfolio.
While this data gives you a solid market-wide perspective, successful investing requires property-specific due diligence. For the most accurate filters, occupancy heatmaps, and revenue breakdowns, use GuestFavorites.
Queensland Airbnb Market Map (May 2026)
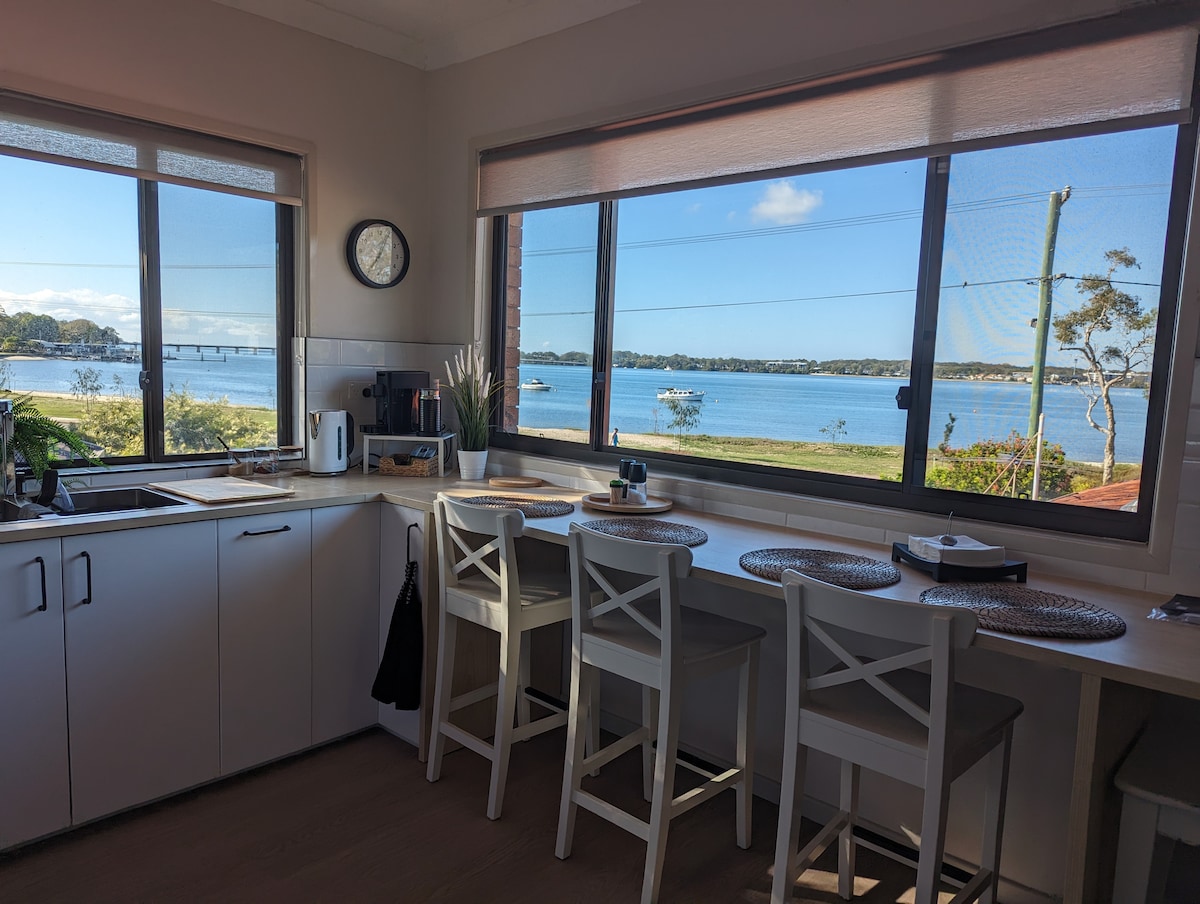
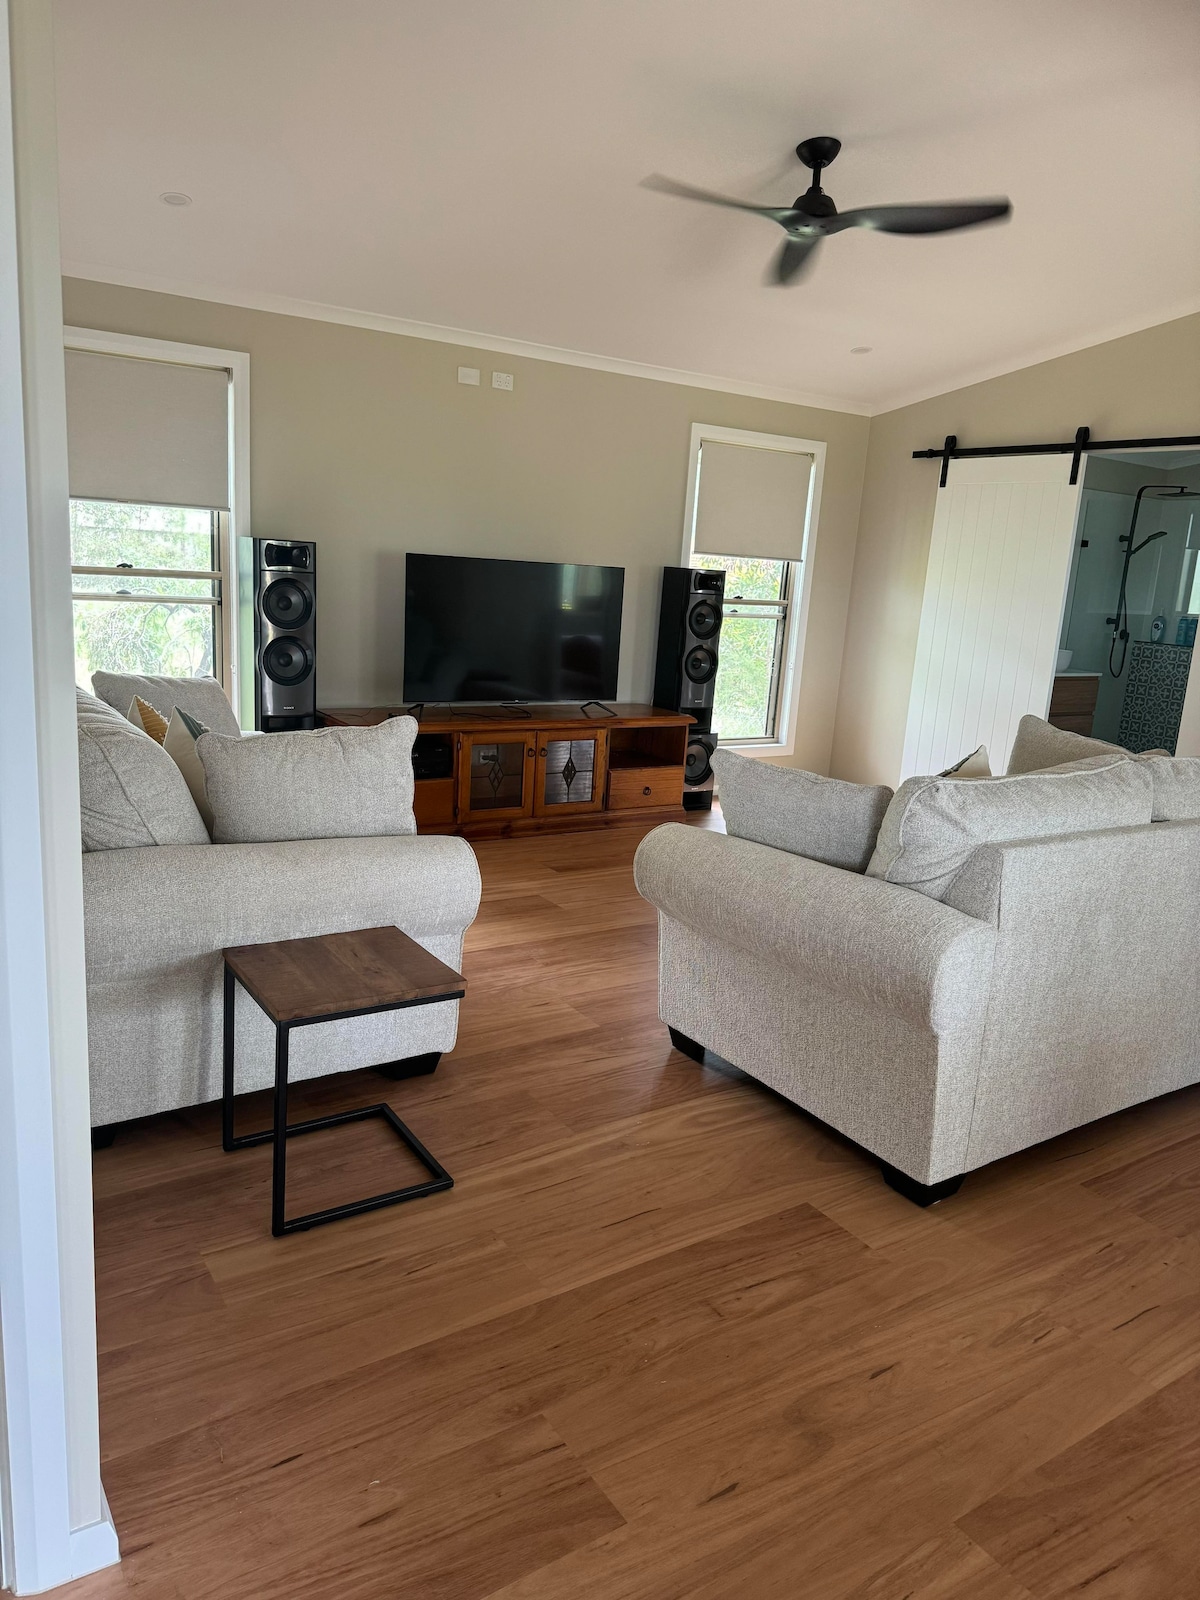
Greater Brisbane is a dynamic and rapidly growing market, blending urban sophistication with a relaxed outdoor lifestyle. As the capital of Queensland, it attracts a diverse mix of business travelers and tourists drawn to its world-class museums, vibrant dining scenes like Howard Smith Wharves, and proximity to Moreton Bay. The short-term rental market is robust, featuring over 6,165 listings and a strong occupancy rate of 65%. Travelers favor stylish city apartments and character homes in leafy suburbs, providing hosts with a consistent annual revenue of A$64,540.
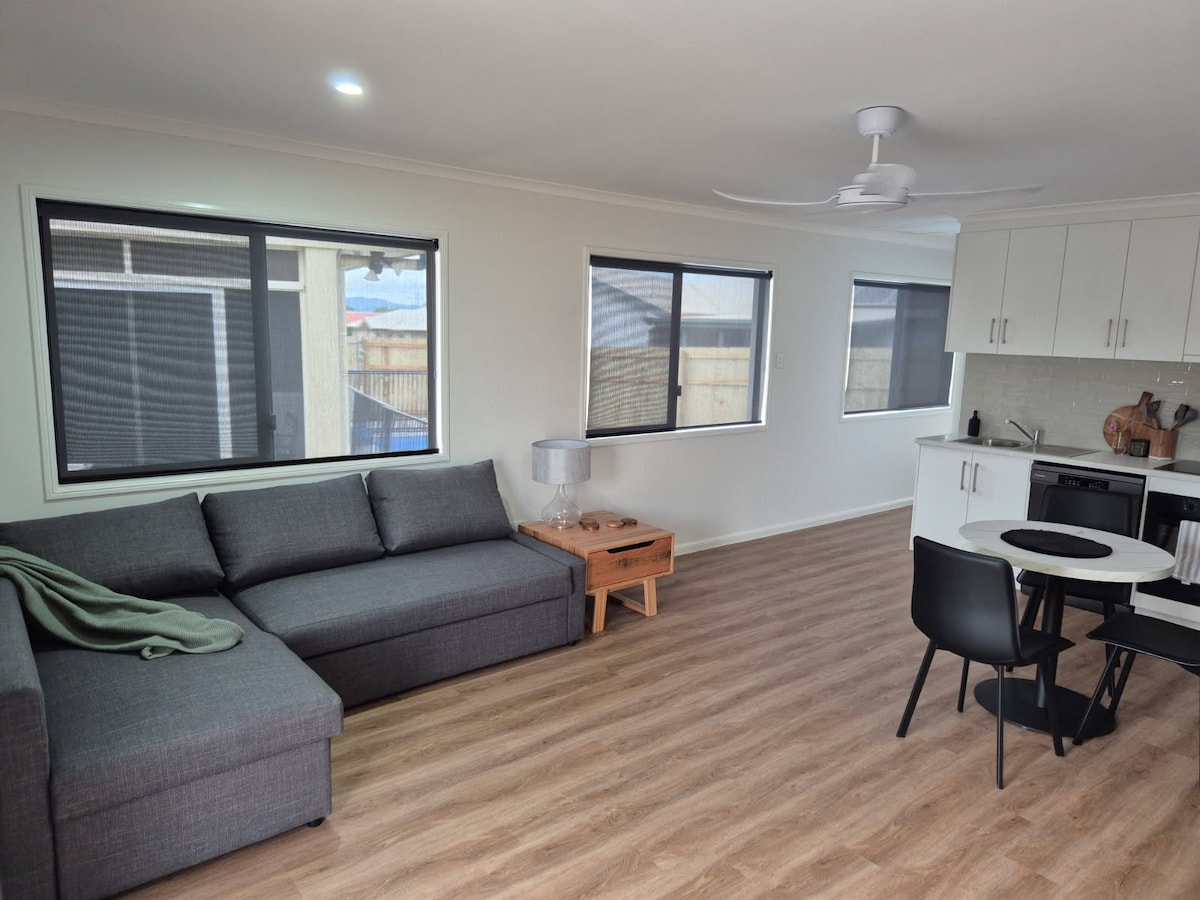
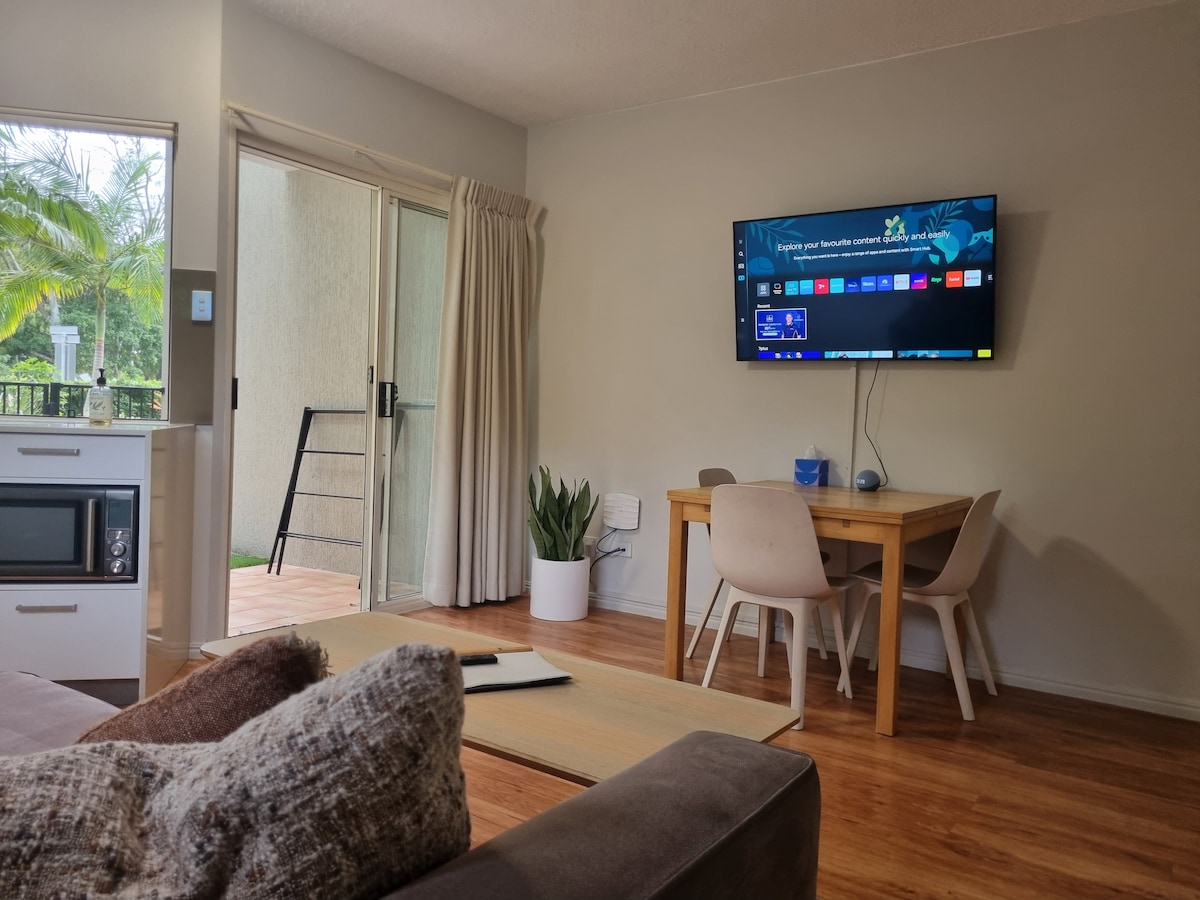
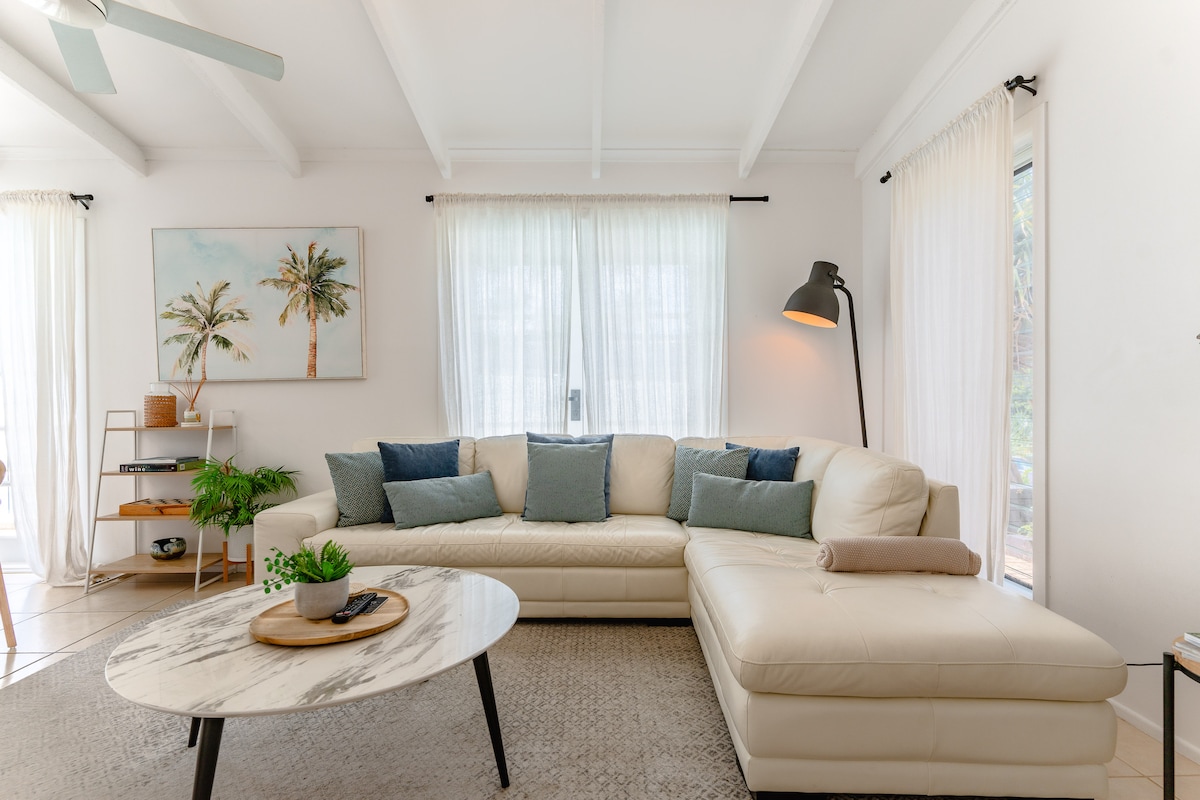
Featured Listings

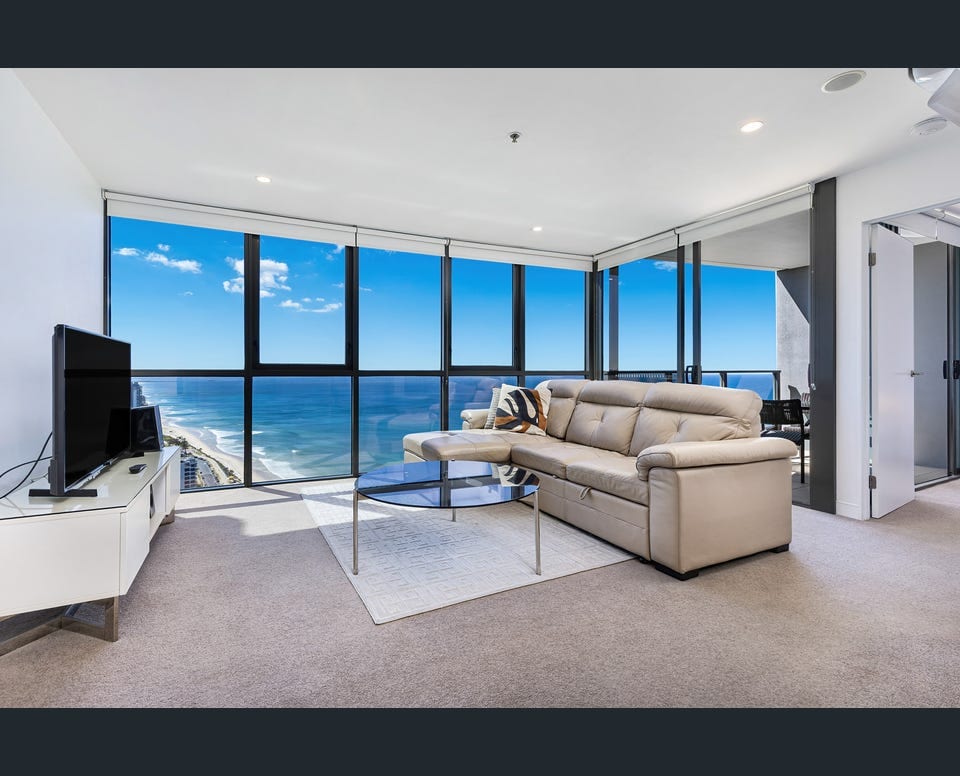
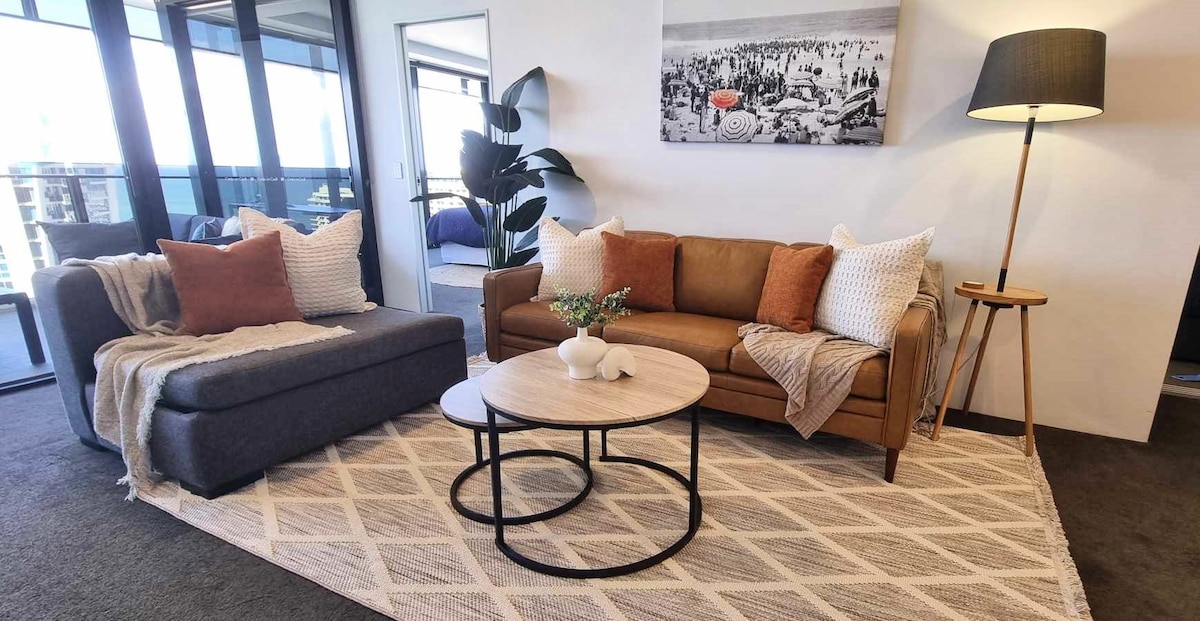
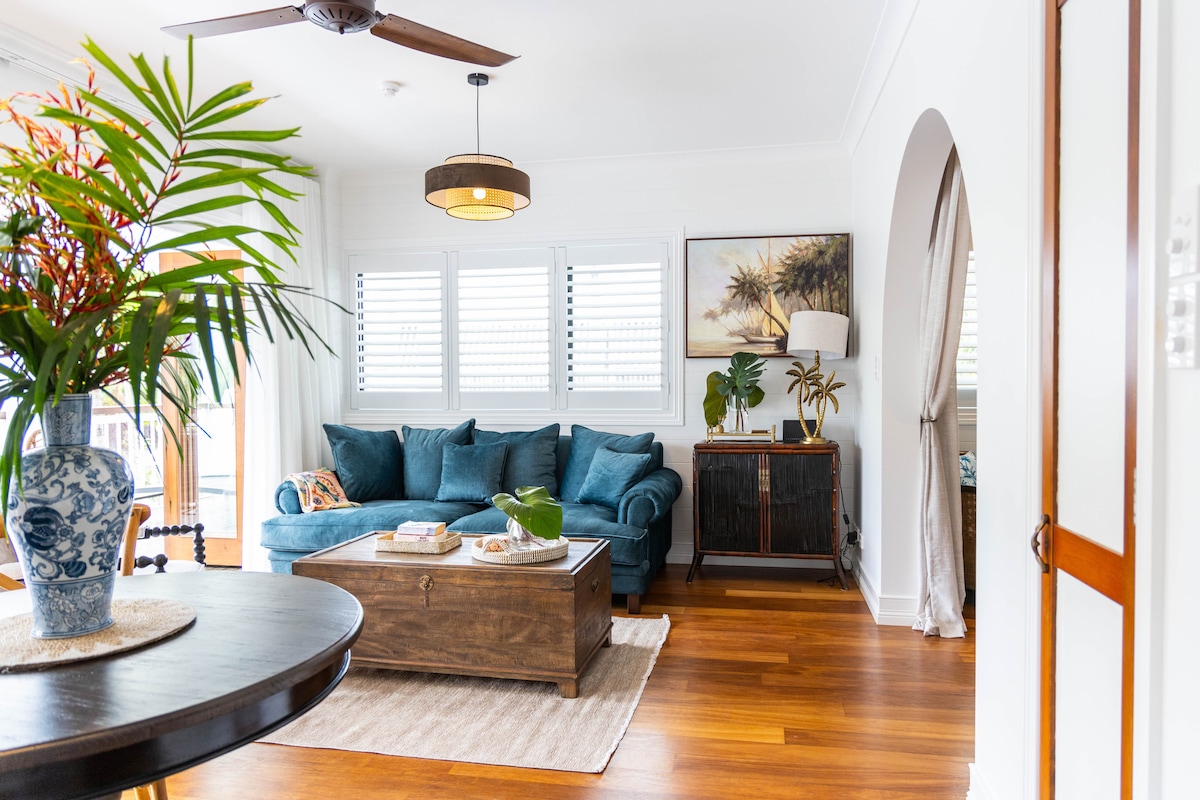
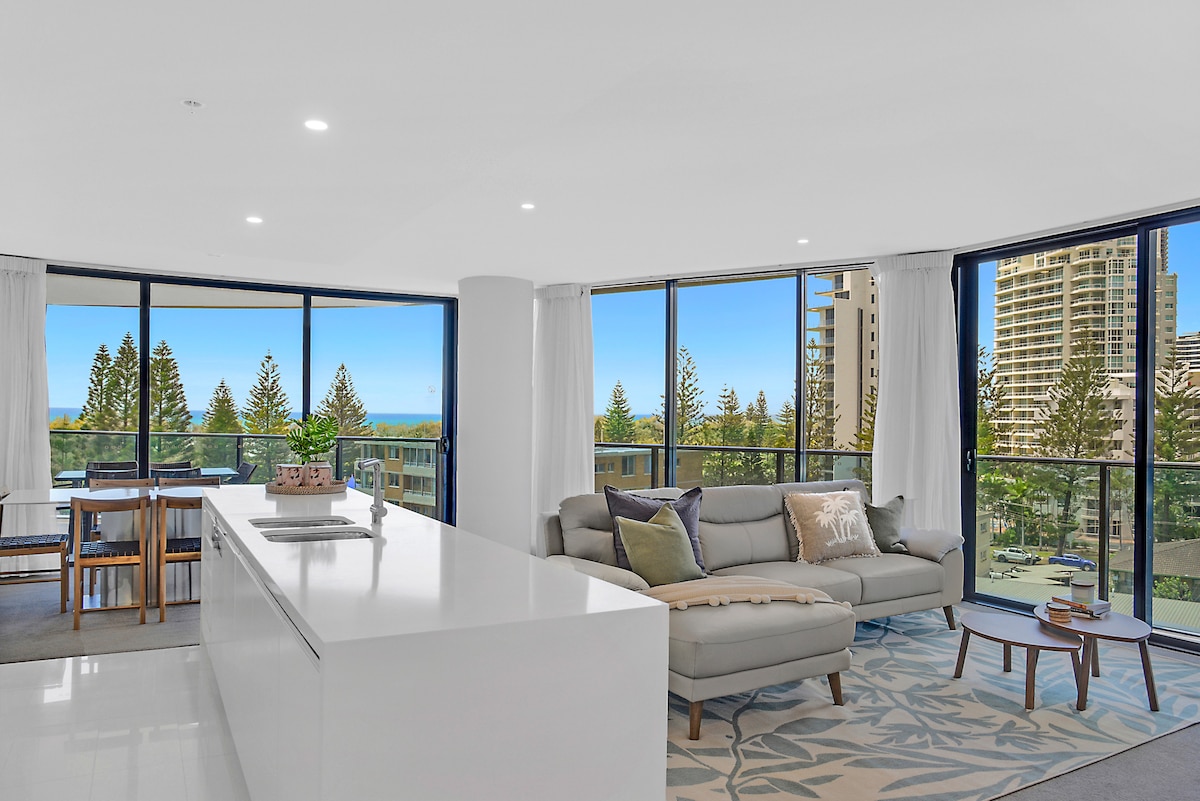
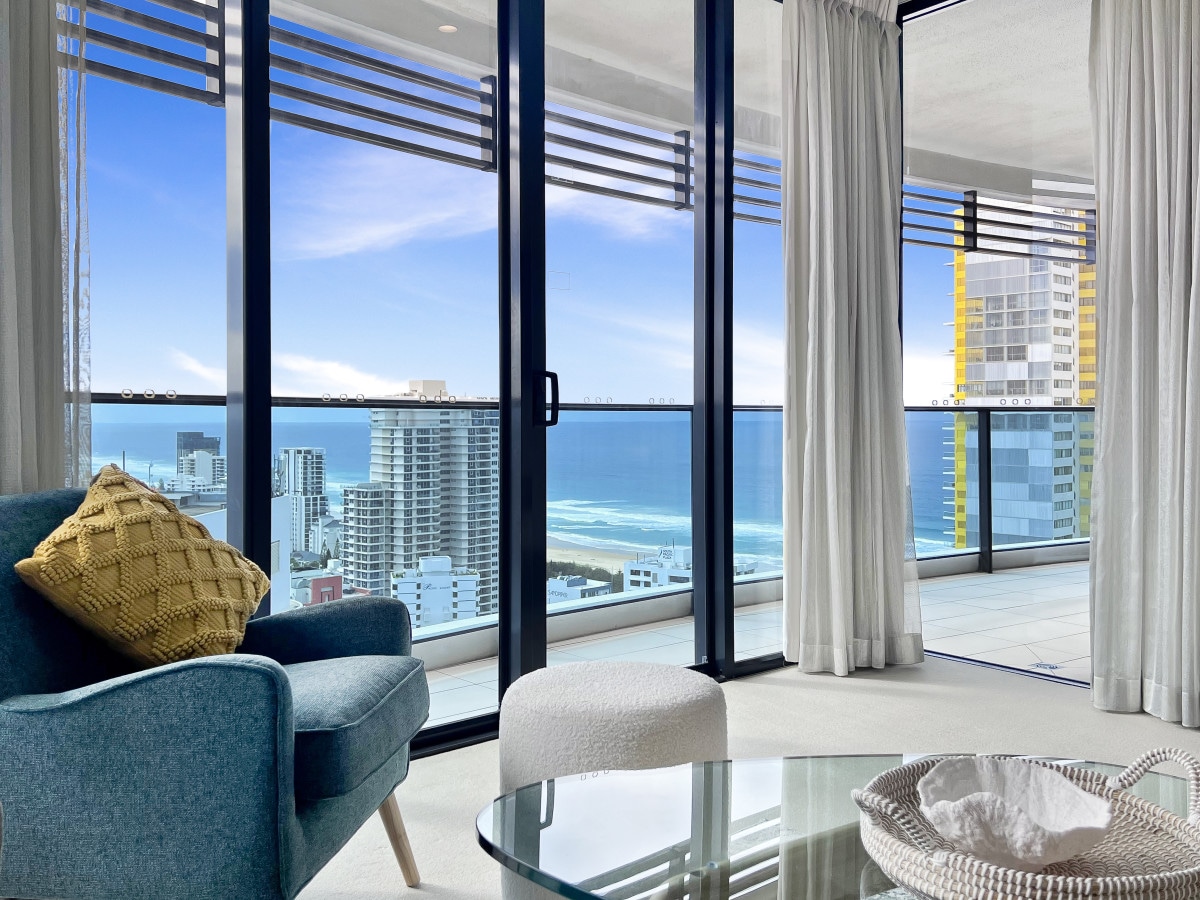
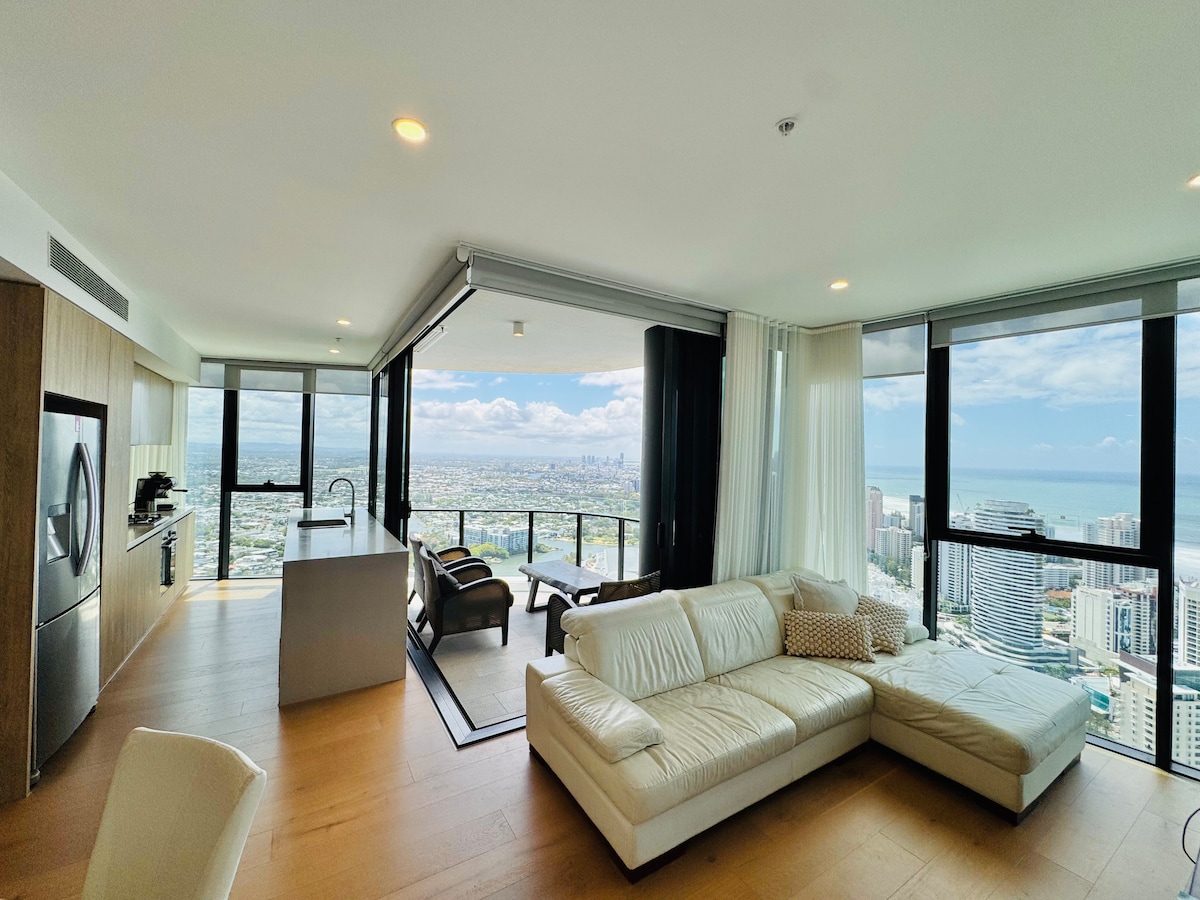
Surfers Paradise is the glittering heart of the Gold Coast, famous for its high-rise skyline, iconic beach, and non-stop energy. As a premier global tourist destination, it attracts a massive mix of domestic and international visitors year-round. The Airbnb market is incredibly powerful here, featuring 2,403 listings and a high occupancy rate of 71%. Visitors seek luxury high-rise apartments with ocean views and proximity to Cavill Avenue, driving an impressive annual revenue of A$98,360. Its status as a holiday icon ensures a highly lucrative and dynamic environment for hosts.
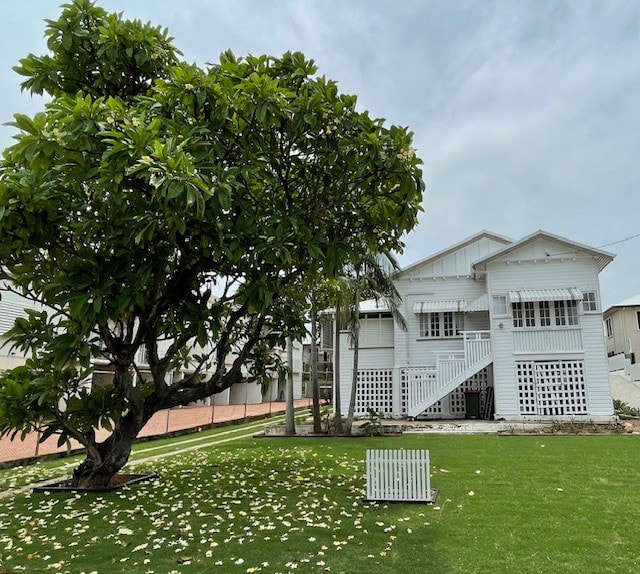
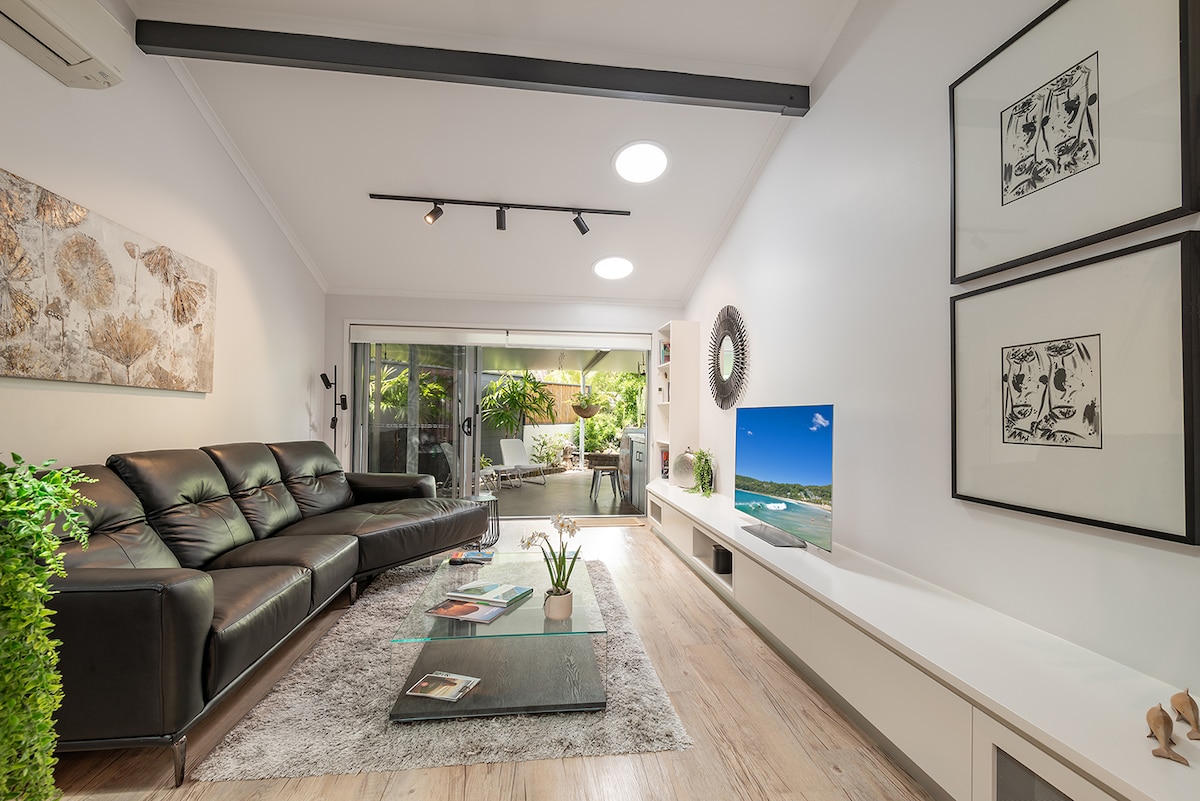
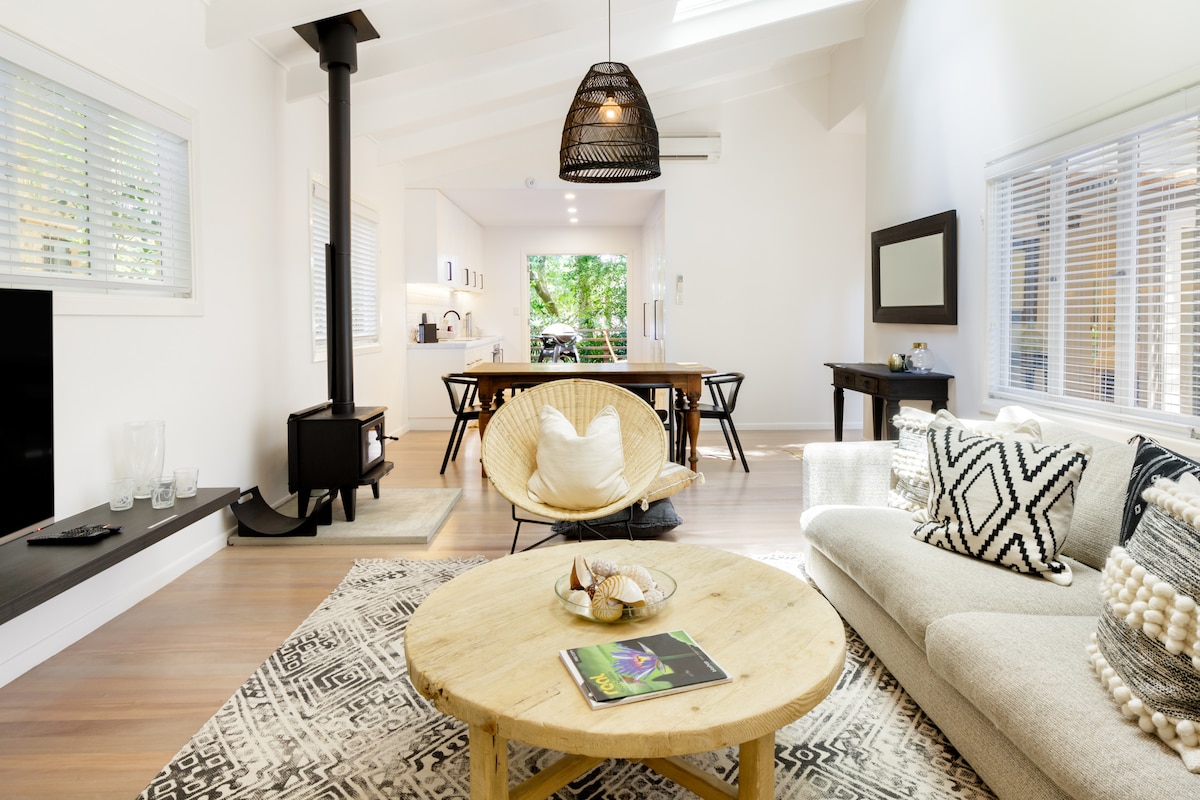
Featured Listings

The Cairns Regional market is the adventure capital of Australia, serving as the primary gateway to the Great Barrier Reef and the Wet Tropics Rainforest. It attracts a global crowd seeking tropical experiences, reef tours, and world-class diving. The short-term rental market is very dynamic, with an occupancy rate of 65%. Travelers favor resort-style apartments and tropical holiday homes, resulting in an average annual revenue of A$76,451. Its status as a bucket-list destination for international travelers ensures high demand and consistent rental performance throughout the year.
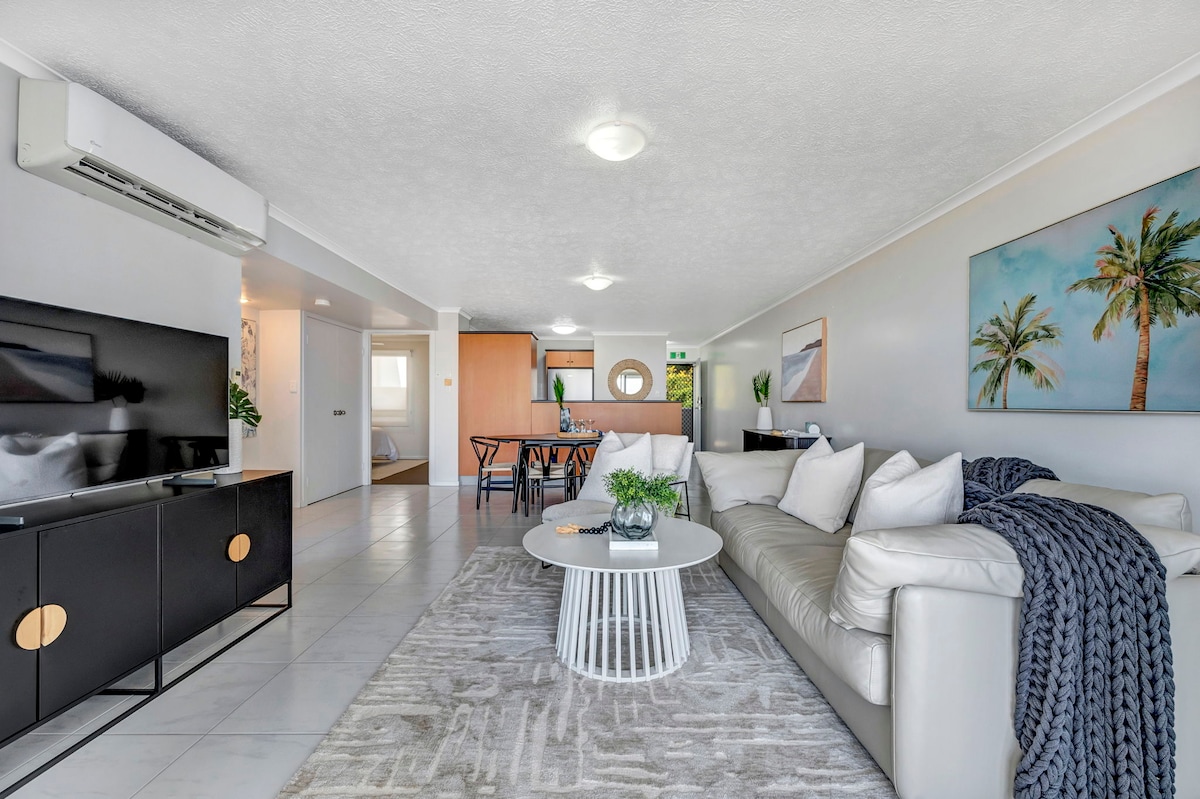
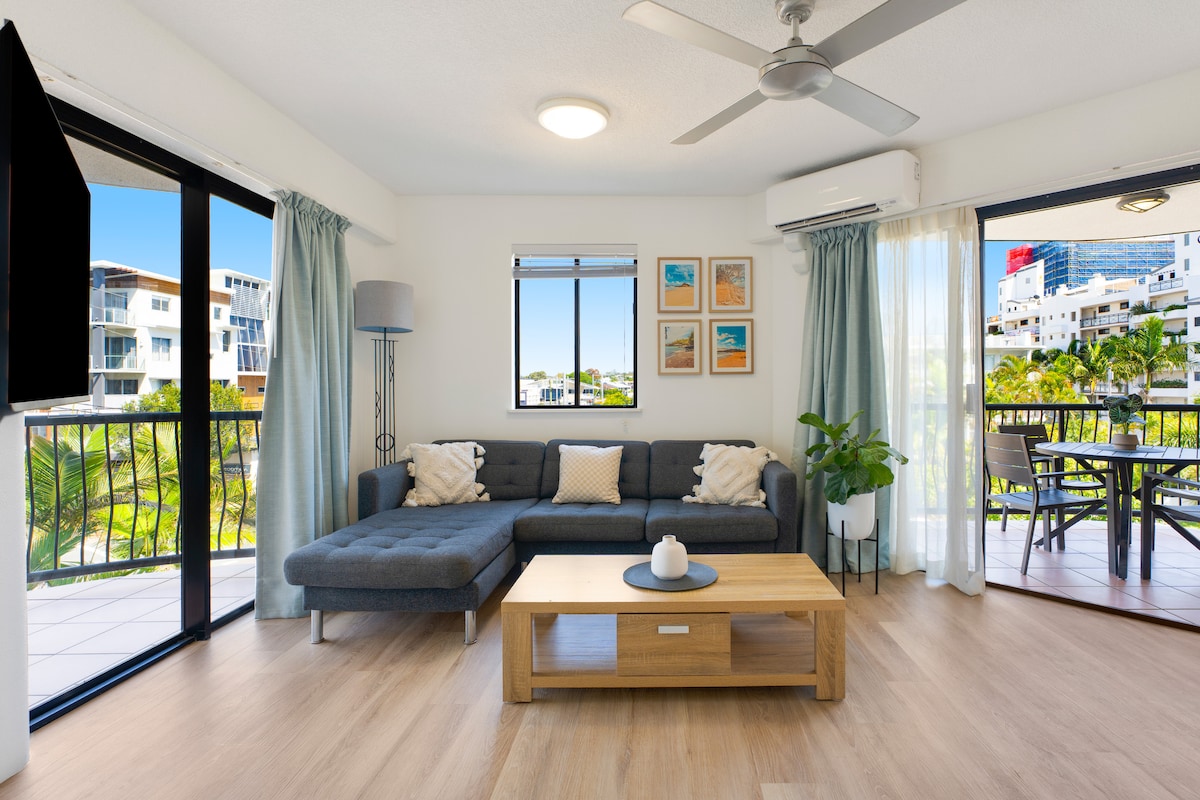
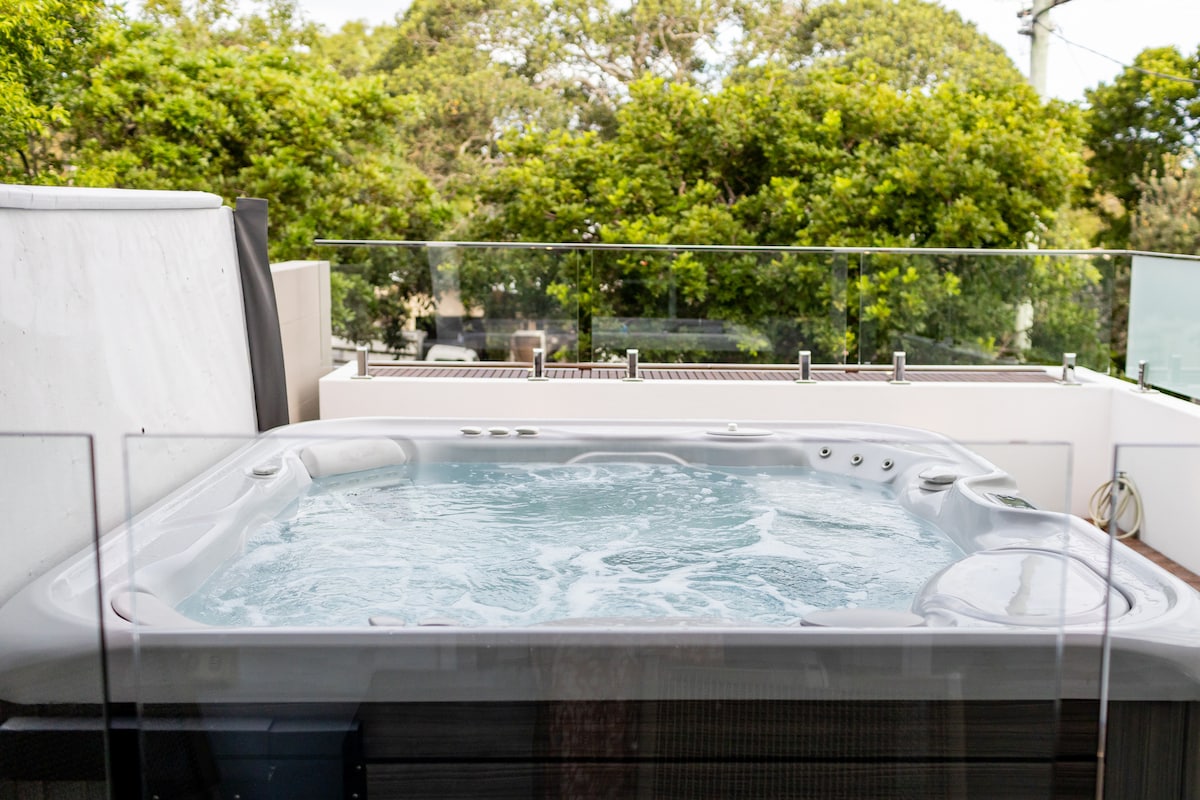
Featured Listings
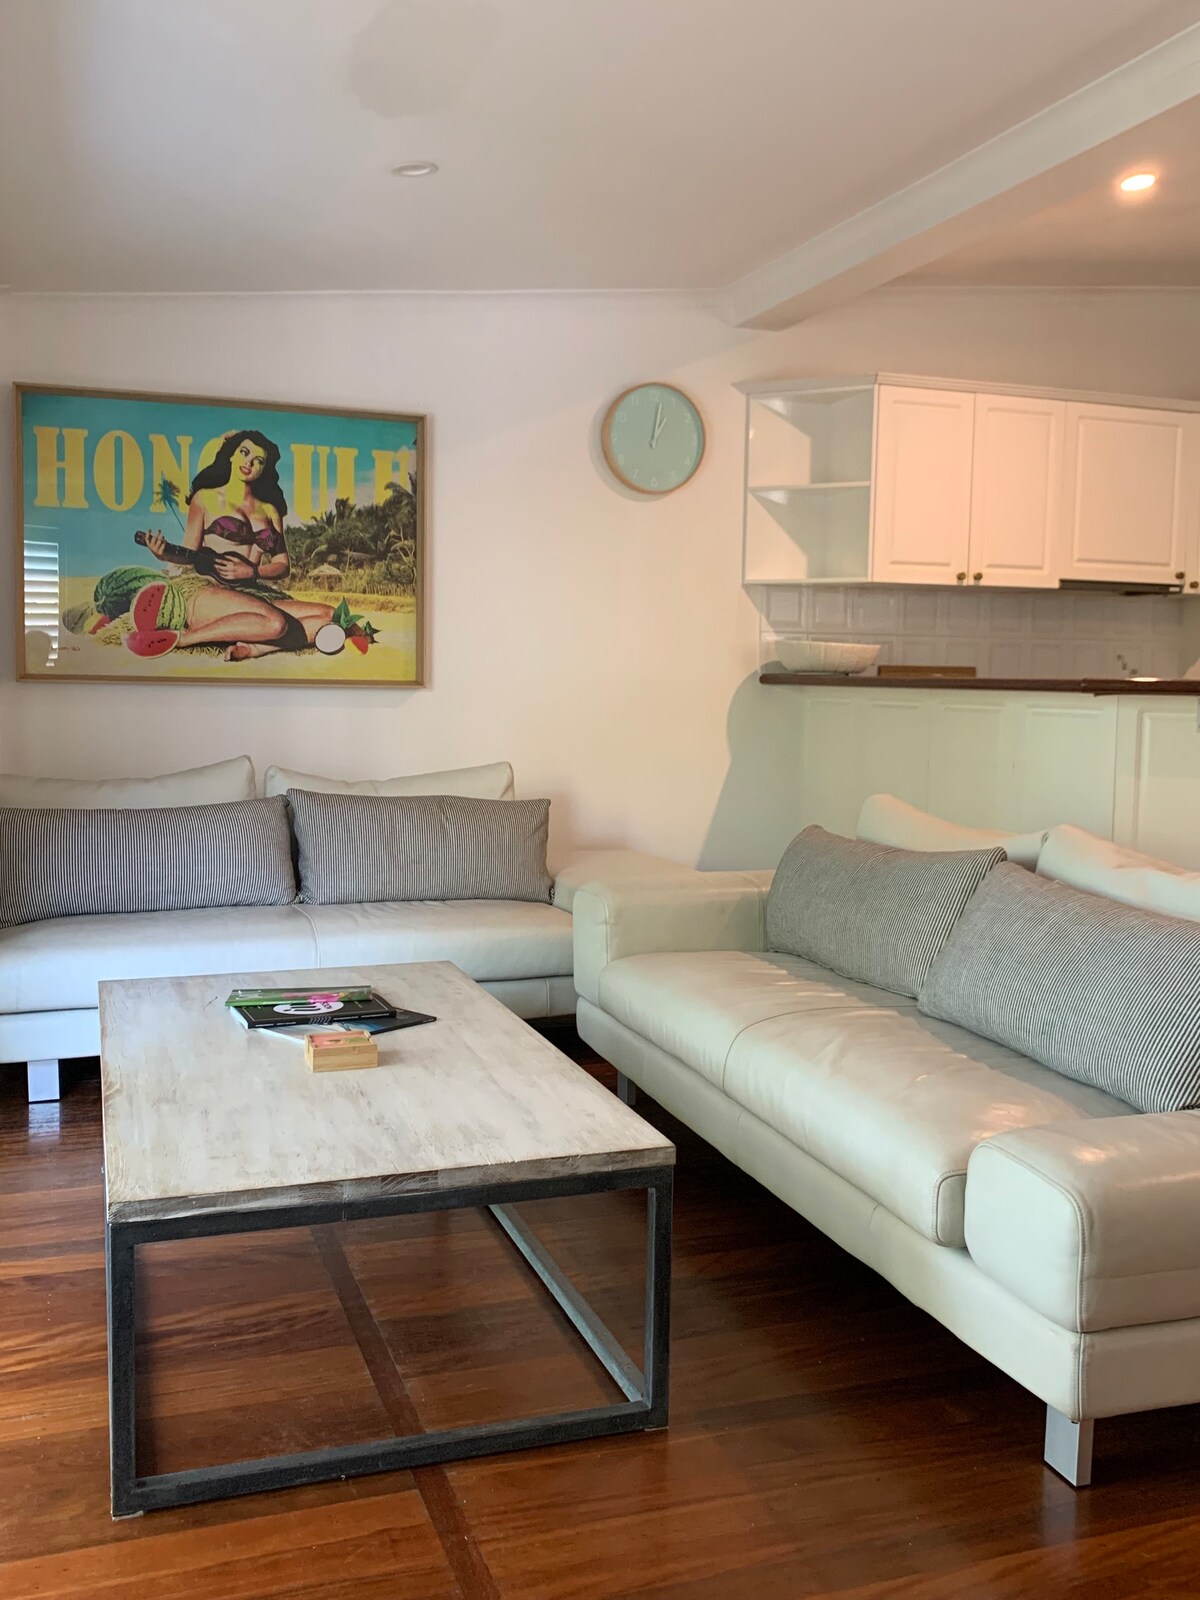
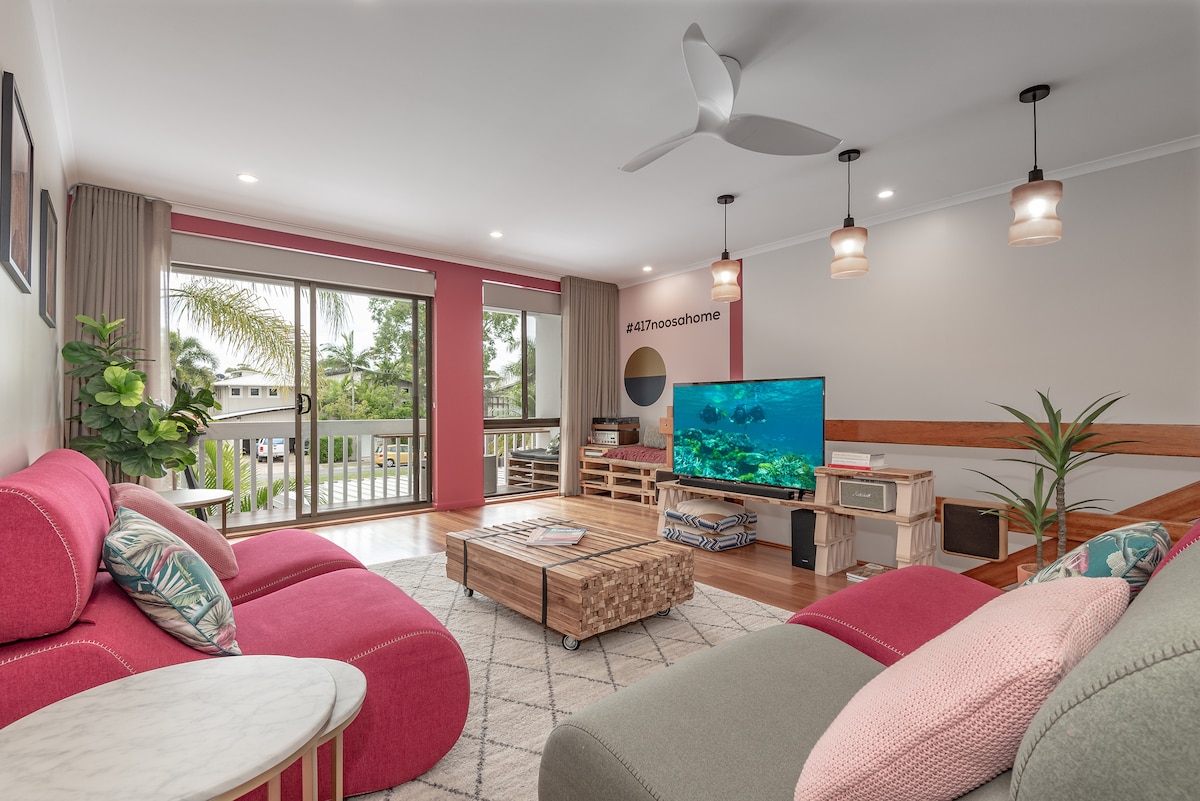
Noosa Heads is the jewel of the Sunshine Coast, blending sophisticated chic with breathtaking natural beauty. From the trendy boutiques of Hastings Street to the pristine sands of Main Beach and the National Park, it is a high-end destination that commands premium prices. The short-term rental market is exceptional, with an average daily rate of A$614. Visitors seek luxury holiday homes and stylish apartments, providing hosts with a substantial annual revenue of A$151,722. Its unique blend of upscale lifestyle and coastal serenity ensures a loyal, high-spending clientele year-round.
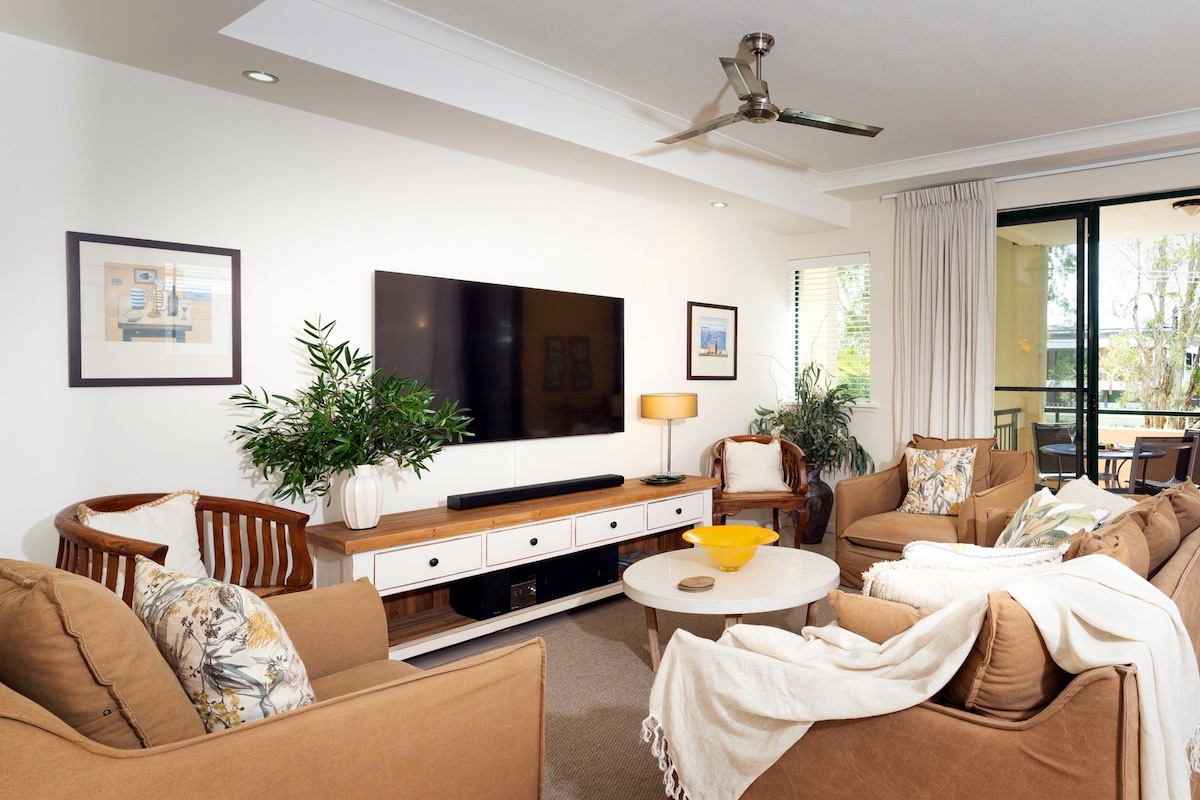
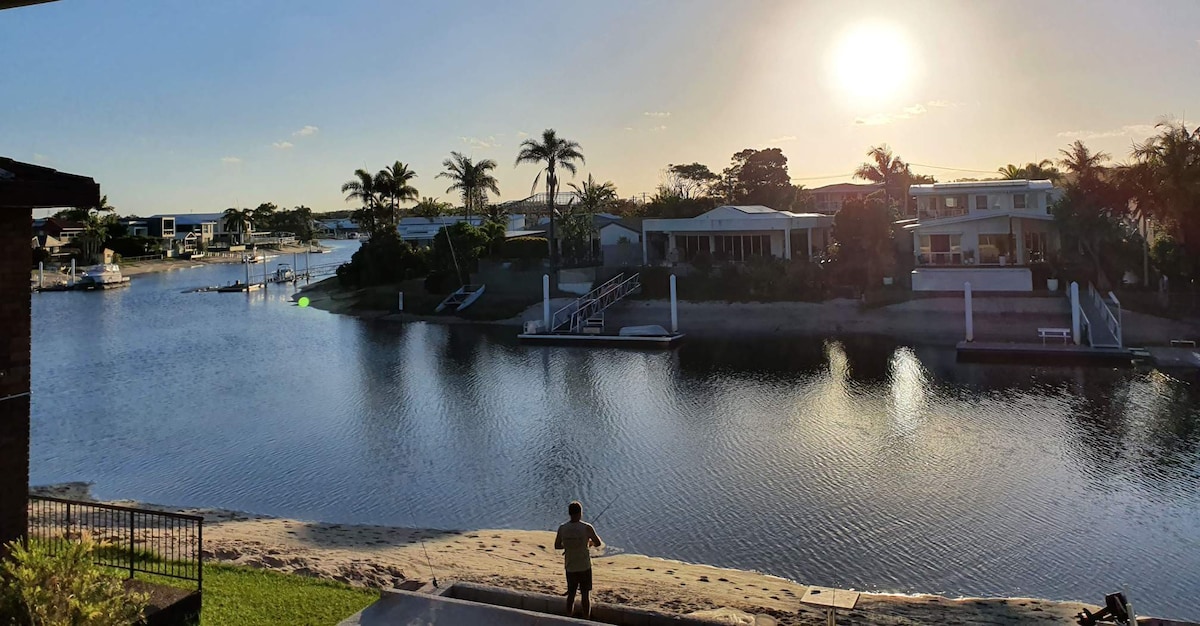
Featured Listings
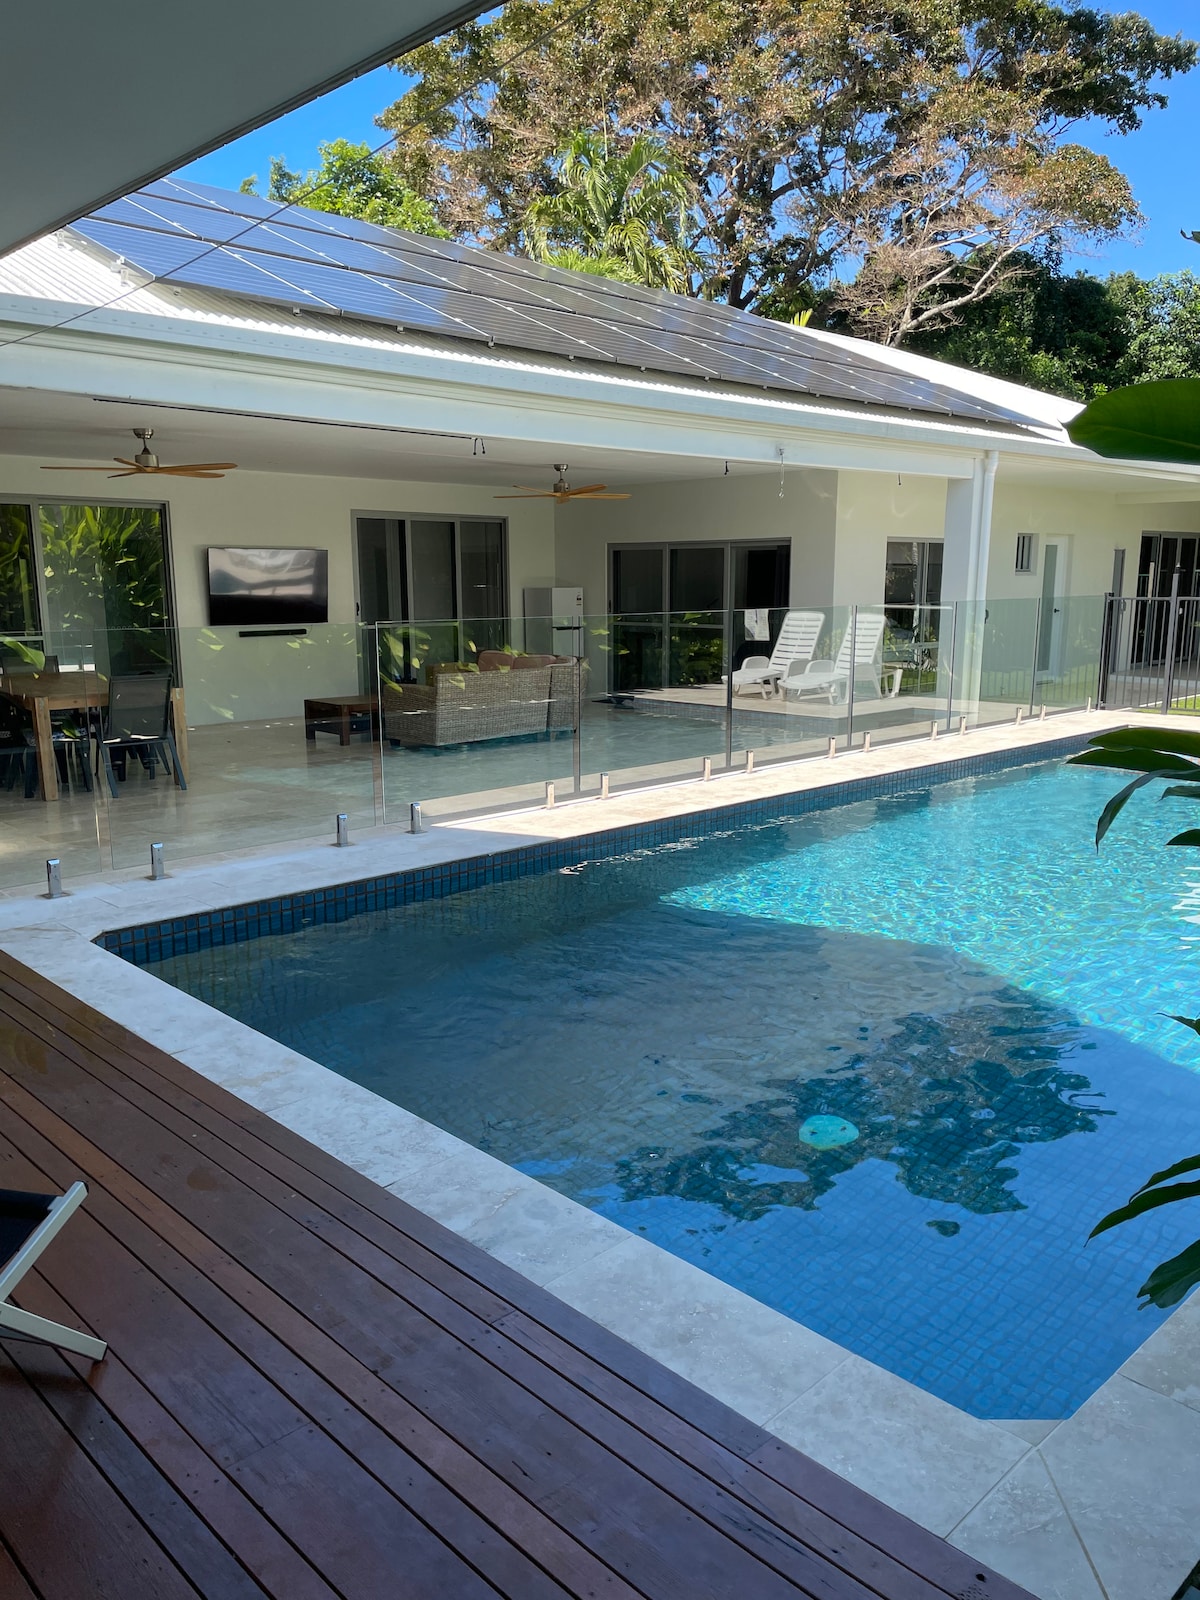
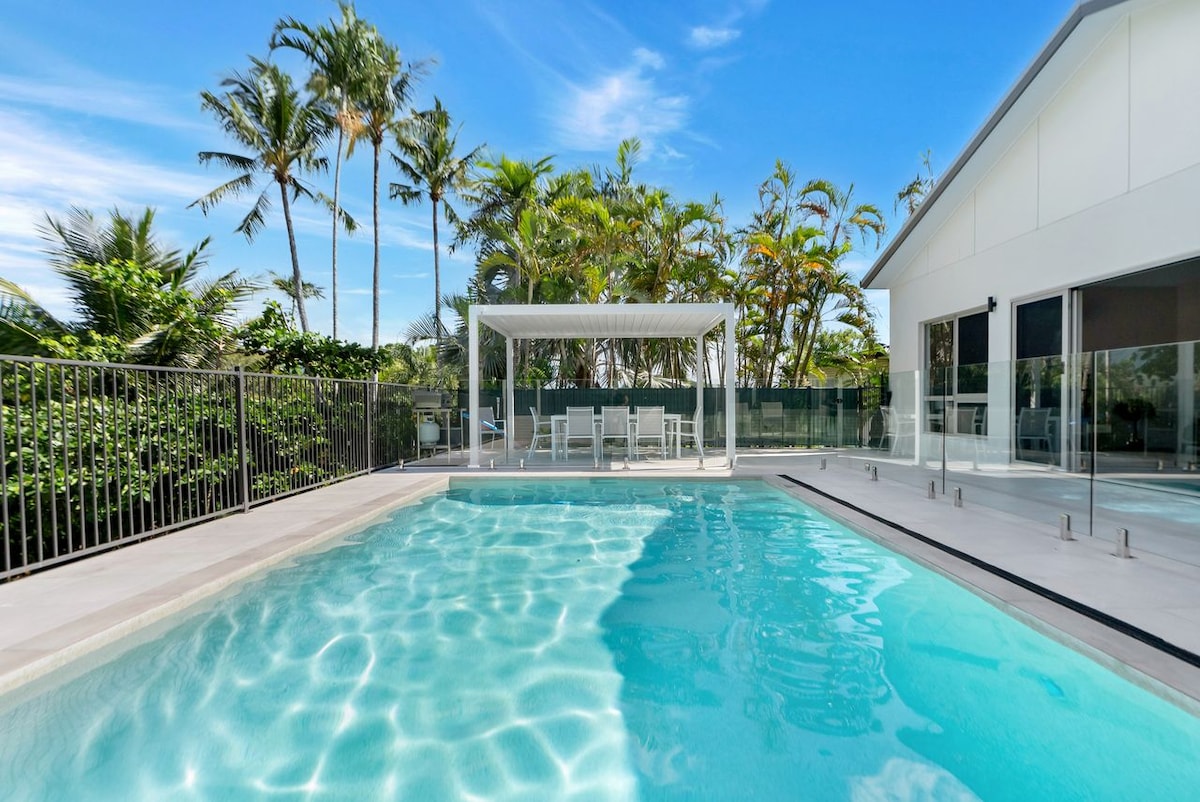
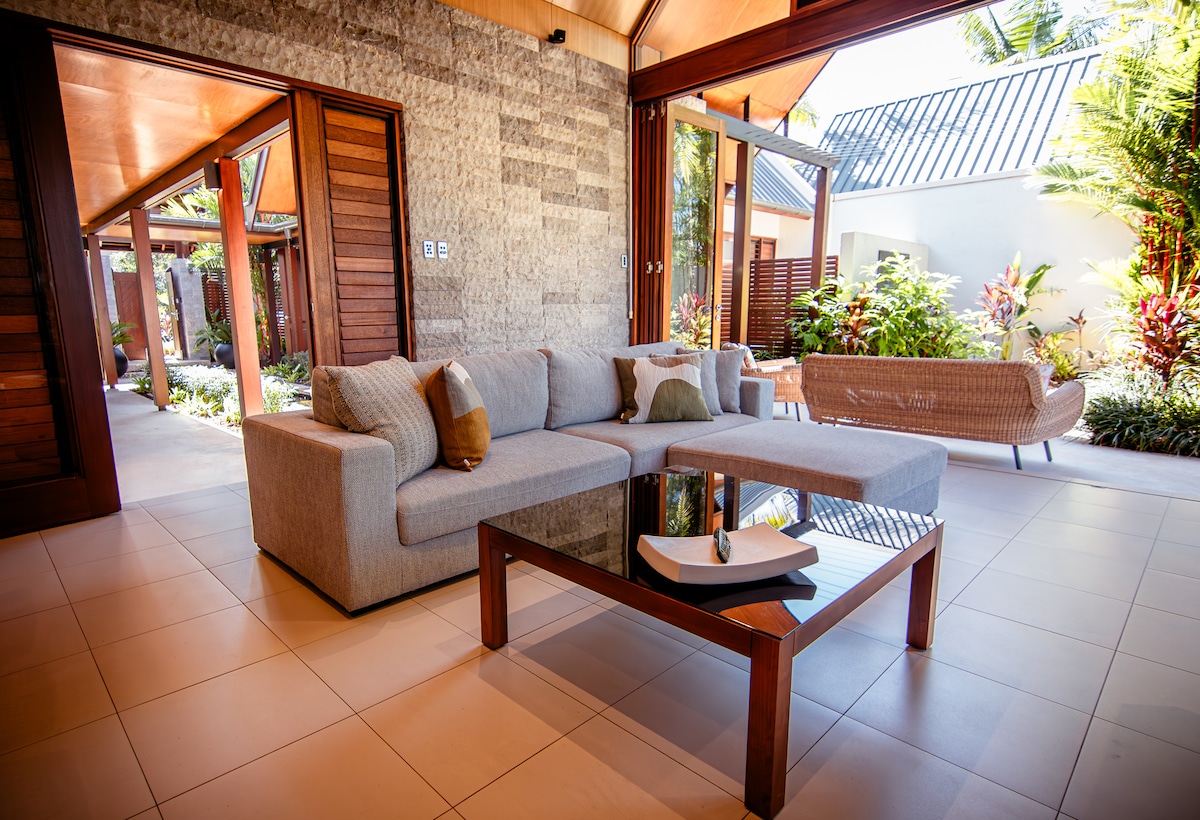
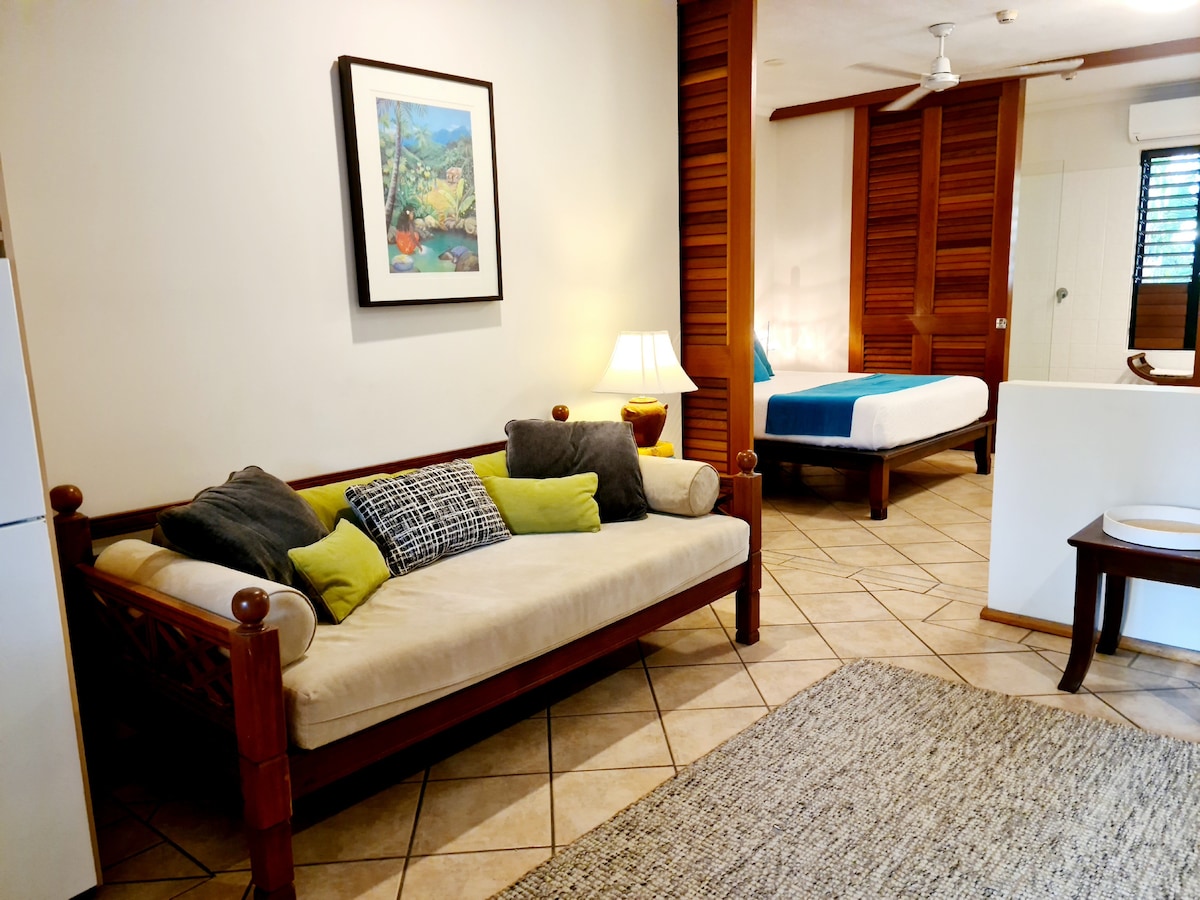
Port Douglas is the sophisticated gateway to the Great Barrier Reef and the Daintree Rainforest, offering a tropical paradise with a relaxed, upscale vibe. Famous for Four Mile Beach and its world-class marina, it attracts travelers seeking adventure and luxury in equal measure. The Airbnb market is robust, with an occupancy rate of 56%. Visitors favor stylish tropical villas and well-appointed apartments, resulting in an annual revenue per listing of A$102,644. Its proximity to two World Heritage sites ensures constant international appeal and solid rental performance.
Featured Listings
Broadbeach is the stylish and sophisticated neighbor to Surfers Paradise, known for its premium dining scene, upscale shopping at Pacific Fair, and the Star Casino. It offers a slightly more relaxed but equally luxurious coastal experience. The vacation rental market is high-performing, with an average daily rate of A$381. Visitors seek modern high-rise apartments with ocean views and easy access to the convention center, generating a strong annual revenue of A$98,237. Its appeal to both business and leisure travelers ensures consistent demand and high profitability throughout the year.
Featured Listings
Townsville City is the vibrant regional hub of North Queensland, offering a blend of coastal lifestyle and urban convenience. Serving as the gateway to Magnetic Island and the Great Barrier Reef, it attracts a mix of defense personnel, business travelers, and tourists. The Airbnb market is solid, featuring an occupancy rate of 60%. Visitors favor well-located city apartments and family homes near The Strand, resulting in a steady annual revenue of A$59,985. Its role as a major administrative and tourism center ensures a stable and reliable rental market for hosts.
Featured Listings
Noosaville offers a charming and family-friendly alternative to Noosa Heads, centered around the beautiful Noosa River. It’s a paradise for water sports, fishing, and riverside dining along Gympie Terrace. The Airbnb market is very active, featuring an occupancy rate of 60%. Travelers appreciate the spacious holiday homes and resort-style apartments, providing hosts with an annual revenue of A$91,680. Its relaxed atmosphere and abundance of outdoor activities make it a top choice for families and long-stay visitors, ensuring a steady and reliable income stream.
Featured Listings
Mooloolaba is one of the Sunshine Coast’s most popular holiday destinations, known for its safe swimming beach, vibrant esplanade, and the famous Mooloolaba Spit. It’s a family favorite that offers a perfect blend of relaxation and activity. The vacation rental market is strong, with an occupancy rate of 58%. Visitors flock to beachside apartments and resort complexes, resulting in an annual revenue per listing of A$84,025. Its consistent appeal to domestic families and its busy events calendar ensure solid occupancy and a healthy return for property owners.
Featured Listings
Sunshine Beach is Noosa’s exclusive and laid-back coastal cousin, famous for its surfing breaks, wide sandy beach, and vibrant village atmosphere. Bordering the Noosa National Park, it offers a more private and residential feel that attracts high-end travelers. The short-term rental market is premium, with an average daily rate of A$565. Visitors seek luxury architectural homes and stylish beachside apartments, driving an impressive annual revenue of A$124,548. Its combination of world-class surfing and sophisticated village life makes it one of the most desirable and lucrative markets on the coast.
Featured Listings

Get Live Queensland, Australia Market Intelligence
Discover detailed Queensland, Australia Airbnb Analytics and explore real-time market data to make accurate investment decisions.
Explore Real-time Analytics