Best Airbnb Markets in Puglia, Italy
Identifying high-potential areas in Puglia, Italy requires a deep dive into active listing data and revenue metrics. We’ve narrowed down the top 10 markets to help you understand where the most consistent returns are being generated right now.
These market averages offer a strong foundation for your analysis, but they are just the first step. For real-time updates, property-level details, and comprehensive market intelligence, leverage GuestFavorites for your next move.
Puglia Airbnb Market Map (June 2026)
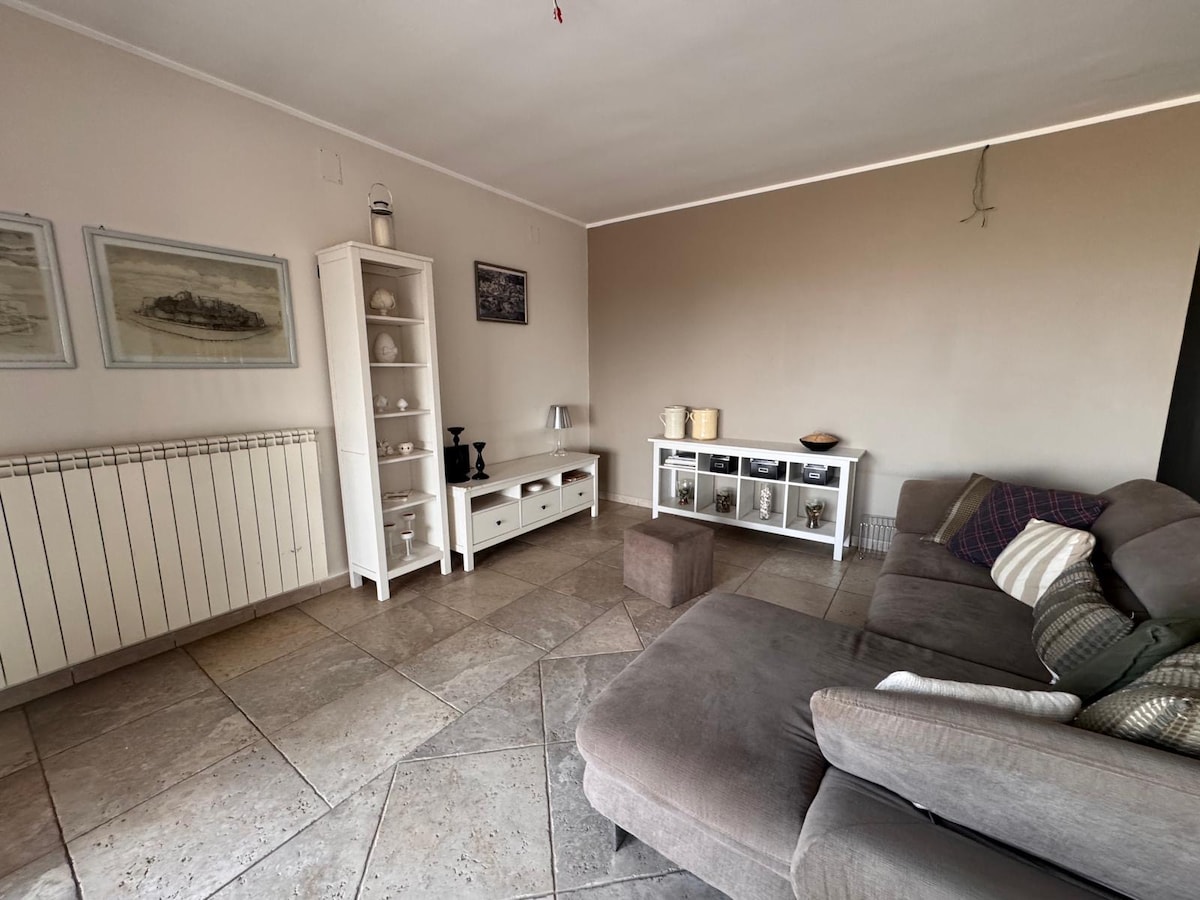
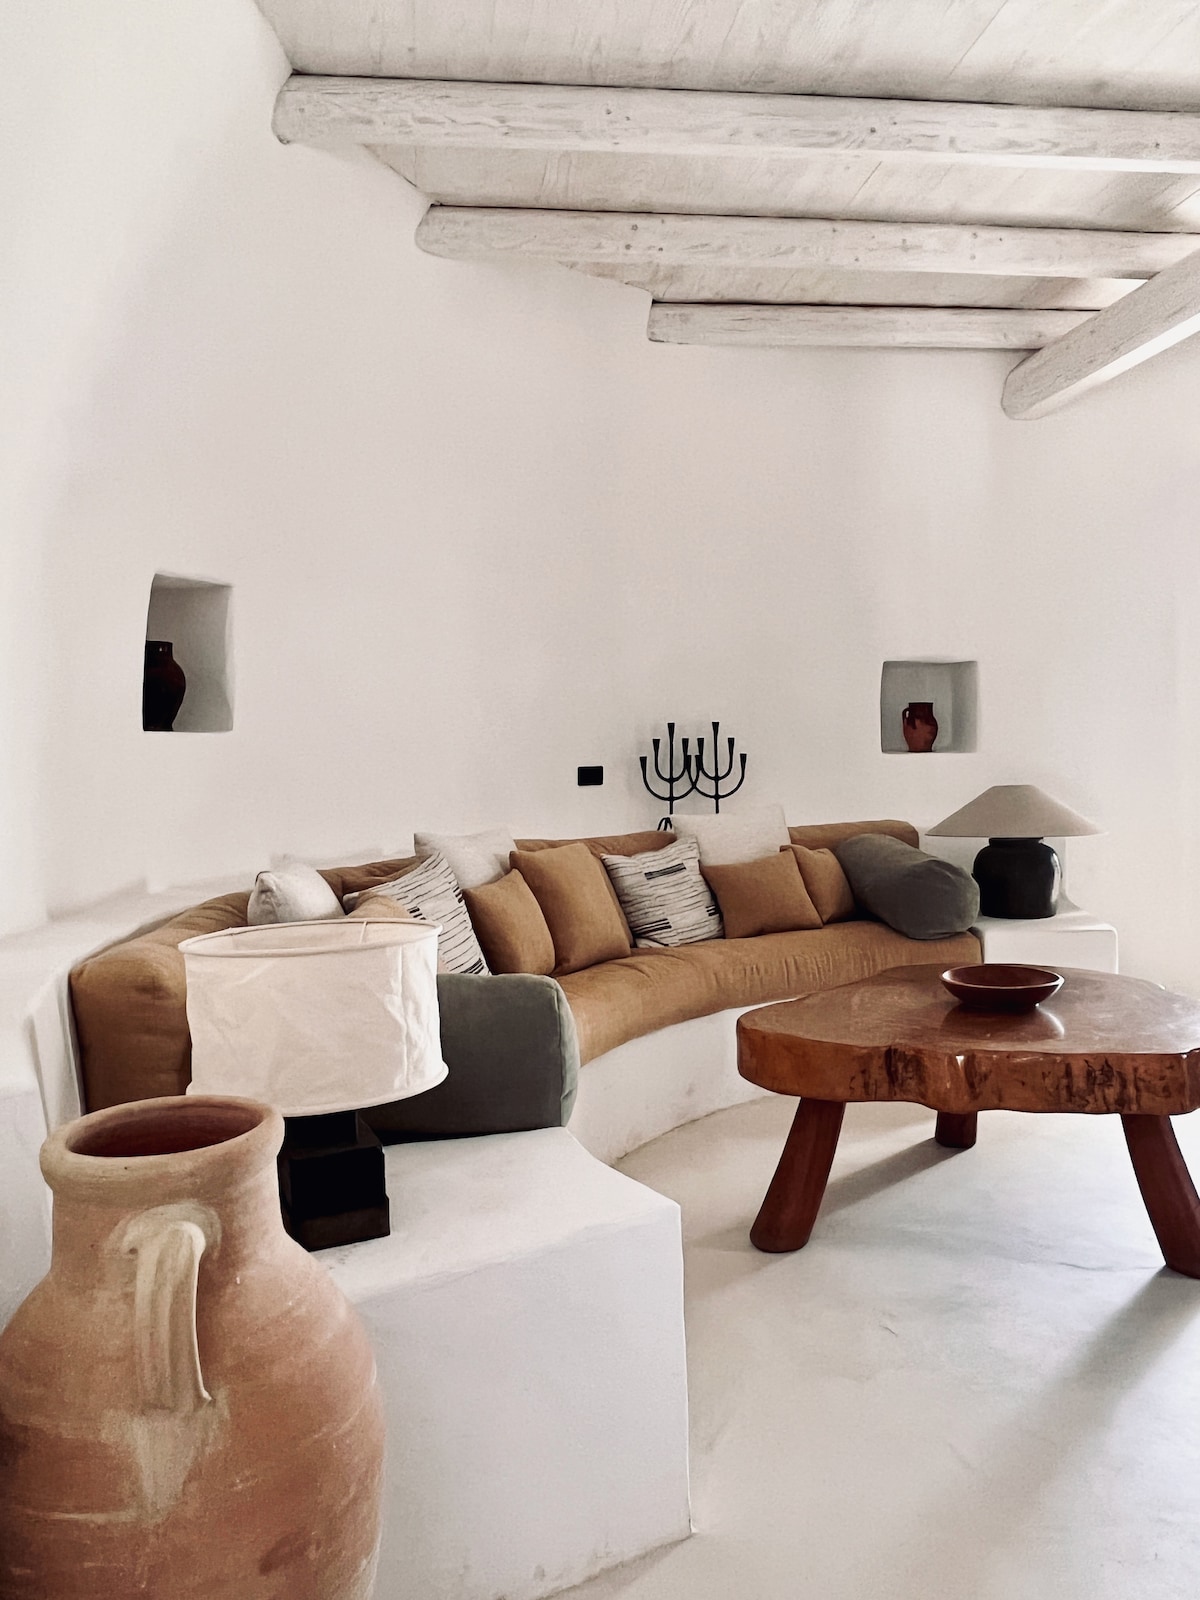
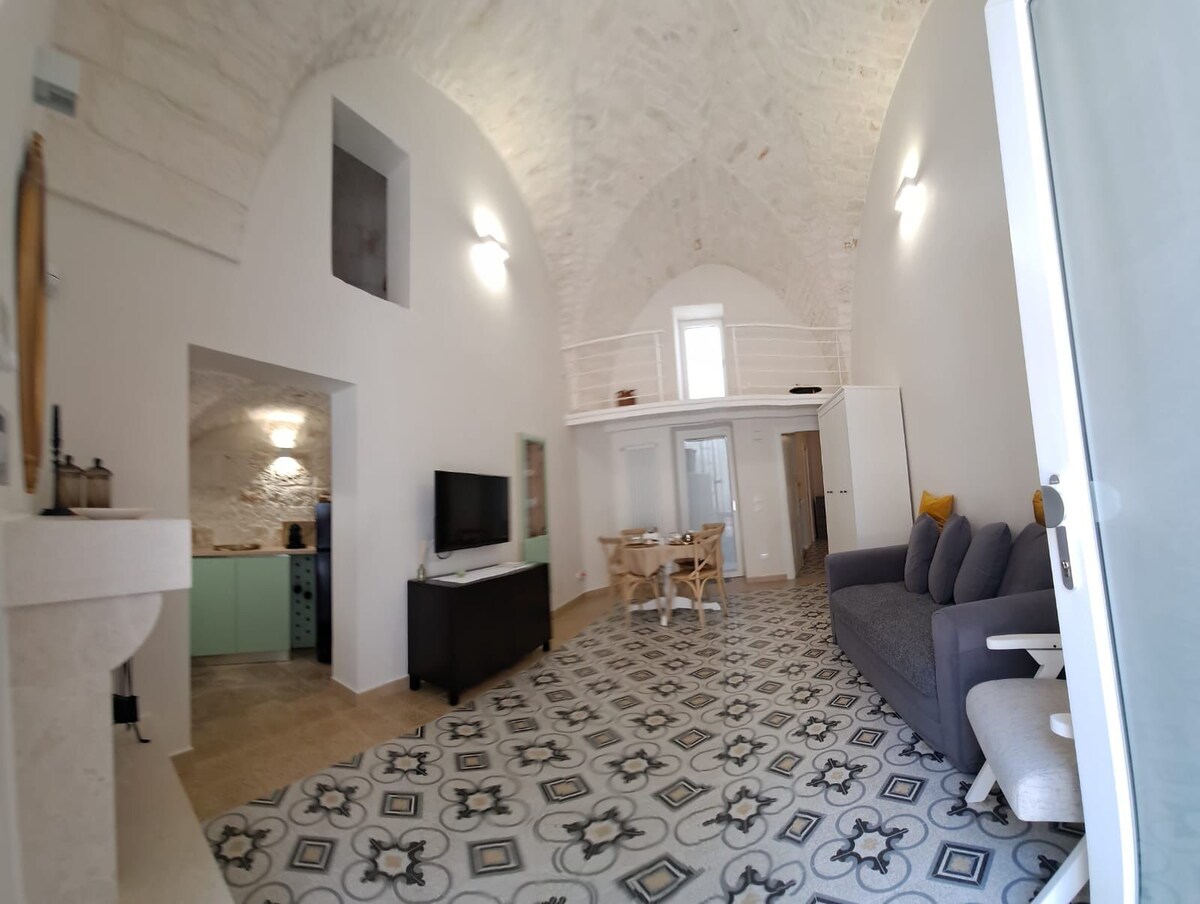
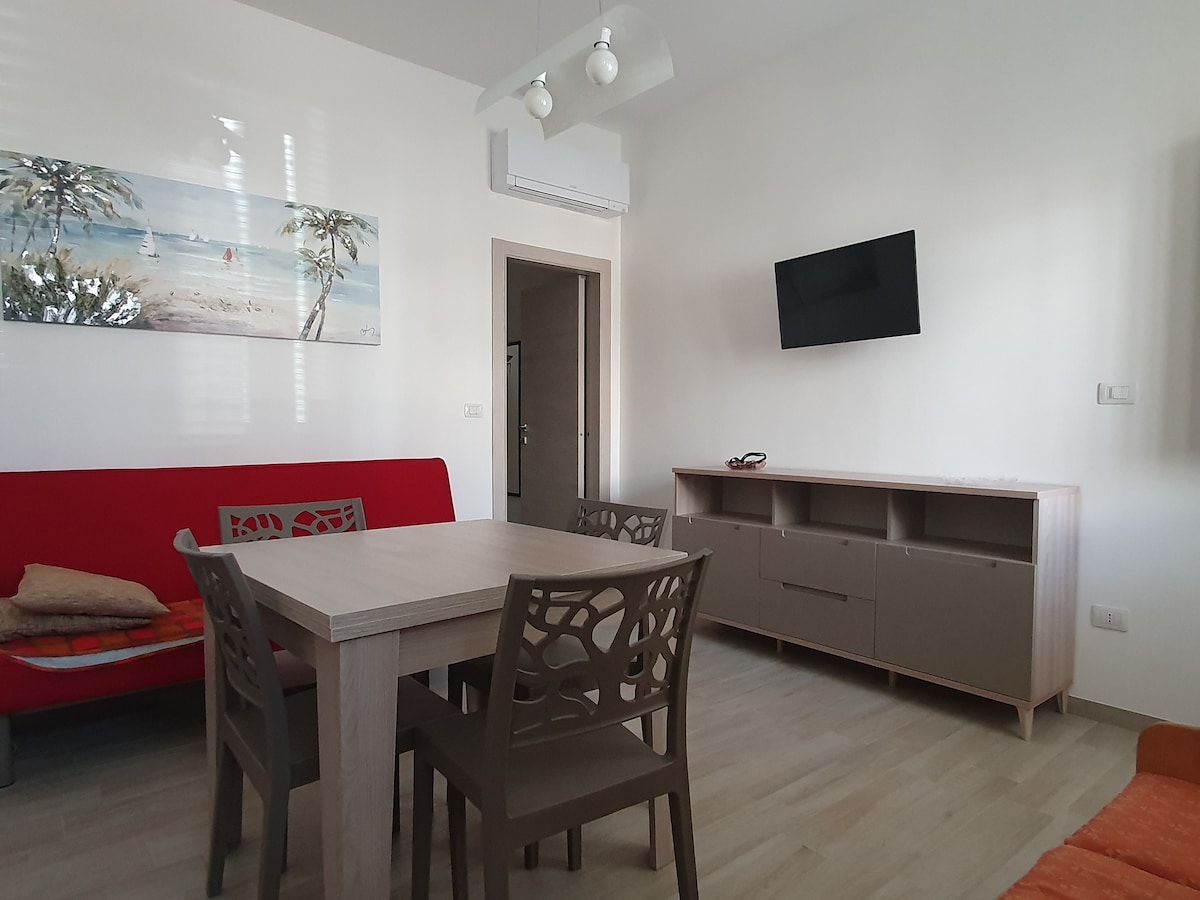
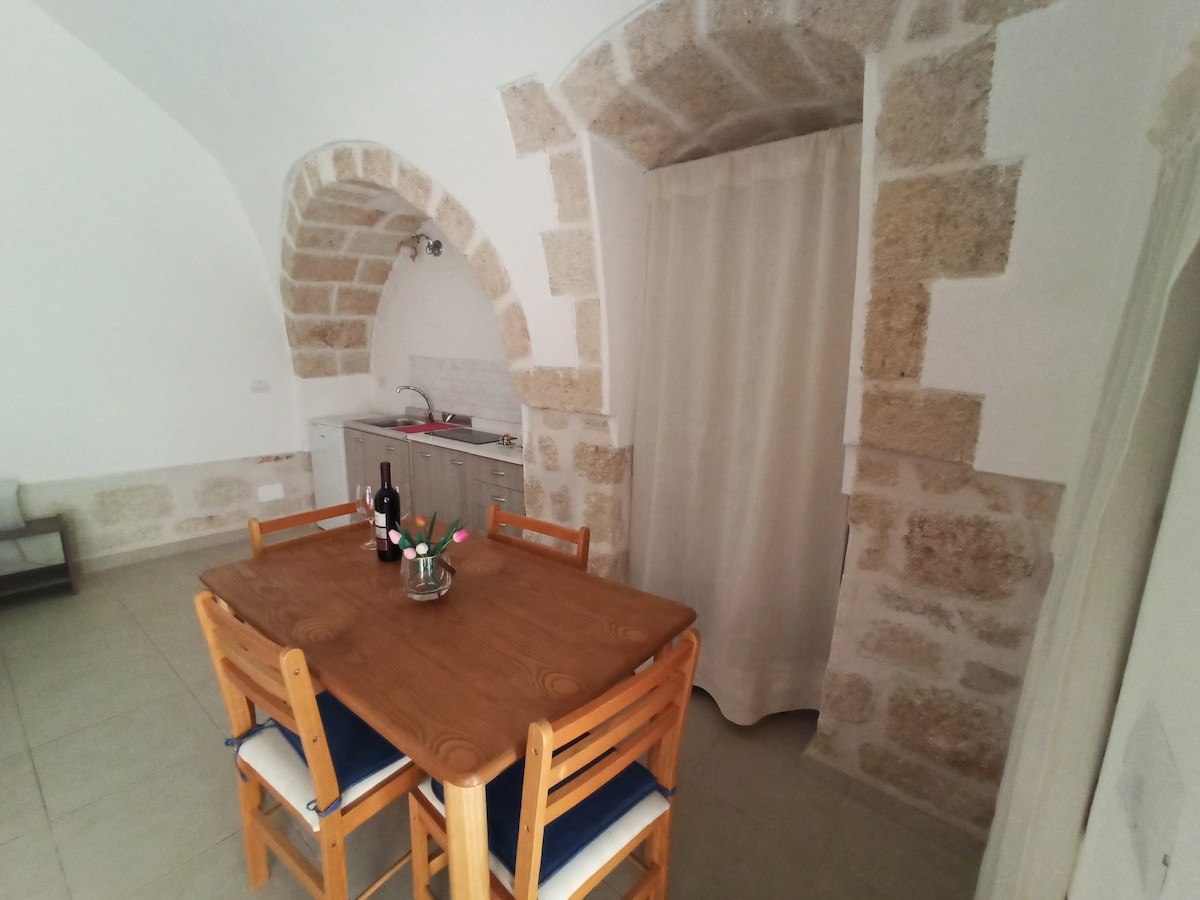
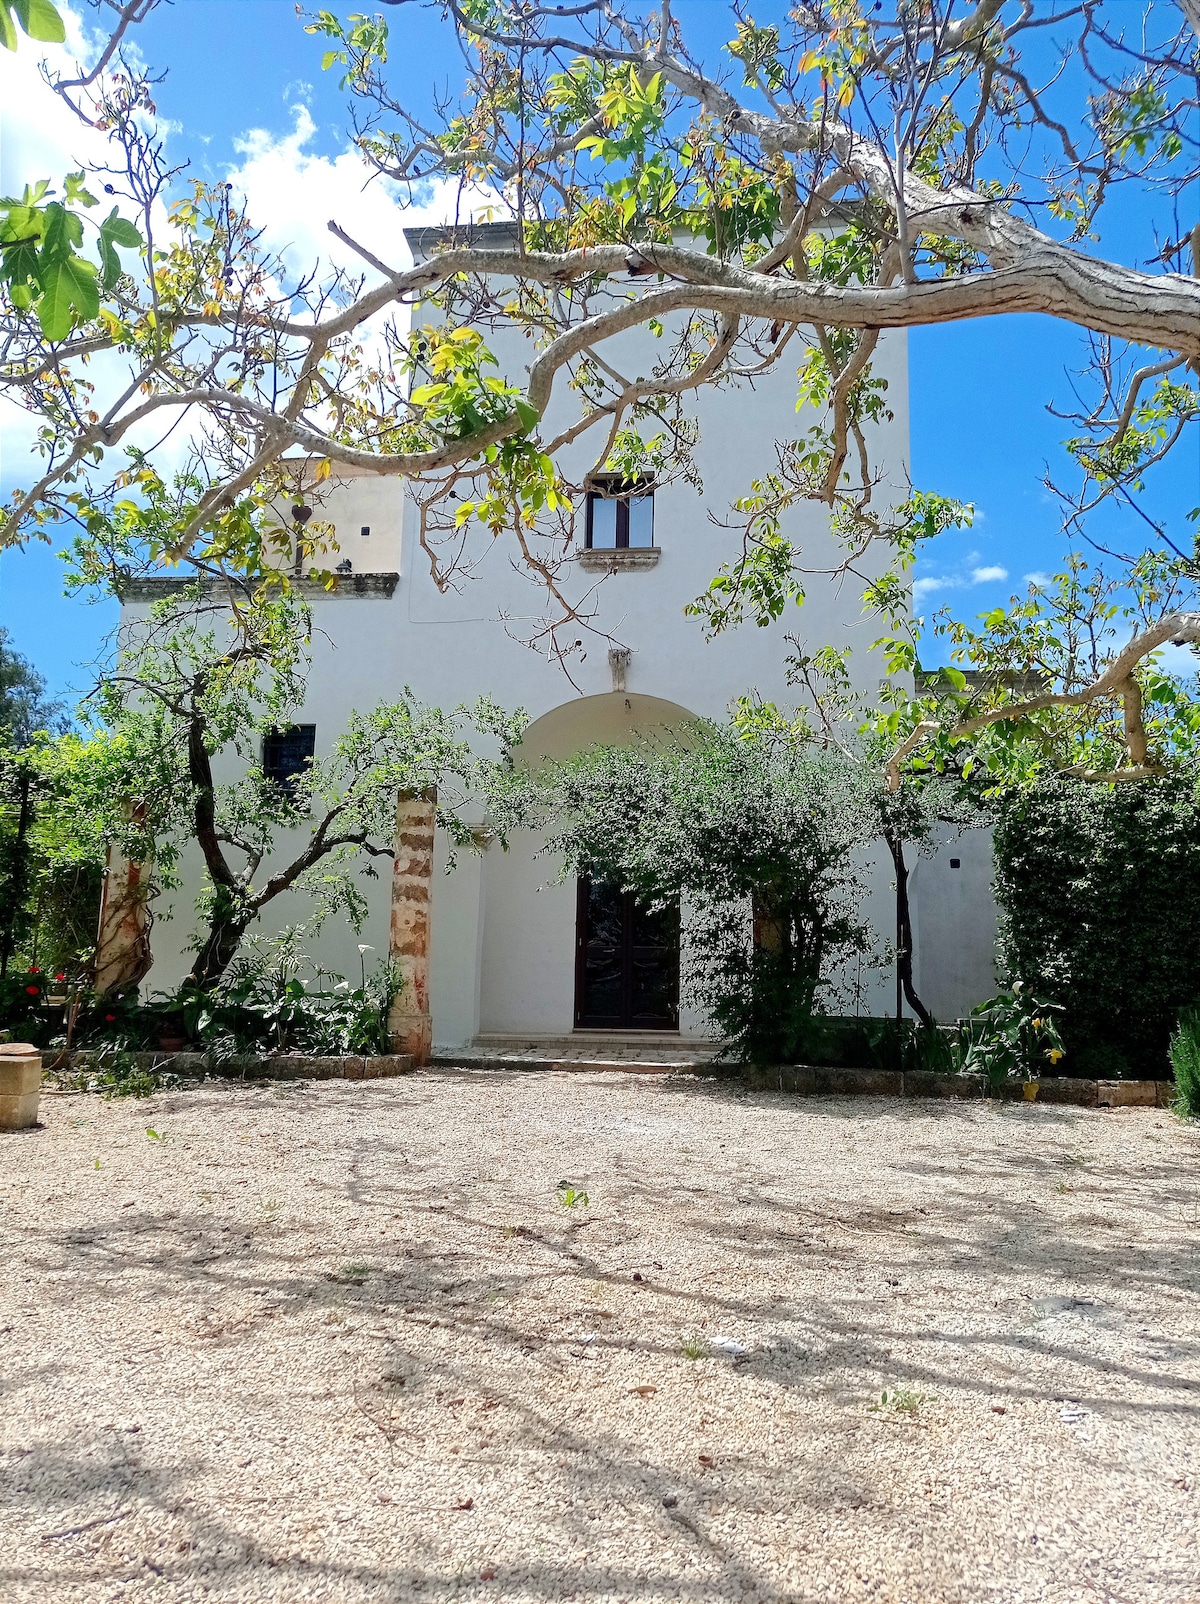
Ostuni, the ‘White City’ of Puglia standing out among millennial olive groves and the blue Adriatic, is a global icon of beauty and Mediterranean architecture. It is a cult destination attracting sophisticated international tourism fascinated by its whitewashed alleys and the Puglian quality of life. The Airbnb market is extraordinarily powerful here, featuring an average daily rate of €268. Visitors seek the unique charm of old-town apartments and the exclusivity of trulli and farmsteads with pools in the surrounding countryside, generating an annual revenue of €53,318. Its legendary image ensures relentless high-level demand year-round.
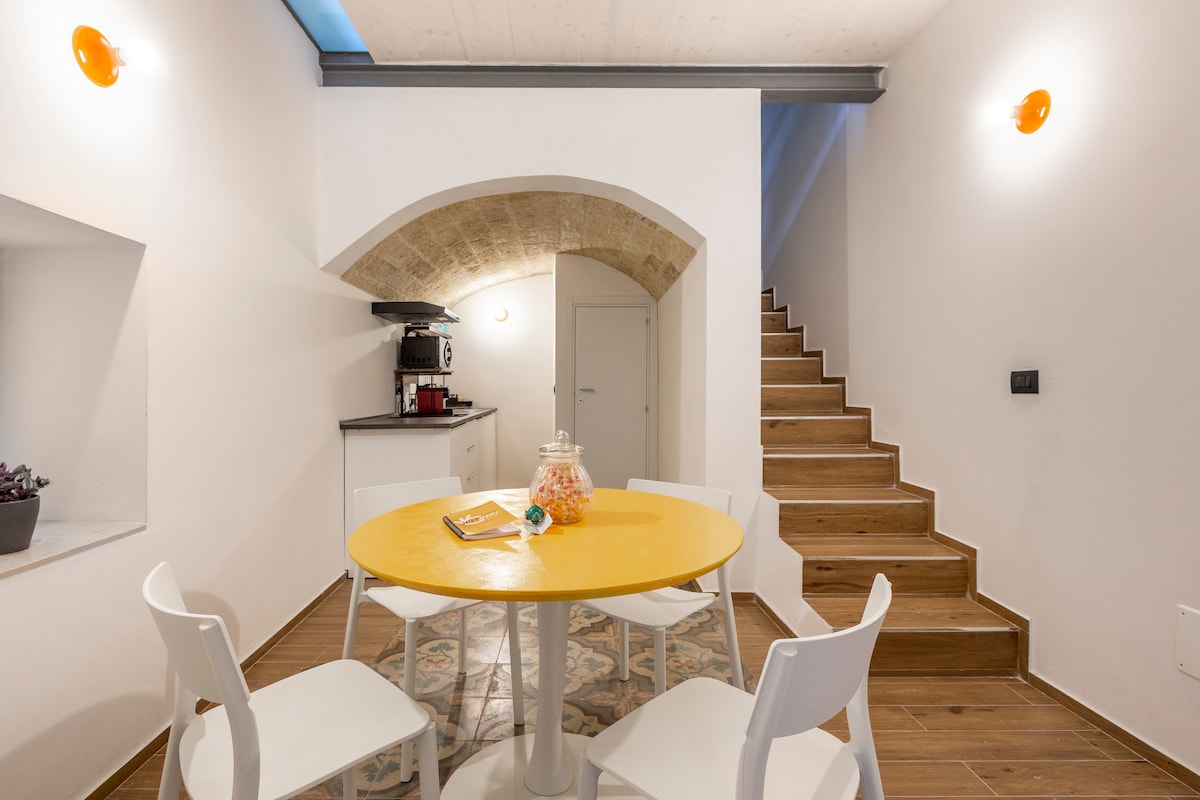
Featured Listings
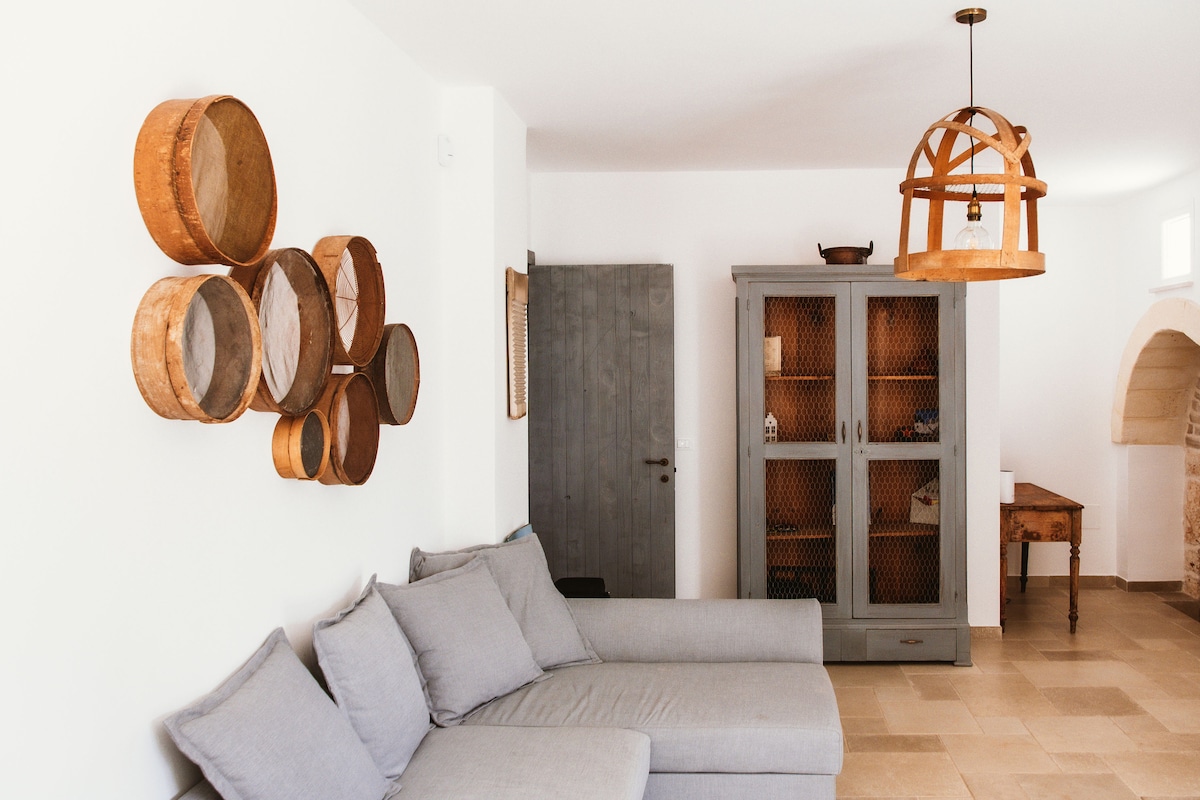
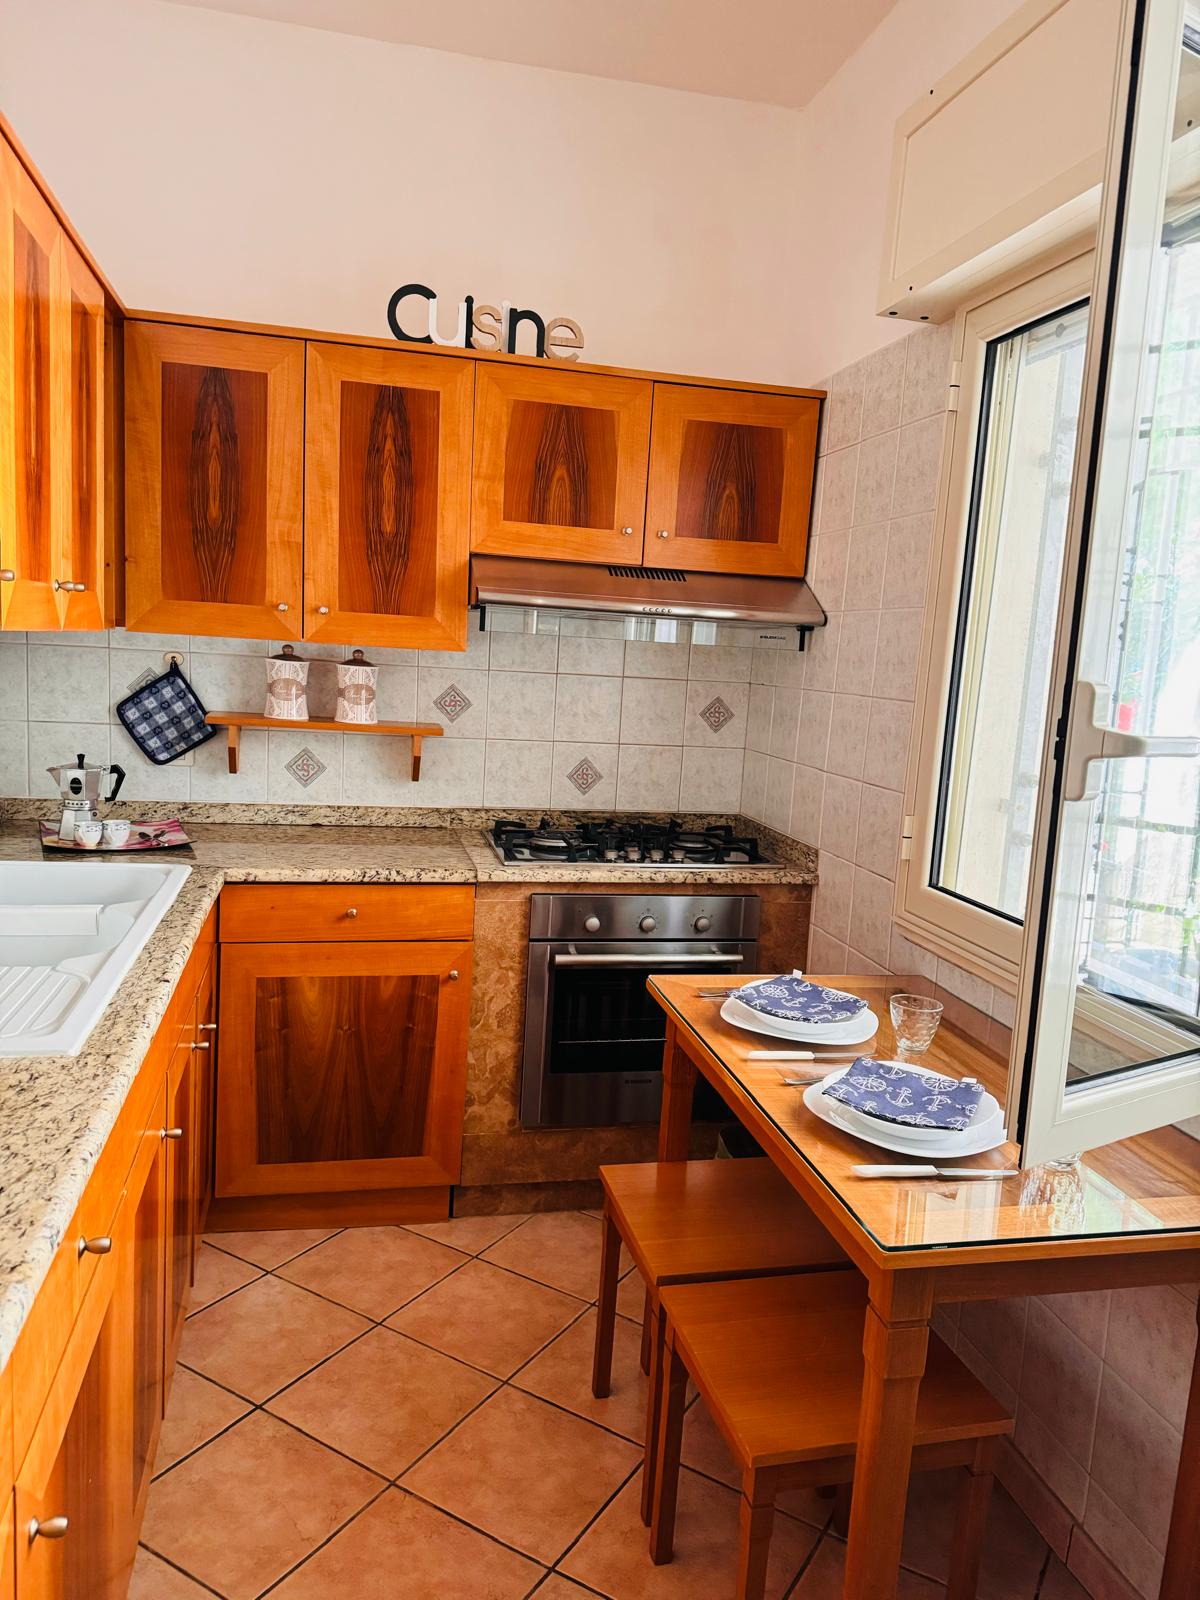
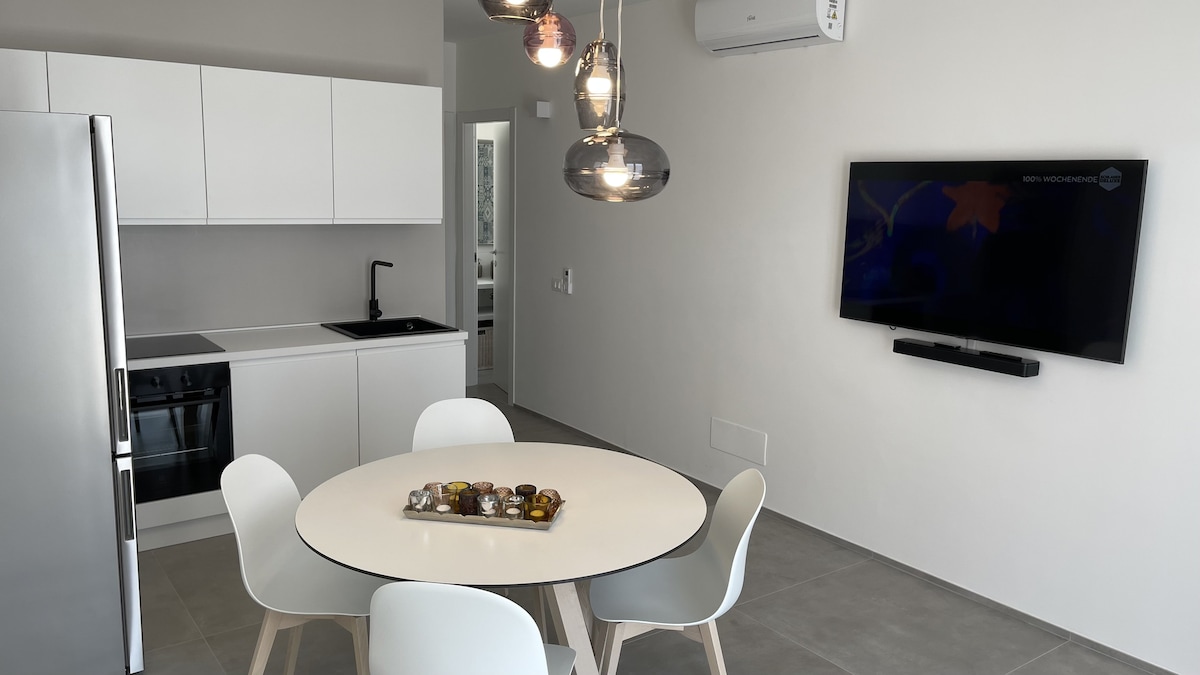
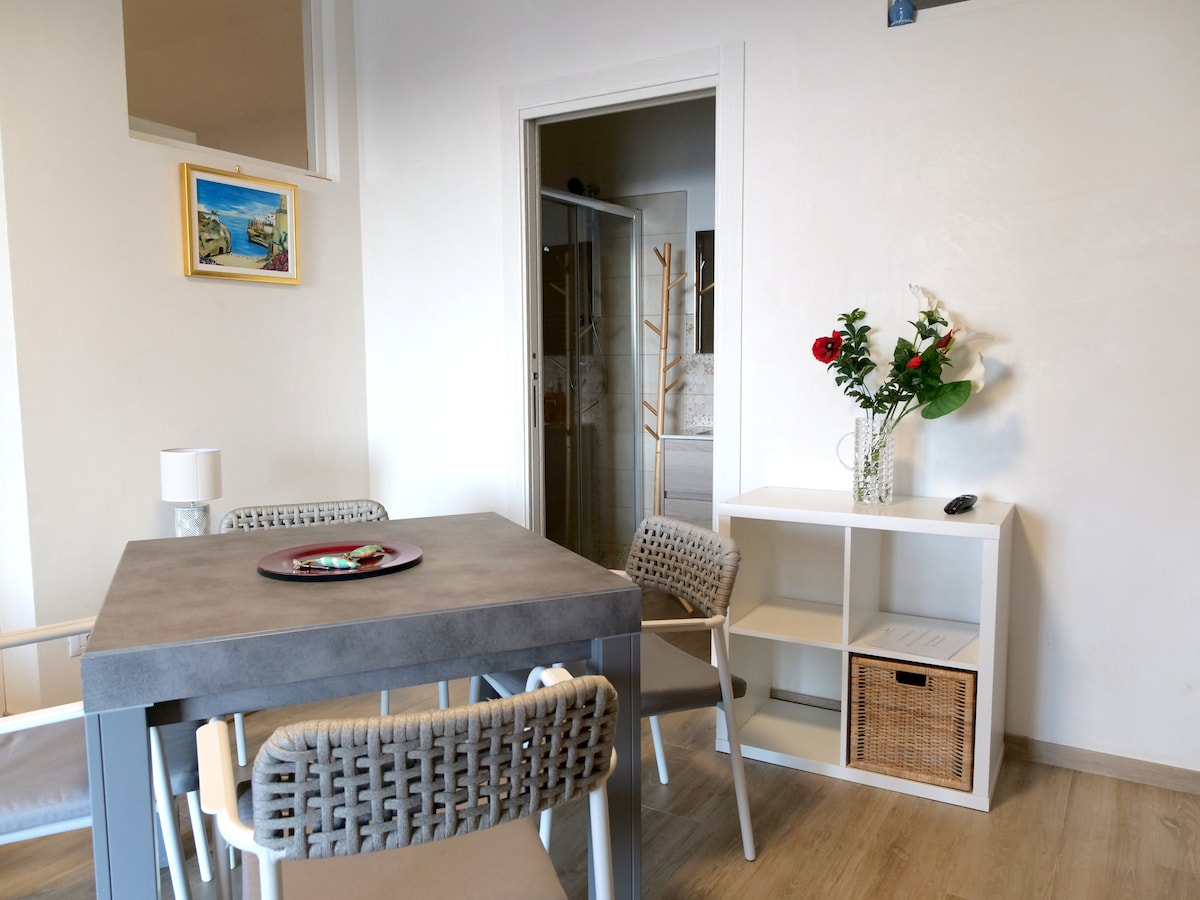
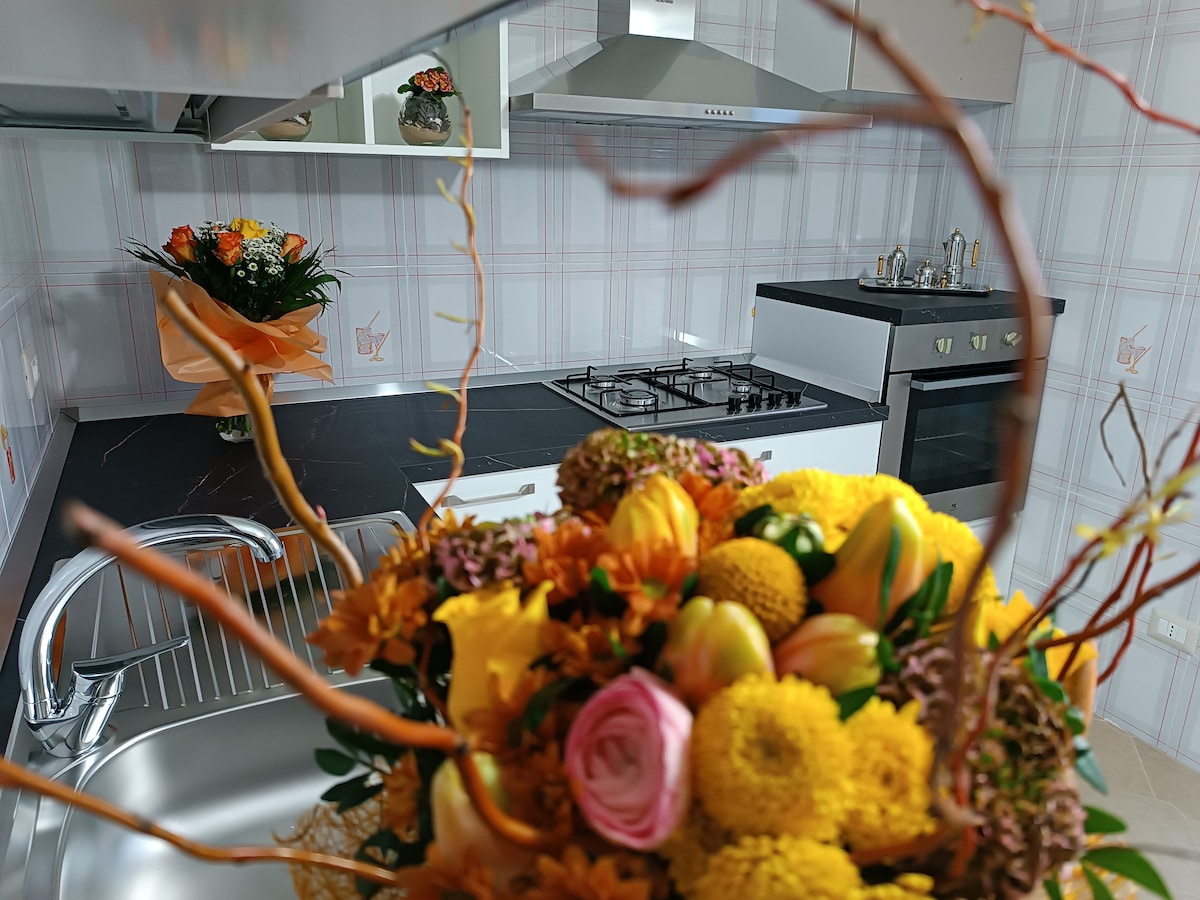
Bari, the vibrant and sunny gateway to the East, is a city in the midst of a tourism and cultural boom famous for Bari Vecchia (Old Bari), the Basilica of Saint Nicholas, and its monumental waterfront. It is a rapidly expanding Airbnb market driven by growing international tourism and a strong professional clientele due to its role as a regional economic hub. The market is extremely efficient here, featuring an occupancy rate of 66%. Visitors seek the charm of apartments in the historic alleys or the modernity of lofts in the Murat district, paying an average daily rate of €113. Its dynamic identity and accessibility ensure consistent year-round profitability for owners.
Featured Listings
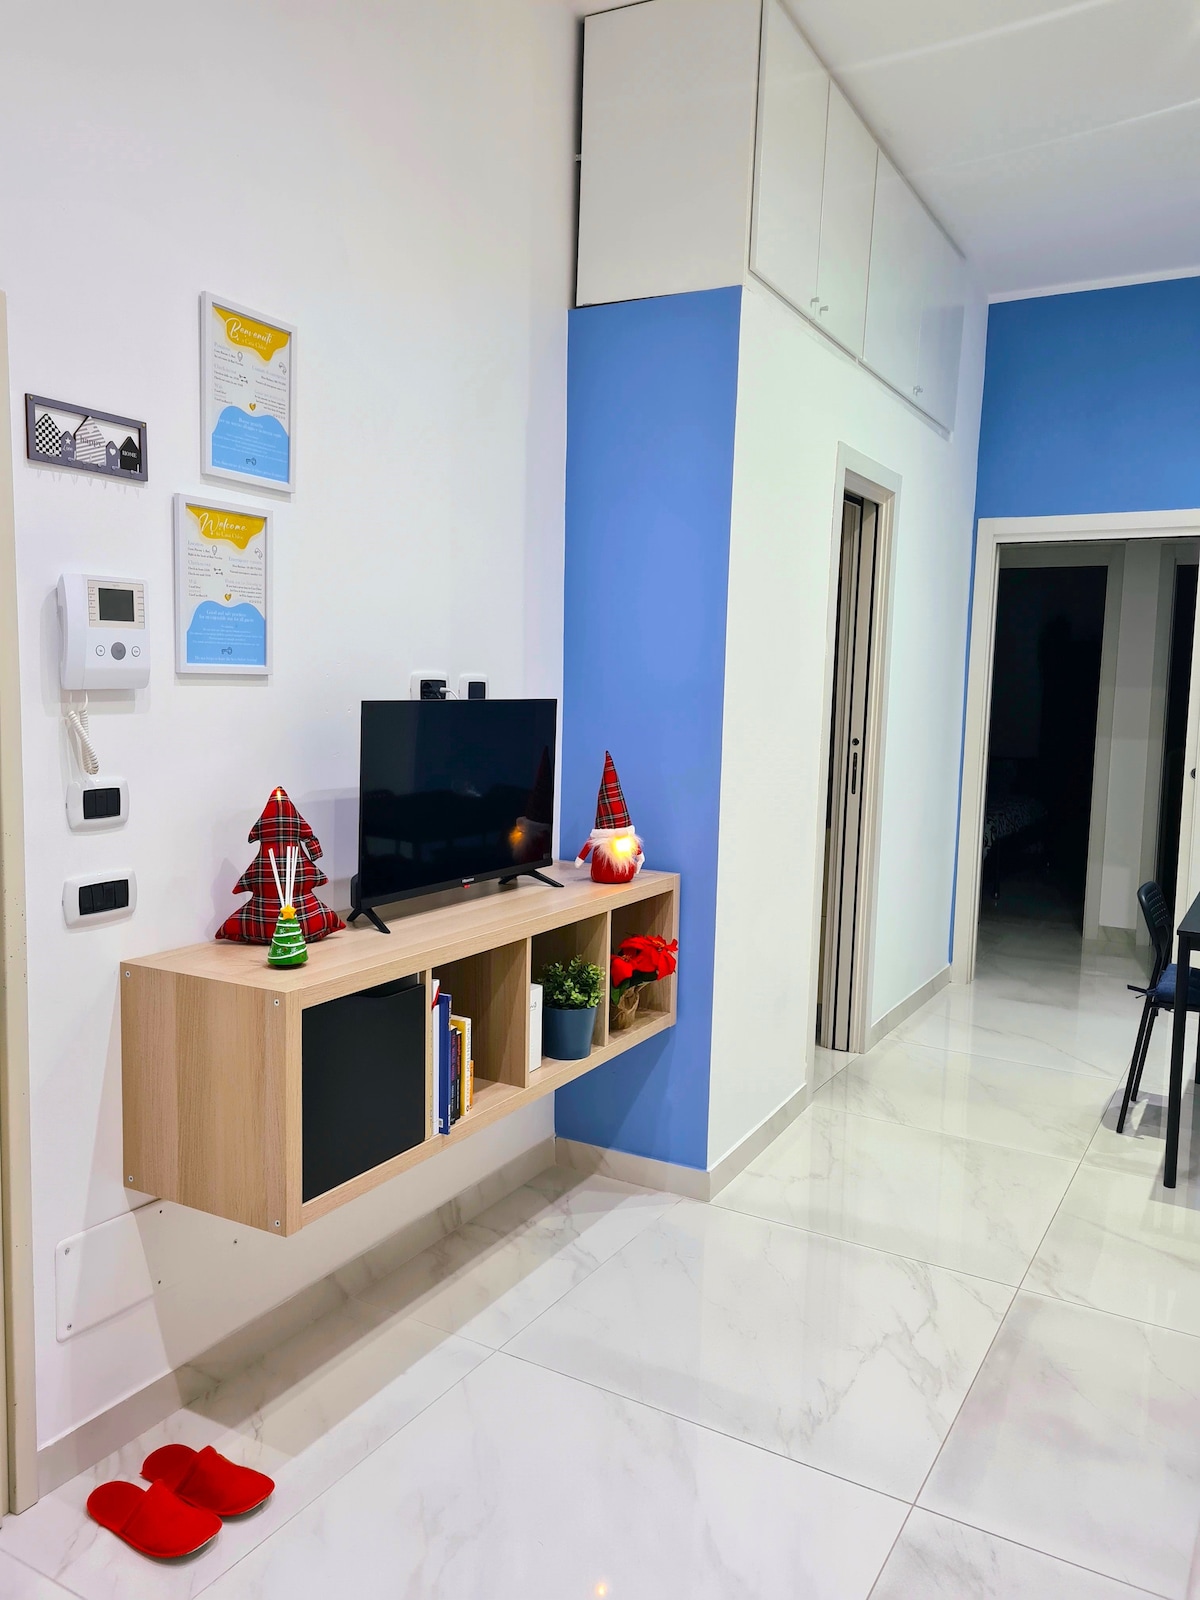
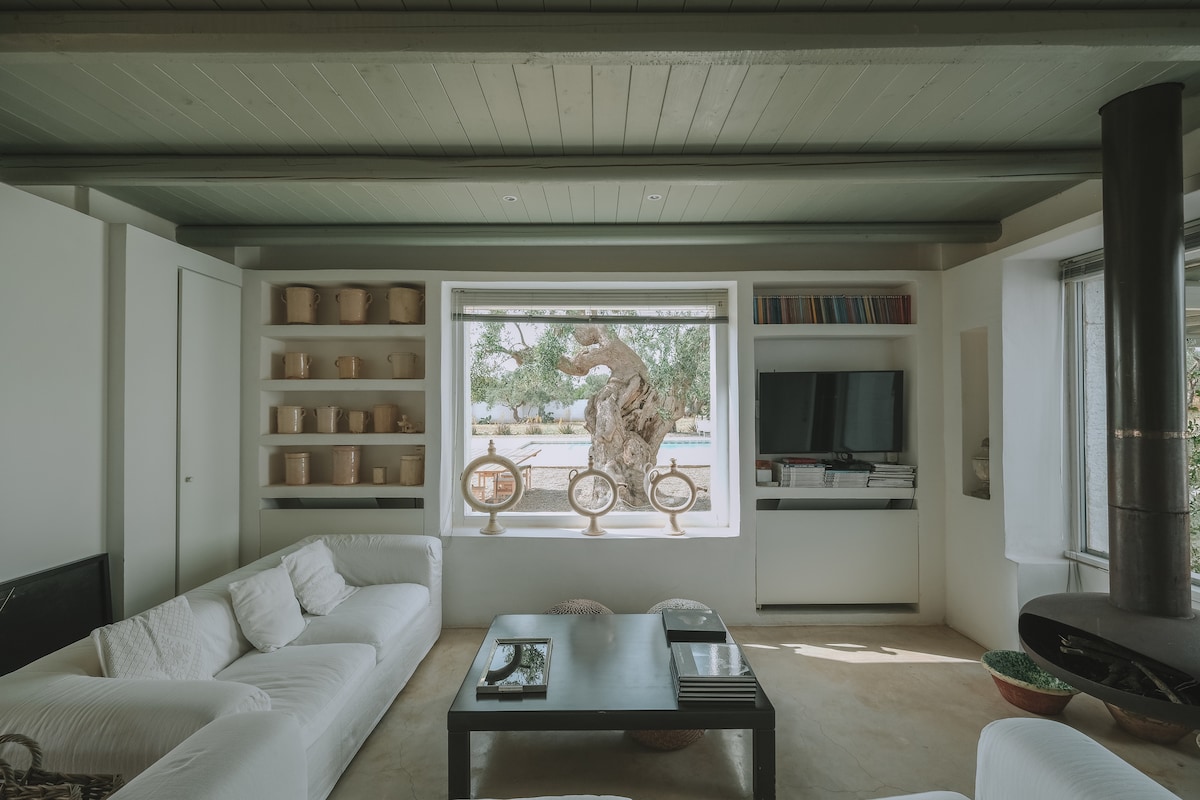
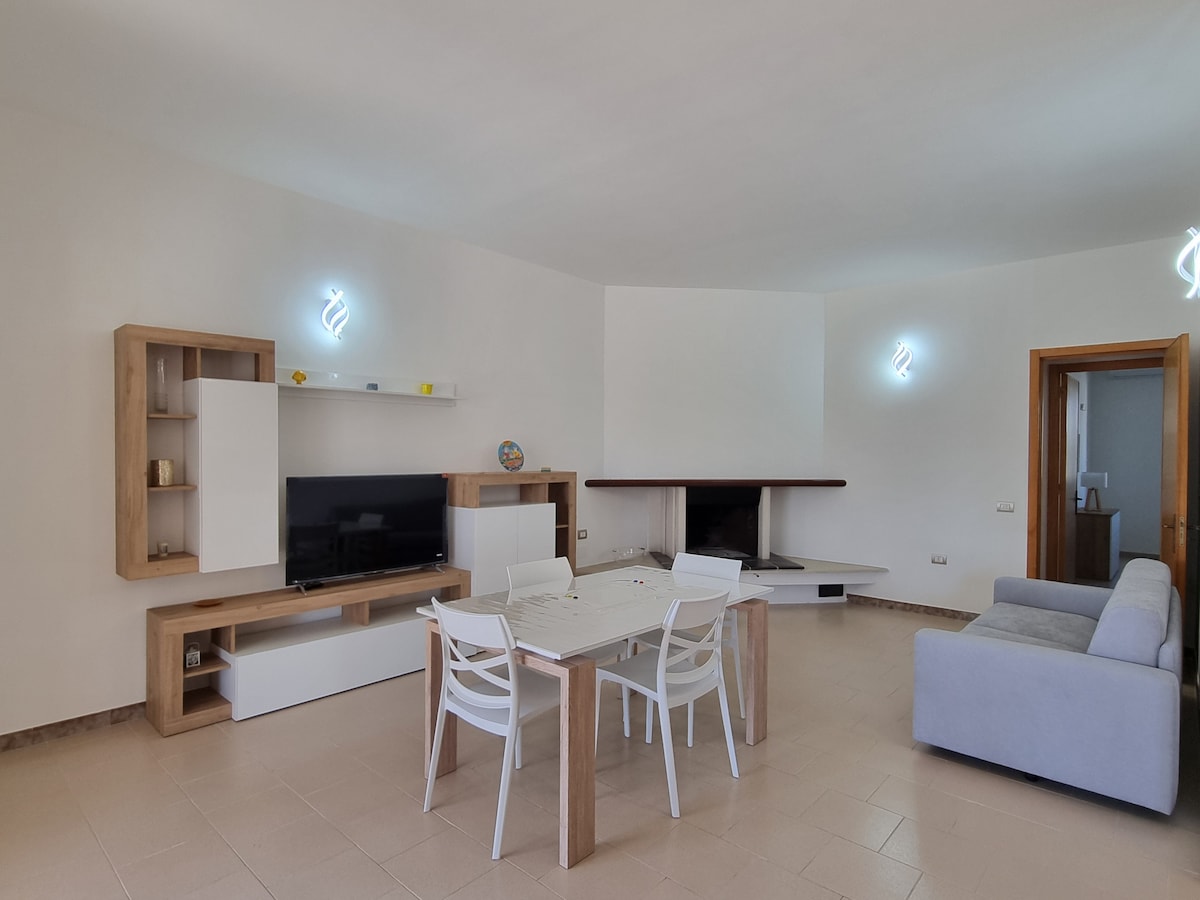
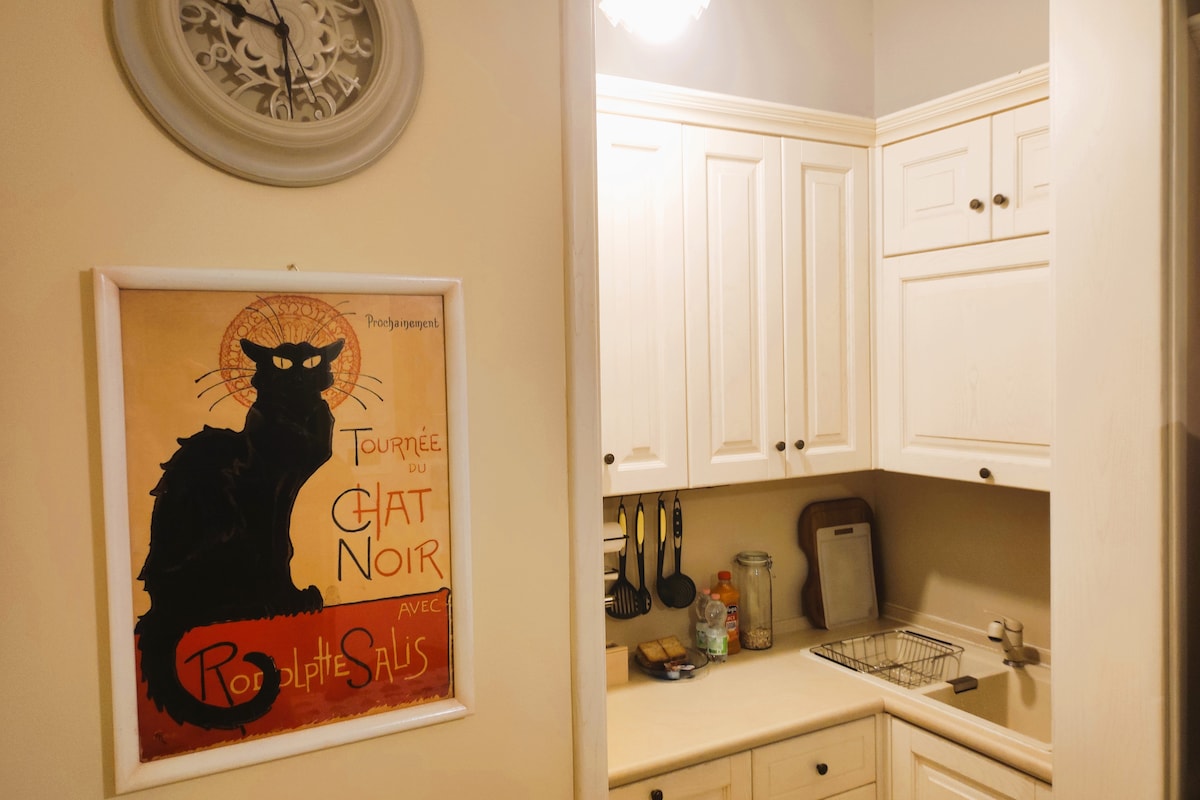
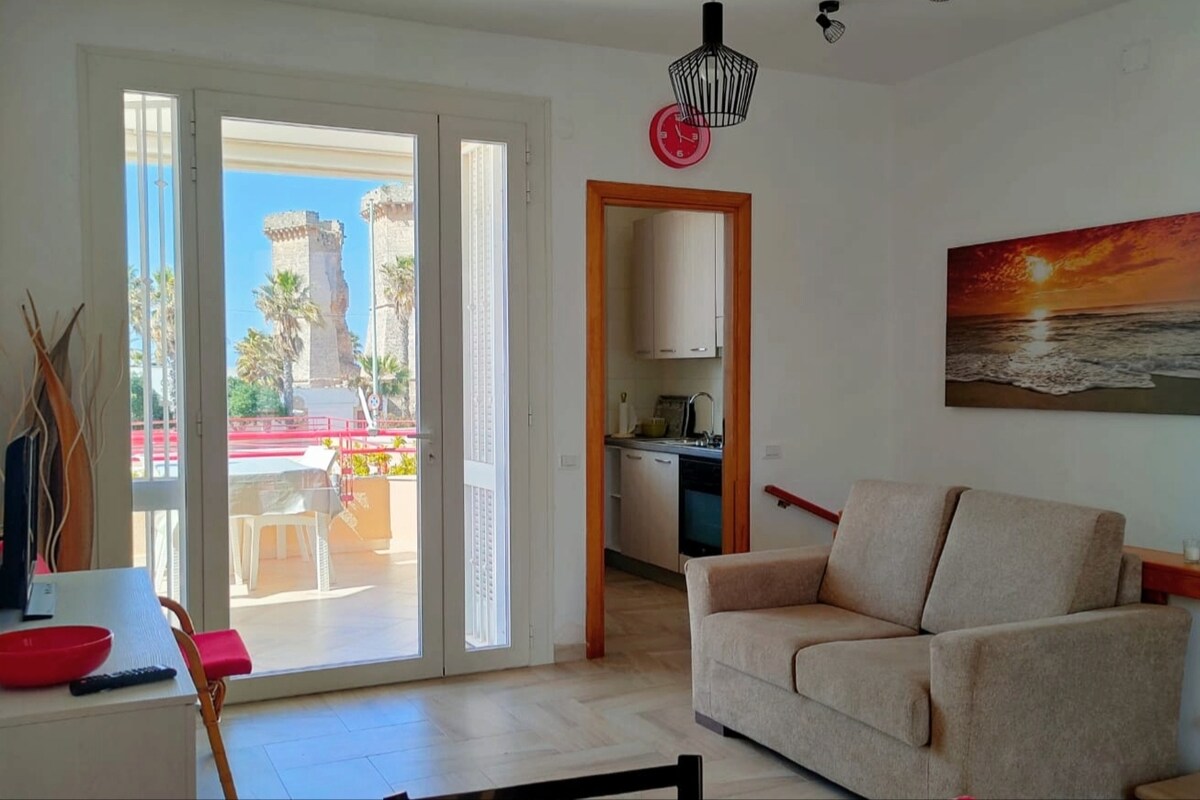
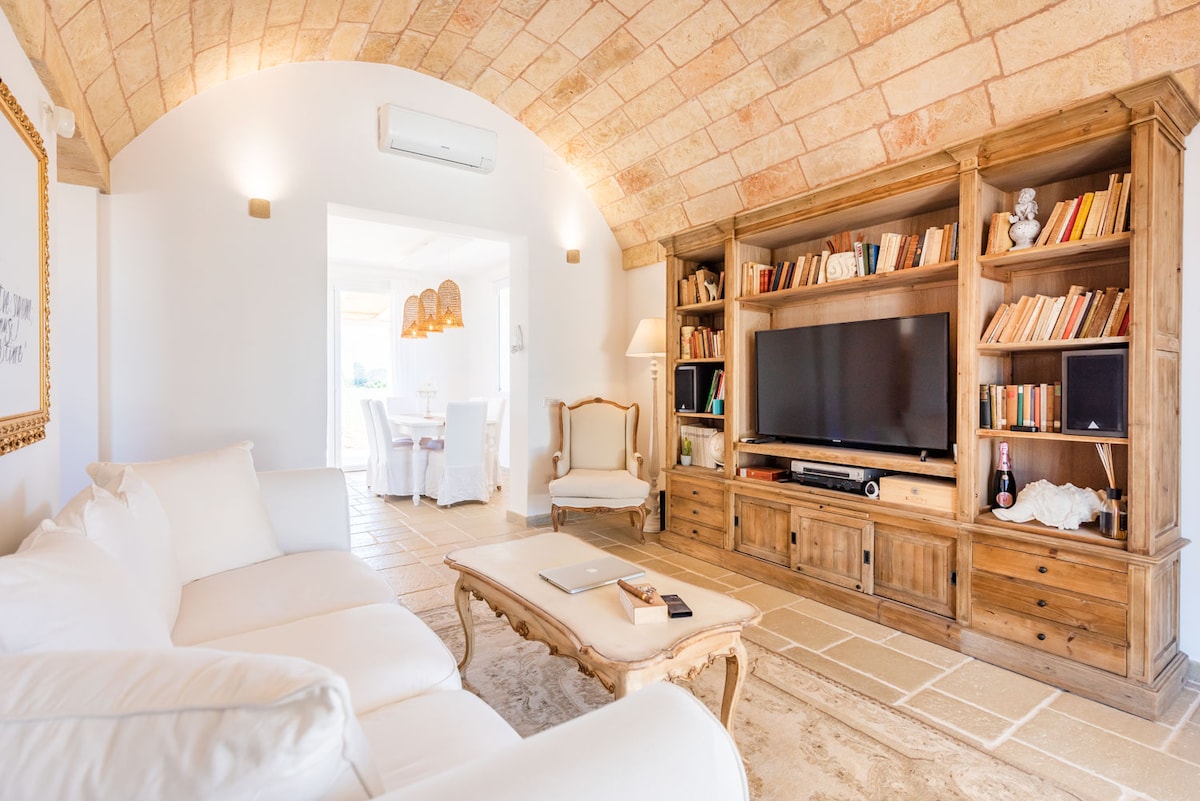
Monopoli, the ‘City of 100 Contrade’ on the Adriatic coast, enchants with its ancient harbor, crystal-clear water coves, and an exceptionally beautiful medieval historic center. It is a prestigious destination attracting international tourism seeking Puglian authenticity, Blue Flag beaches, and excellent dining away from mass crowds. The Airbnb market is very solid here, featuring an occupancy rate of 61%. Visitors seek the charm of apartments in historic village palaces and the exclusivity of sea-view residences, paying an average daily rate of €172. Its image as a coastal gem ensures high and consistent profitability.
Featured Listings
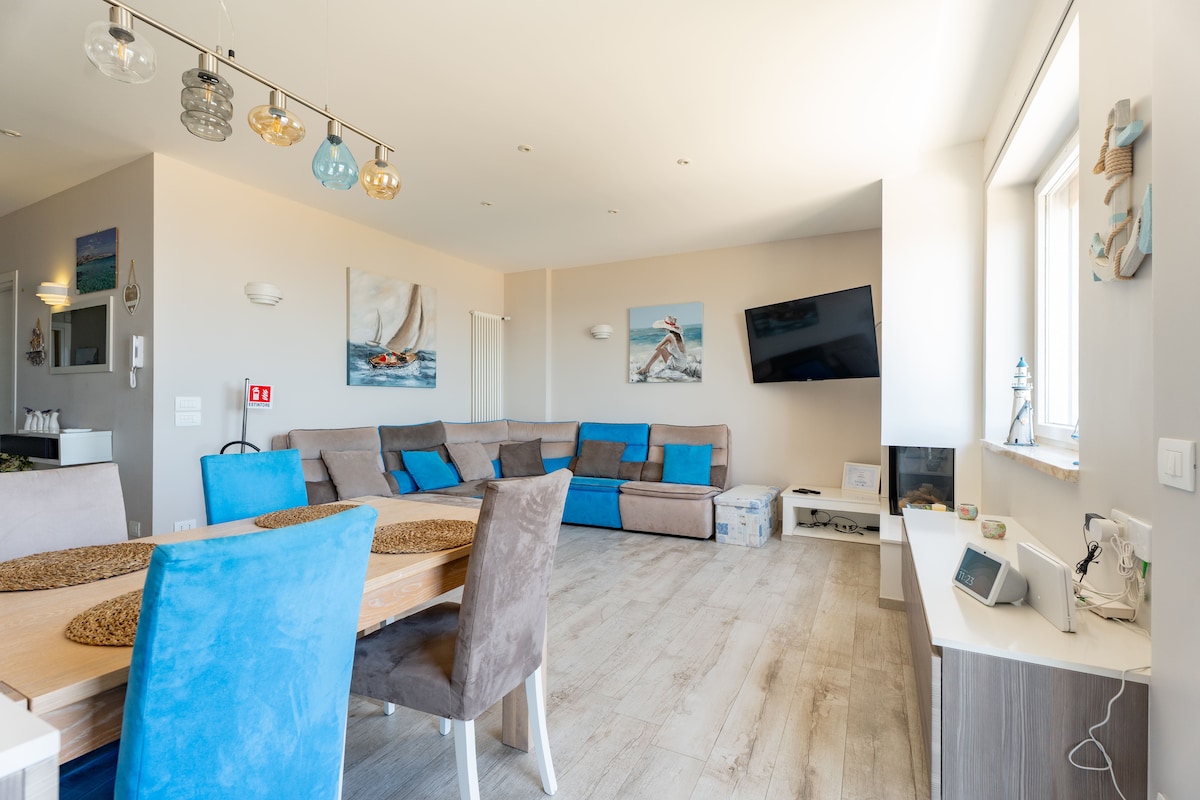
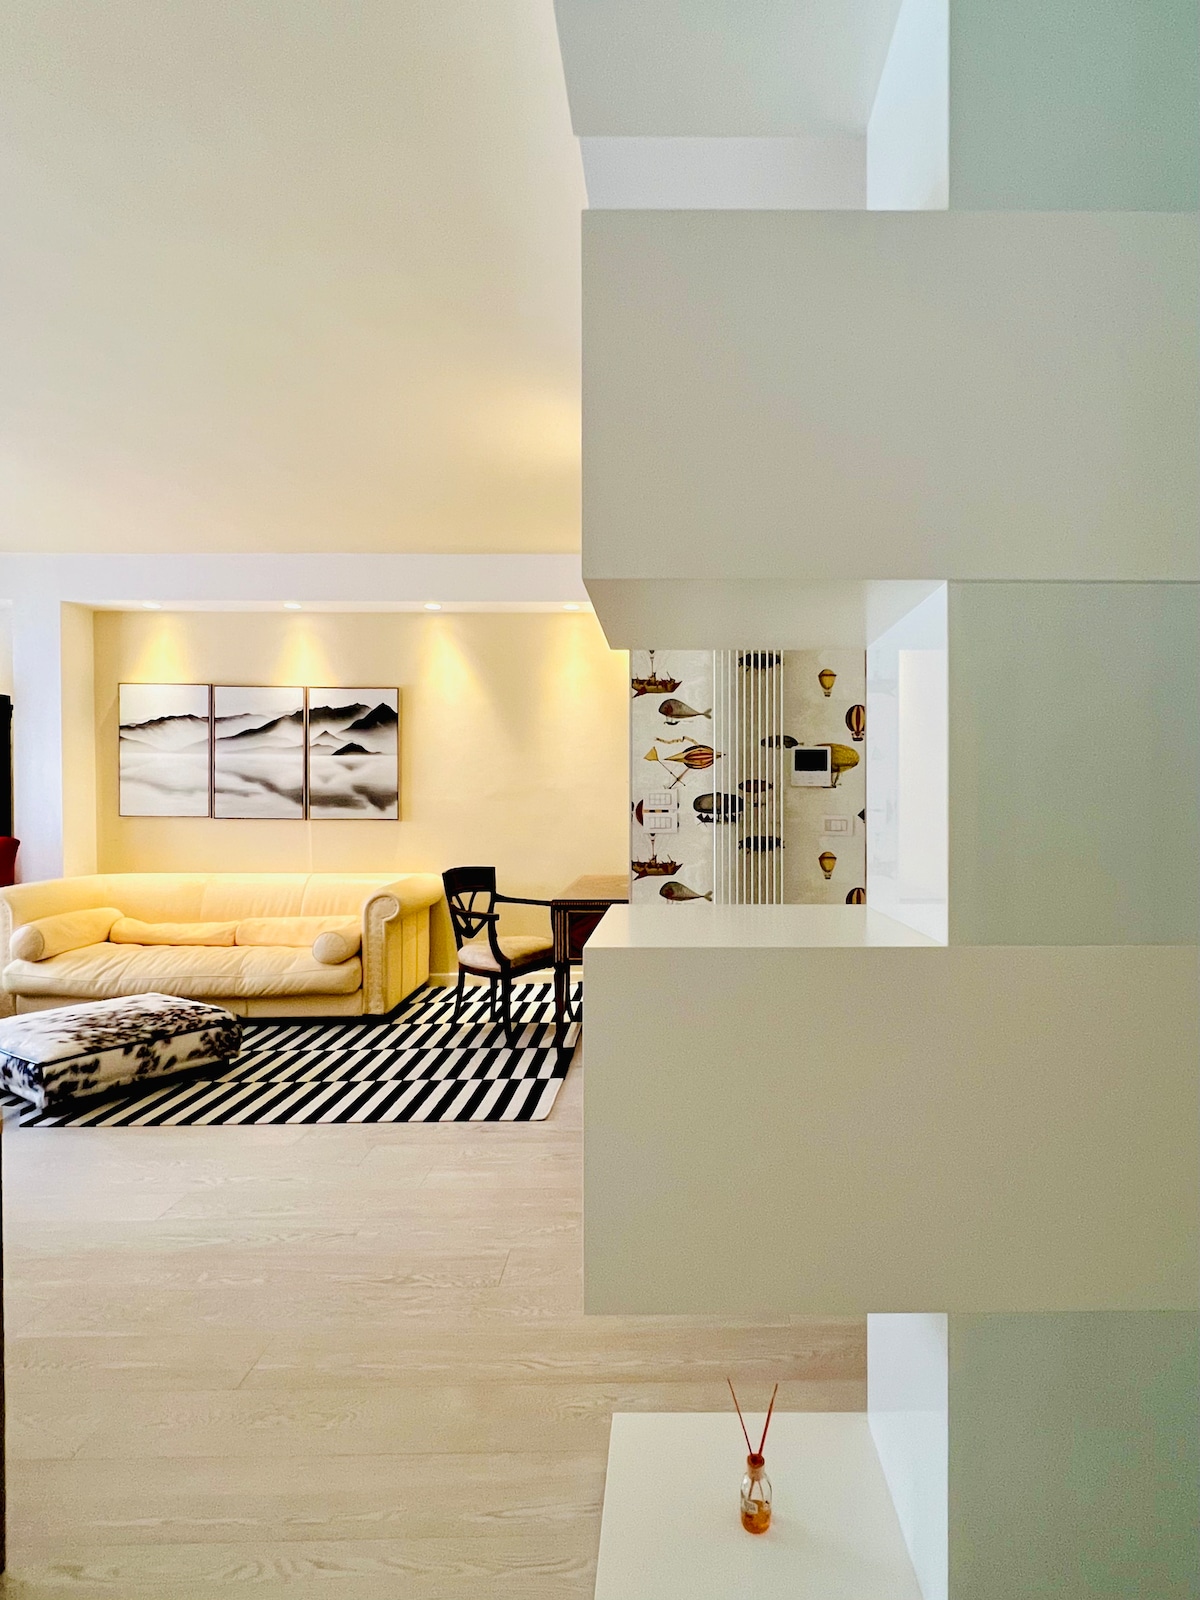
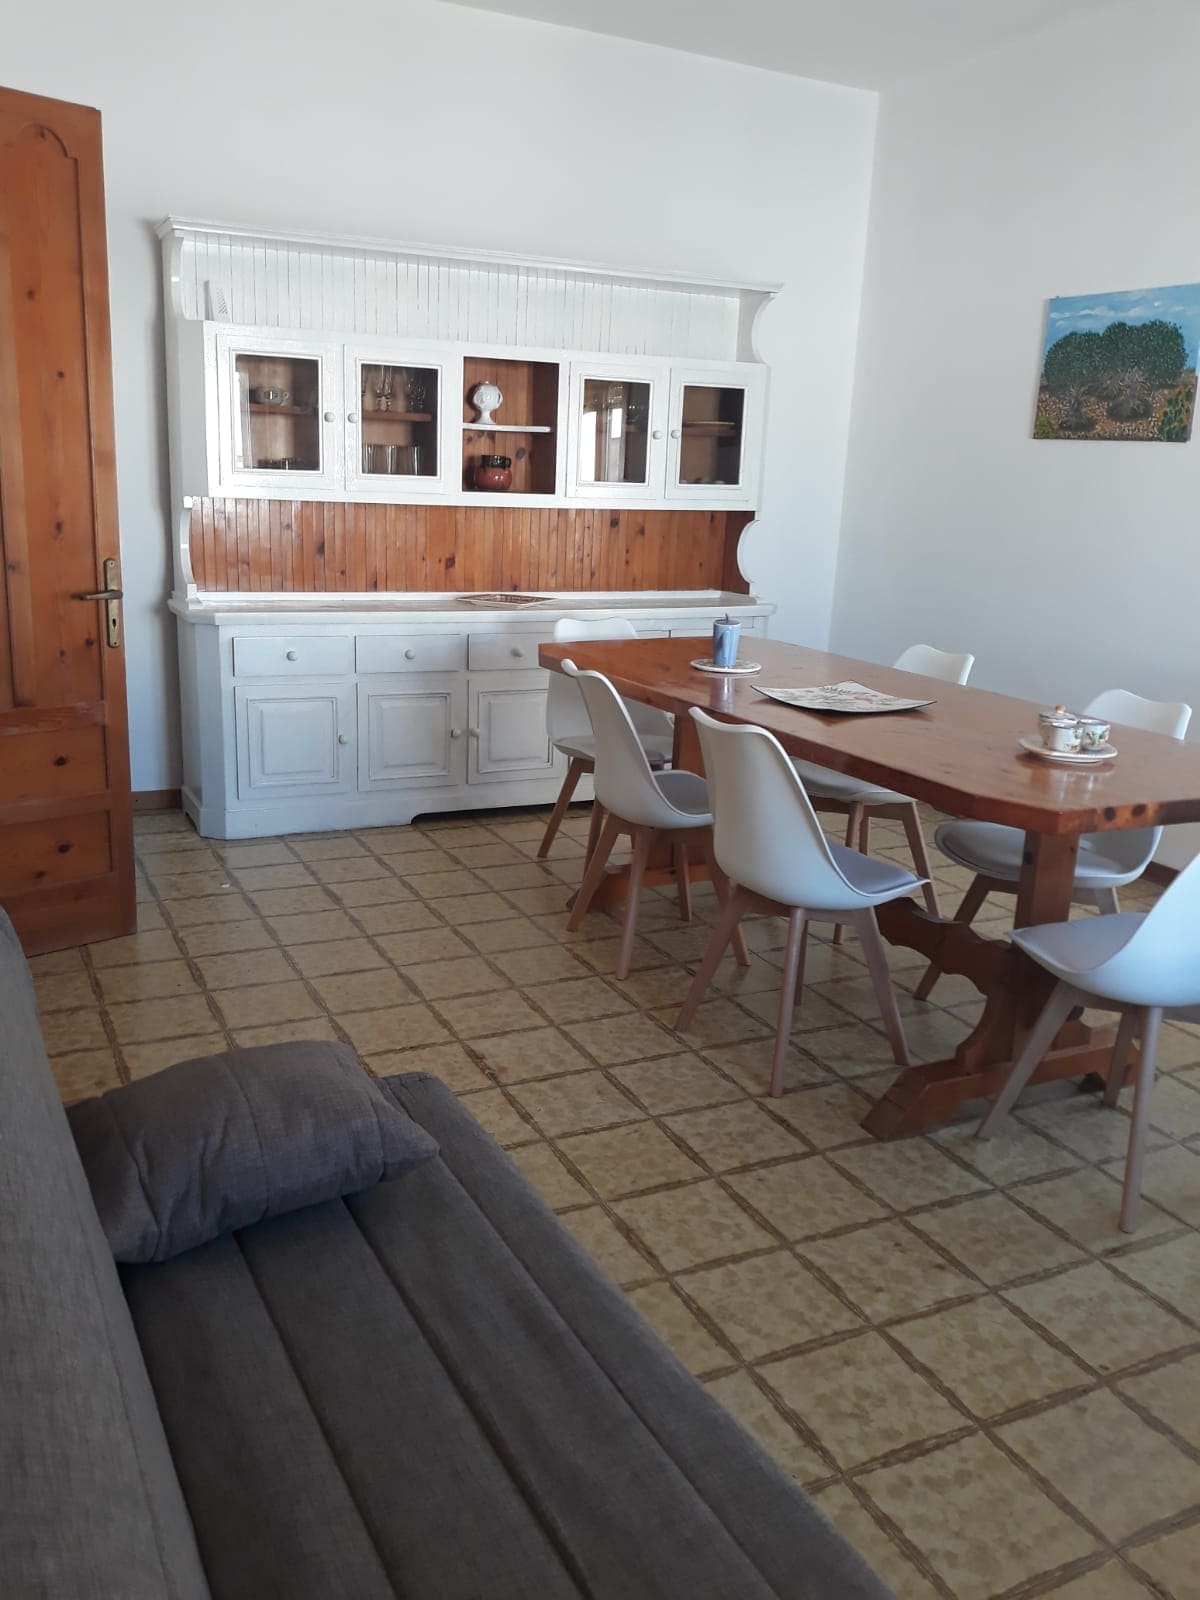
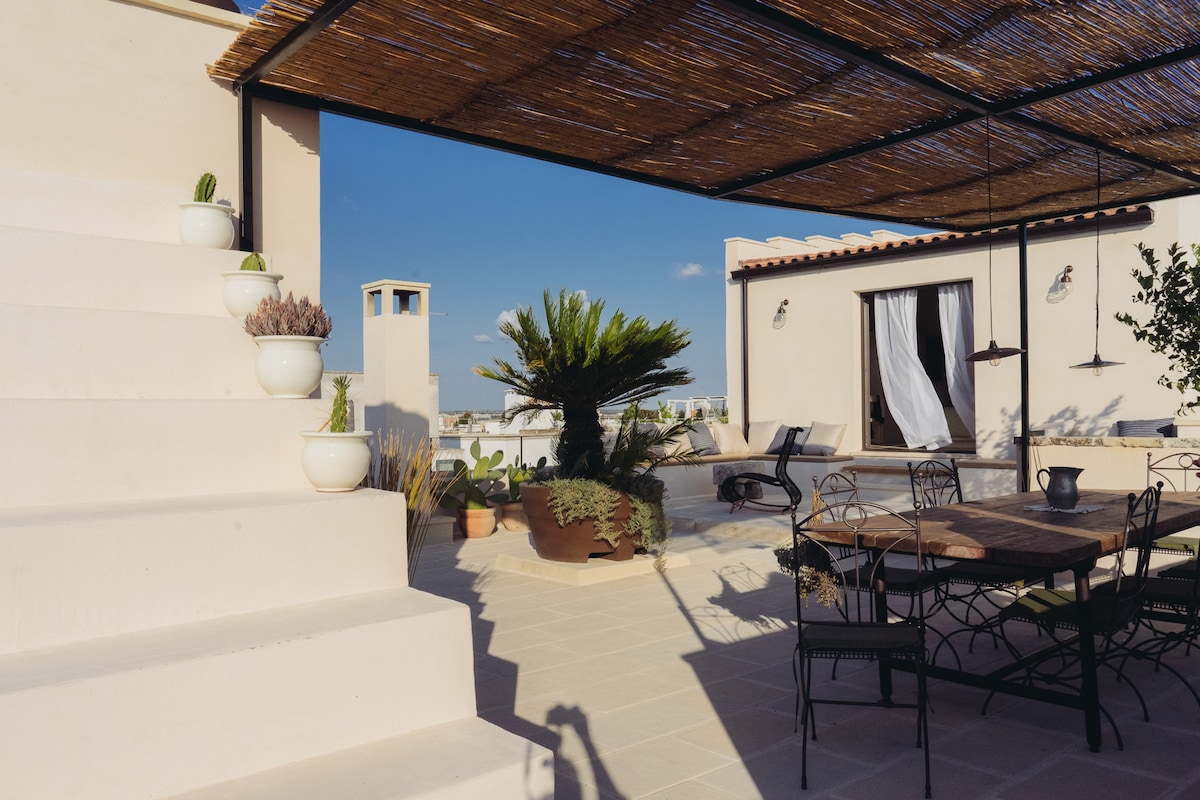
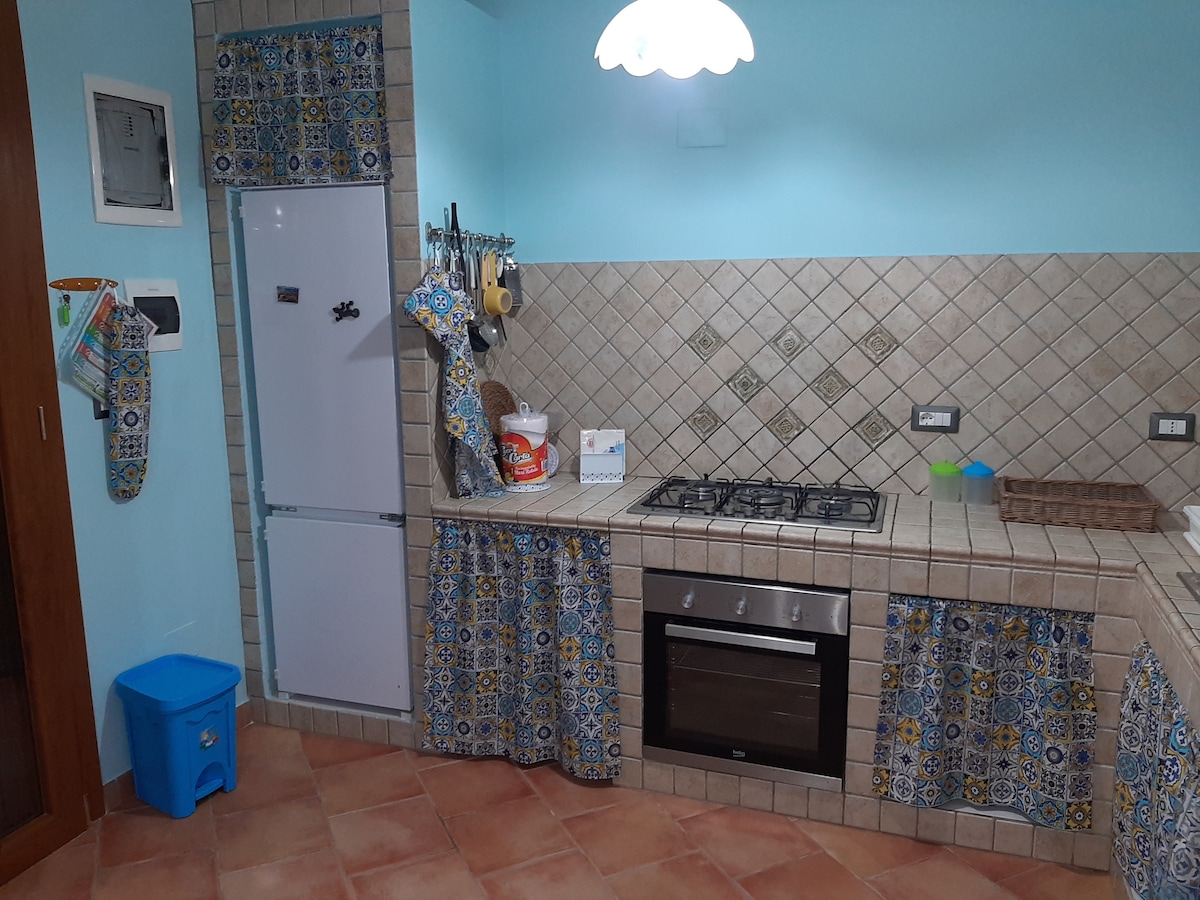
Porto Cesareo, with its fine white-sand beaches and crystal-clear marine protected area, offers a Caribbean paradise in the heart of Salento. It is a vibrant and beloved seaside destination attracting international tourism seeking untouched sea, sailing, and exceptional coastal nature like Rabbit Island. The Airbnb market is very active here, featuring an occupancy rate of 63%. Visitors appreciate modern apartments near the beaches and holiday homes in quiet residential neighborhoods, paying an average daily rate of €159. Its reputation as the Salento sea capital ensures consistent year-round profitability for property owners throughout the summer.
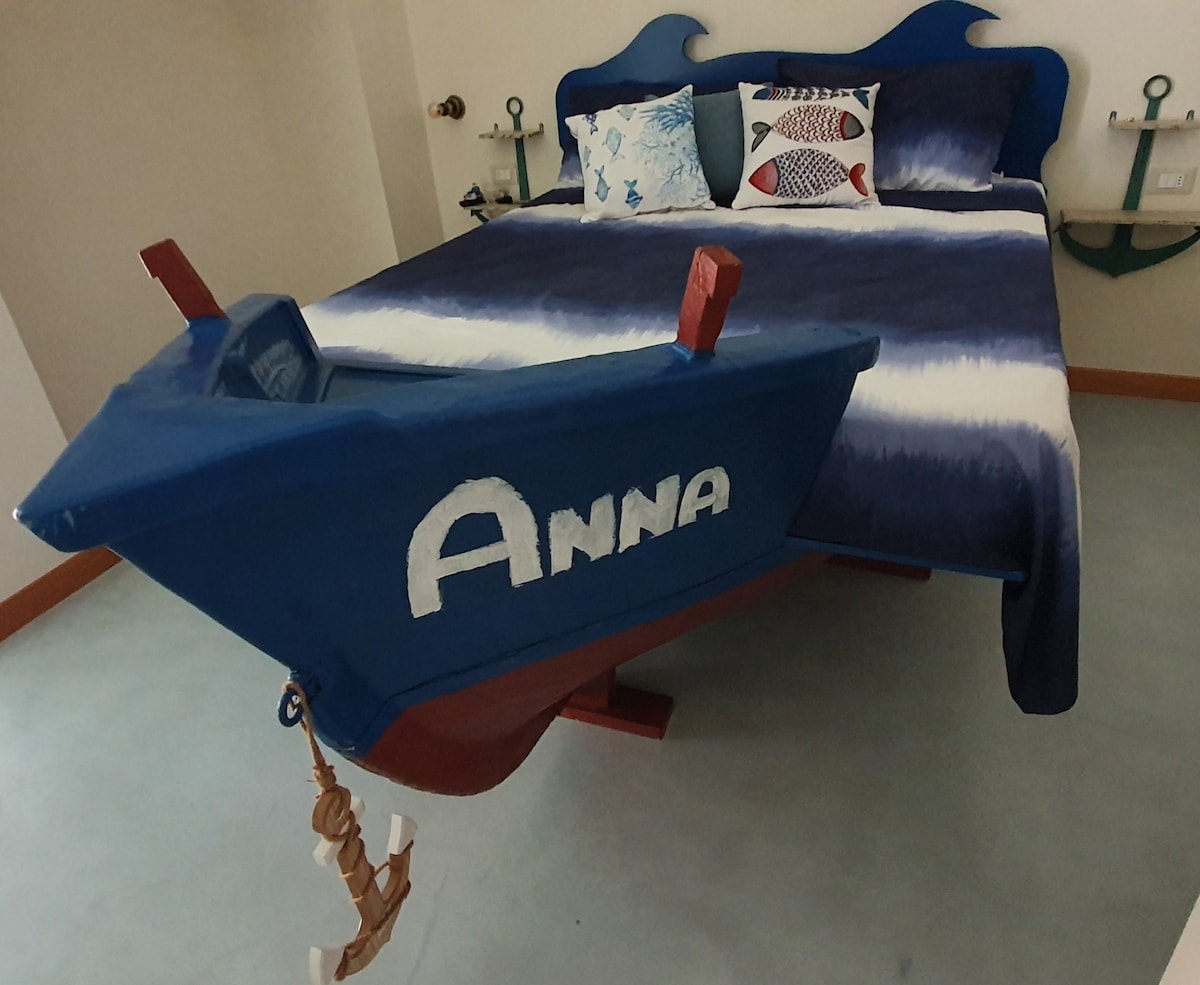
Featured Listings
Gallipoli, known as the ‘Beautiful City’ in the heart of Salento, is an Ionian gem perched on an island connected to the mainland, famous for its Aragonese walls and Caribbean-like beaches like Baia Verde. It is a vibrant destination merging history, entertainment, and crystal-clear waters, attracting a young and family-oriented international crowd year-round. The Airbnb market is very active here, featuring an occupancy rate of 54%. Visitors appreciate the charm of old-town apartments and the modernity of holiday homes near the waterfront, paying an average daily rate of €156. Its reputation as the entertainment capital of Salento ensures consistent year-round profitability for owners.
Featured Listings
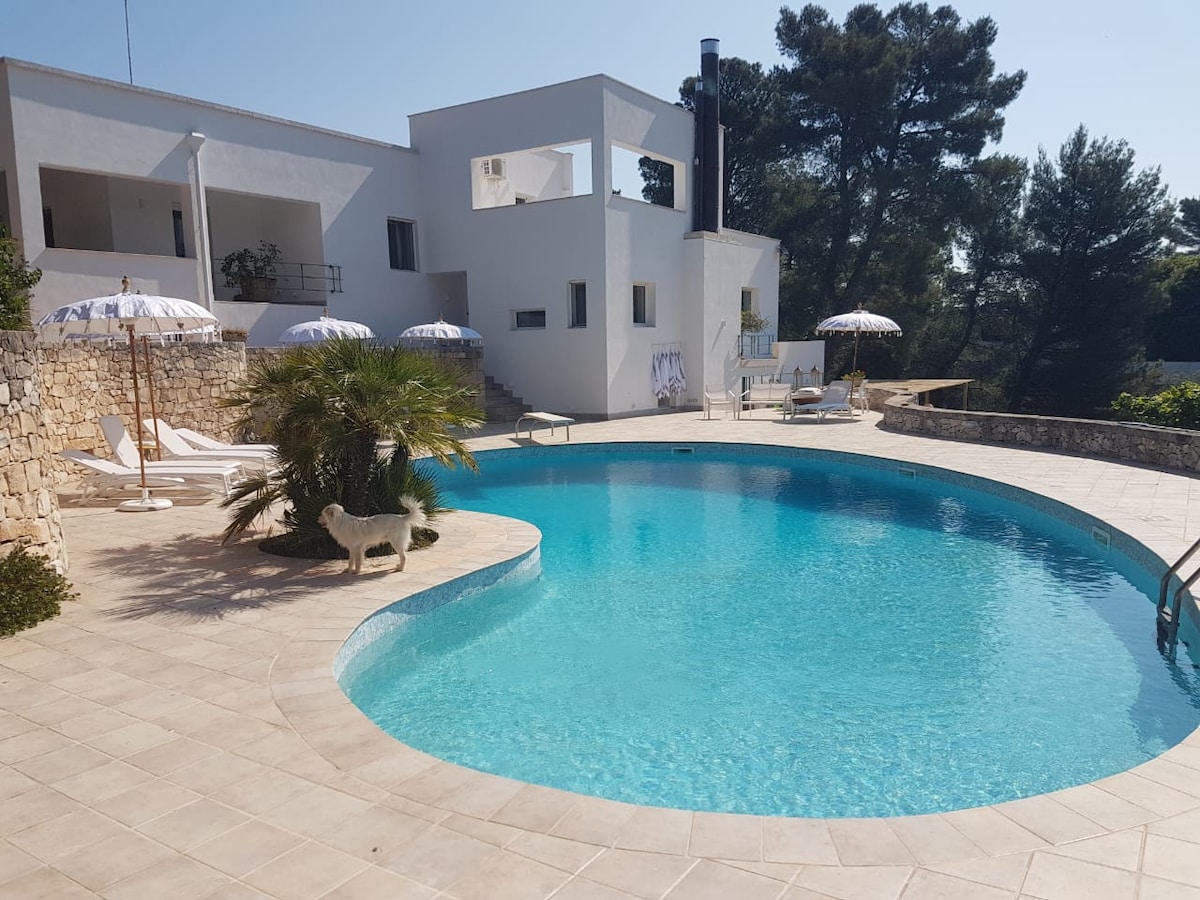
Carovigno, nestled among expanses of ancient olive groves and bordered by the crystal-clear waters of the Torre Guaceto reserve, is a gem of authenticity and prestige in the heart of Puglia. Famous for its imposing castle and gastronomic excellence, it attracts international tourism seeking privacy and untouched nature in an exclusive setting. The rental market is extraordinarily profitable here, featuring an average daily rate of €279. Visitors seek exclusive farmsteads with pools and the charm of whitewashed houses in the ancient village, generating an annual revenue of €61,339. Its protected beauty ensures high-level demand.
Featured Listings

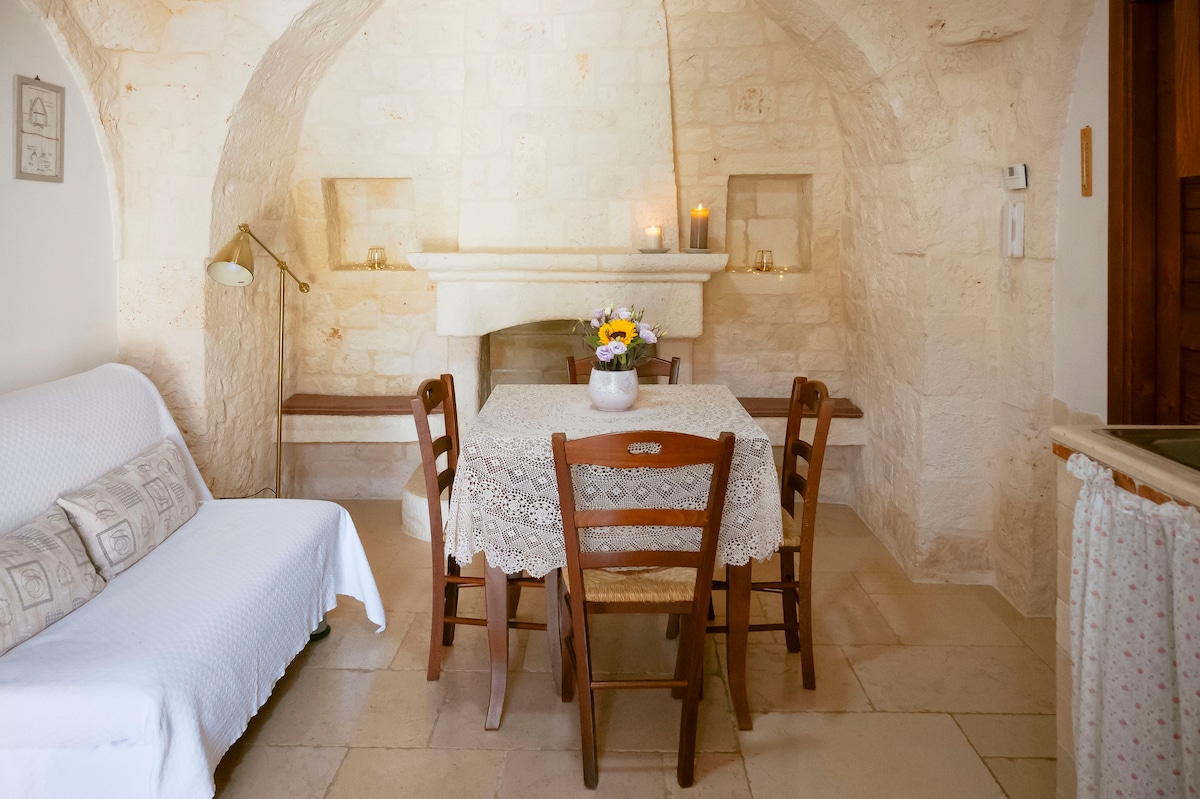
Martina Franca, the Baroque queen of the Itria Valley perched on a scenic hill, enchants with its stately palaces, white alleys, and the prestige of its Opera Festival. It is an elite destination attracting international tourism seeking elegance, history, and unique agricultural landscapes dominated by trulli. The rental market is highly profitable here, featuring an average daily rate of €222. Visitors seek exclusive renovated trulli in the countryside and the charm of historic apartments in the monumental center, generating an annual revenue of €43,531. Its reputation as a refined city of art ensures high-level demand.
Featured Listings

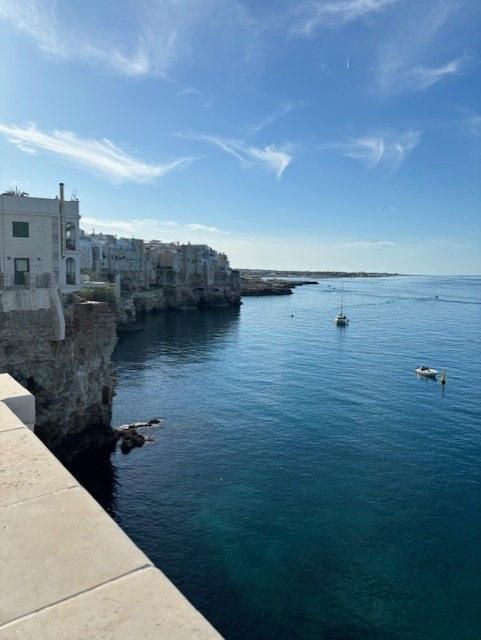
Polignano a Mare, perched on cliffs overlooking the Adriatic Sea, is an icon of rare beauty famous for Lama Monachile beach and its spectacular sea caves. It is a world-class destination made famous by Domenico Modugno and high-diving competitions, attracting international tourism seeking breathtaking views and Puglian authenticity. The rental market is extraordinarily profitable here, featuring an occupancy rate of 60%. Visitors seek the charm of ancient village apartments and the exclusivity of sea-view residences with balconies, paying an average daily rate of €182. Its legendary beauty ensures relentless demand.
Featured Listings
Nardò, set between its Baroque city-center beauty and the wild splendor of the Porto Selvaggio reserve, offers an authentic and high-class Puglian experience. It is a prestigious destination attracting international tourism seeking history, untouched nature, and crystal-clear seaside spots like Santa Caterina and Santa Maria al Bagno. The Airbnb market is very solid here, featuring an occupancy rate of 57%. Visitors seek the charm of apartments in noble city-center palaces and the exclusivity of sea-view residences, paying an average daily rate of €156. Its rich heritage and environment ensure consistent year-round profitability for owners.
Featured Listings
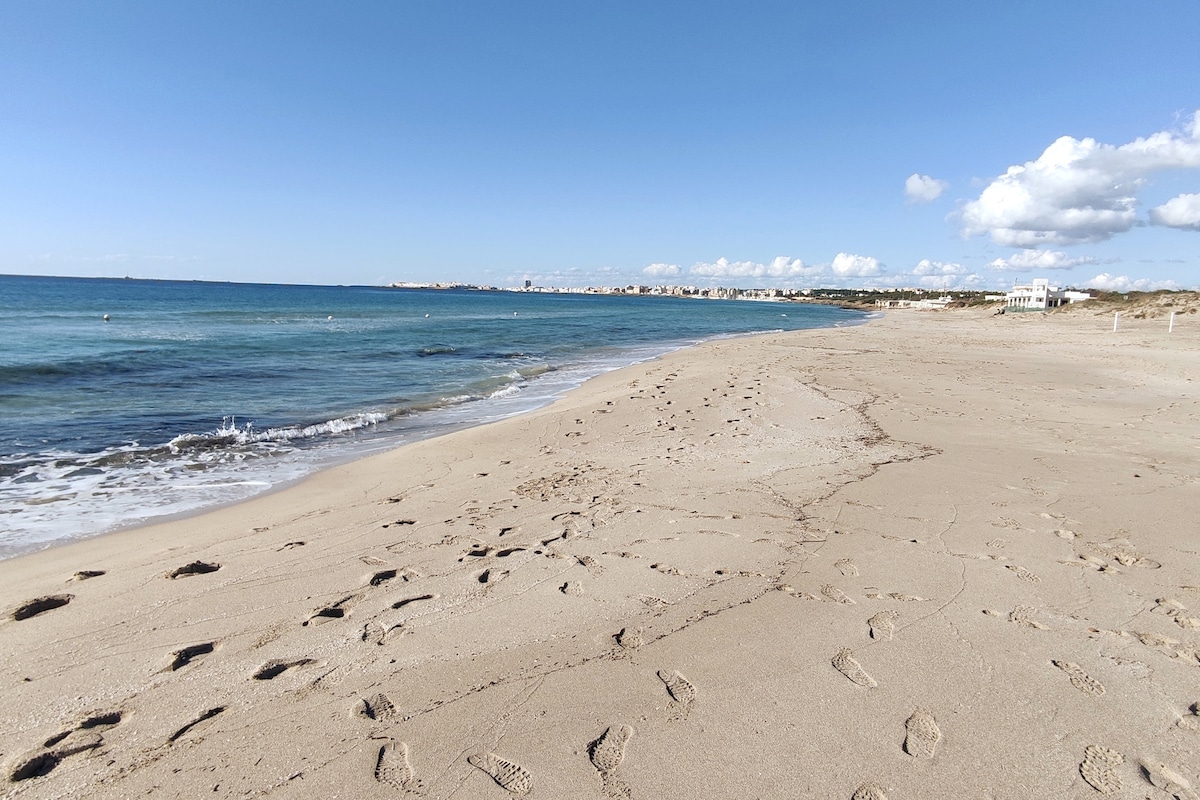
Salve, a jewel of southern Salento famous for the ‘Maldives of Salento’ in Pescoluse, offers fine white sand beaches and crystal-clear water of rare beauty. It is a premier seaside destination merging Ionian coast relaxation with the charm of its inland villages rich in history and underground oil mills. The Airbnb market is very dynamic here, featuring an occupancy rate of 62%. Visitors appreciate modern apartments near the sea and the tranquility of holiday homes in the historic centers, paying an average daily rate of €175. Generating an annual revenue of €39,972, Salve is a winning choice for those focusing on quality beach tourism.
Featured Listings
Get Live Puglia, Italy Market Intelligence
Discover detailed Puglia, Italy Airbnb Analytics and explore real-time market data to make accurate investment decisions.
Explore Real-time Analytics