Airbnb Occupancy Rates in Geelong, Victoria(October 2026)
Short-term rentals across Geelong generate an average of A$53,368 per year, with a typical occupancy rate of 46% and daily rates averaging A$316. As of October 2026, there were 1,471 active listings on Airbnb from the city centre to the Bellarine Peninsula—Barwon Heads, Ocean Grove, Point Lonsdale, and Portarlington.
Geelong is Victoria’s second city and the gateway to the Great Ocean Road, blending waterfront dining, AFL culture, and premium coastal escapes. Investors often pair urban apartments near the CBD with high-ADR holiday homes on the peninsula.
Geelong Airbnb Market Map (October 2026)
Geelong Market Performance
Australia average: 58% occupancy, A$333 per night.
Airbnb occupancy rates by city in AustraliaPeriod: October 2025 - September 2026
Is Airbnb a Good Investment in Geelong?
YES, Geelong is a worthwhile short-term rental market for investors who focus on coastal submarkets and accept more seasonal occupancy than inner Melbourne.
Geelong’s metro average occupancy sits below Melbourne or Sydney, but daily rates are strong and peninsula towns like Barwon Heads and Ocean Grove deliver standout revenue for well-presented whole homes. Melbourne spillover, weekend beach demand, and events at GMHBA Stadium support the urban core. Compliance follows Victoria-wide short-stay levy and owners-corporation rules, with planning assessed under the Greater Geelong Planning Scheme.
Market Comparison: Geelong vs. Major Australian Markets
| Market | Avg Revenue | Occupancy | What stands out |
|---|---|---|---|
| Geelong | A$53,368 | 46% | Great Ocean Road gateway; Bellarine Peninsula holiday stock. |
| Melbourne | A$59,054 | 60% | Larger urban market; higher occupancy, more competition. |
| Sydney | A$81,843 | 68% | Highest revenue; NSW 180-day cap and STRA register. |
| Gold Coast City | A$95,105 | 69% | Queensland beach-holiday market; higher average revenue. |
| Adelaide | A$63,206 | 63% | Mid-size capital; festival and wine-region tourism. |
Strategic Advantages
- Melbourne proximity: Under 90 minutes to Melbourne drives weekenders and event overflow.
- Bellarine Peninsula: Barwon Heads, Ocean Grove, and Point Lonsdale command premium coastal rates.
- Great Ocean Road: International and domestic road-trippers use Geelong as a launch point.
- Strong ADR: Nightly rates often exceed metro averages despite softer year-round occupancy.
Get Live Geelong Market Intelligence
Discover detailed Geelong Airbnb Analytics and explore real-time market data to make accurate investment decisions.
Explore Real-time Analytics
How Often Will Your Airbnb Be Booked in Geelong?
View Demand Patterns →Occupancy rates directly impact your revenue potential. Understanding demand patterns helps you set realistic expectations and optimize your availability strategy.
The current average occupancy rate in Geelong is 46%, meaning properties are booked for about 169 nights per year. However, occupancy varies significantly based on property quality and management. Here's what you can expect:
Airbnb Occupancy Tiers in Geelong
Premium(Top 10%) | High-performing(Top 25%) | Average(Median) | Low-performing(Bottom 25%) |
|---|---|---|---|
| 85% | 60% | 33% | 12% |
*High desirability & optimized availability | *Good market fit & guest satisfaction | *Standard market performance | *Higher vacancy, optimization needed |
Seasonal Occupancy Patterns in Geelong
February, December
Highest demand and occupancy rates. Perfect for premium pricing strategies and maximizing revenue. Consider longer minimum stays and higher rates.
October, August
Moderate demand with balanced pricing opportunities. Good for attracting budget-conscious travelers while maintaining reasonable occupancy rates.
June, May
Lower demand requires competitive pricing and creative marketing. Focus on local events, extended stay discounts, and targeting specific traveler segments.
How Much Can You Earn with Airbnb in Geelong?
Calculate Earnings →One of the most common questions for potential Airbnb hosts in Geelong is about earning potential. Let's break down the revenue patterns and what you can realistically expect to earn.
Monthly Revenue Trends in Geelong
Best-in-class Airbnb properties (top 10%) in Geelong achieve around A$69,264 annually, while strong performers (top 25%) earn at least A$45,347. Typical properties generate about A$24,560 per year, and entry-level listings (bottom 25%) see earnings near A$8,332, often with room for optimization. Keep in mind, these are market averages—your actual earnings can be even higher depending on your property's location, bedrooms, guest capacity, and unique amenities.
Want to see how your listing could perform? Create a free account to unlock personalized analytics and explore exclusive insights in our app!
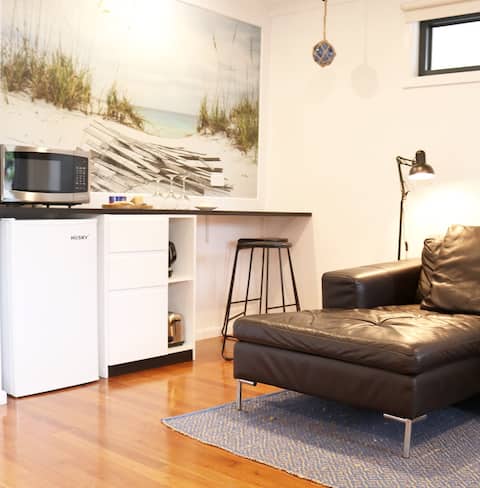
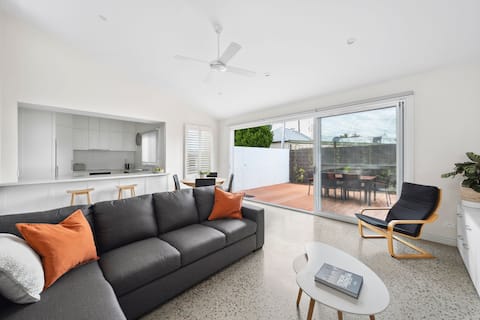
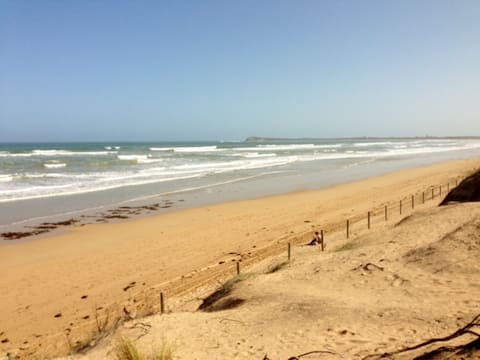
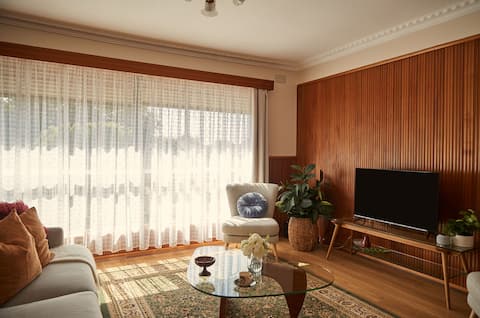
What Can You Learn from Top-Performing Airbnbs in Geelong?
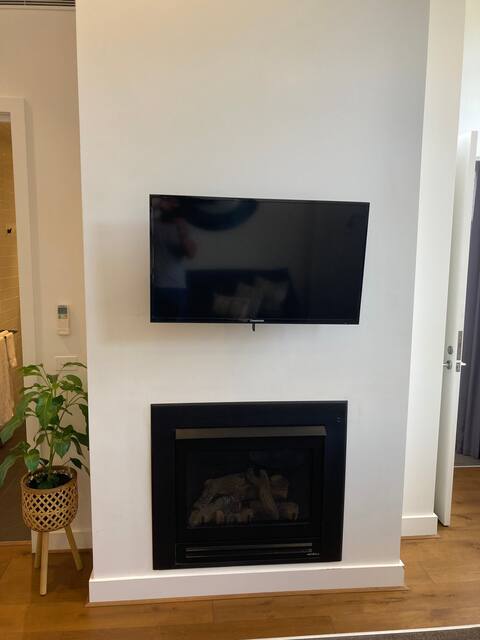
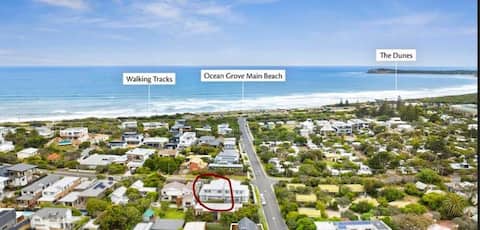
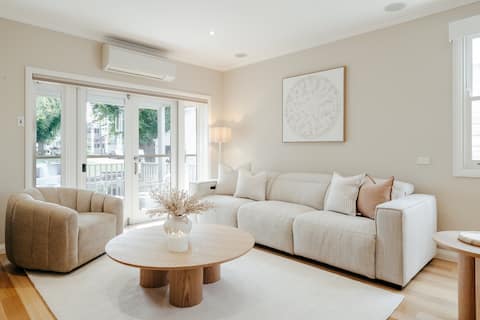
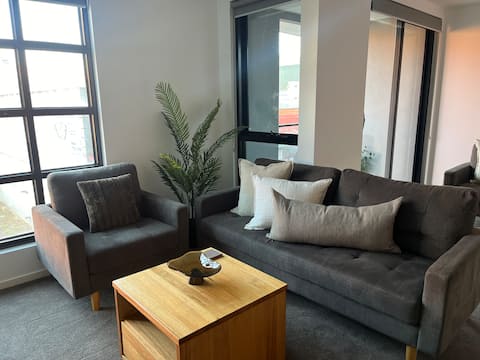
View Top Performers →Studying successful properties provides valuable insights for your own Airbnb strategy. Here are the top-performing listings in Geelong and what makes them successful.
Geelong Market Analysis
Geelong Short-Term Rental Market Insights
Geelong is effectively two markets in one council area: an urban waterfront city (CBD, Geelong West, Highton) and a Bellarine Peninsula holiday coast (Ocean Grove, Barwon Heads, Point Lonsdale, Portarlington). Metro-wide averages hide how strong coastal listings can be—and how seasonal they are.
Demand Drivers
Weekend and school-holiday demand dominates the peninsula, with families targeting beaches, the Queenscliff–Sorrento ferry, and coastal golf. The city centre draws AFL crowds, Deakin University semesters, hospital and port-related travel, and Melbourne residents seeking a cheaper waterfront break.
Great Ocean Road tourism adds drive-through and overnight demand, especially in summer. Events and cruise-ship days at nearby ports can lift CBD occupancy briefly.
Seasonality
Summer (December–February) is peak season for Ocean Grove, Barwon Heads, and Point Lonsdale. Urban Geelong holds up better in cooler months thanks to university, healthcare, and Melbourne day-trippers. Winter peninsula occupancy often dips below 40%—investors should model cash flow seasonally, not on annual averages alone.
Investment Outlook
Coastal whole homes reward professional management and standout presentation; urban apartments suit investors targeting steadier mid-week demand. Run a Greater Geelong Planning Scheme check per address before buying—whole-home short-stay may need a permit depending on zone. Budget for Victoria’s 7.5% short-stay levy on non–principal-residence bookings from 1 January 2025.
What Are the Airbnb Regulations in Geelong?
Understanding local regulations is crucial for operating a successful Airbnb. Let's examine the compliance landscape and what you need to know about licensing requirements in Geelong.
Registration Numbers on Airbnb
None of the active Airbnb listings we tracked last month display a registration or license number.
This reflects what hosts publish on their Airbnb listings, not the local legal requirements. Always confirm them with local authorities.
Short-term rental accommodation in Geelong is regulated under Victorian state law and the Greater Geelong Planning Scheme. City of Greater Geelong does not operate a separate Airbnb licence or published annual day cap beyond state rules.
Victoria Short-Stay Levy (from 1 January 2025)
- A 7.5% levy applies to booking fees for stays under 28 consecutive days in the same property.
- Booking platforms usually collect and remit the levy; direct bookings require registration with the State Revenue Office.
- The levy does not apply when the property is the owner’s or renter’s principal place of residence (including letting while temporarily away). Exempt hosts must submit a declaration to platforms.
Owners Corporation Rules (Apartments & Strata)
- From 1 January 2025, an owners corporation can pass a 75% special resolution to ban short-stay use of lots—except lots that are the owner-occupier’s principal place of residence.
- See Consumer Affairs Victoria — OC rules to ban short-stay accommodation.
Planning in Greater Geelong
- Whether whole-home short-stay needs a planning permit depends on zone and land use under the Greater Geelong Planning Scheme—outcomes vary between urban, coastal, and rural zones.
- Apply and enquire via City of Greater Geelong planning permits before listing an investment property.
Official Sources
What Should You Charge for Your Airbnb in Geelong?
Smart Pricing Tools →Pricing is one of the most critical decisions for Airbnb success. Let's analyze the current pricing landscape and help you understand what rates you can realistically charge.
The current average daily rate in Geelong is A$316 per night. However, pricing varies significantly based on property quality and location. Here's what different property tiers typically charge:
Airbnb Pricing Tiers in Geelong
Premium(Top 10%) | High-performing(Top 25%) | Average(Median) | Budget(Bottom 25%) |
|---|---|---|---|
| A$492per night | A$347per night | A$235per night | A$111per night |
*Top locations, big properties, premium amenities | *Good property management, highly rated | *Standard market performance | *Basic properties, less desirable locations |
Is It Profitable to Start an Airbnb in Geelong?
Investment Analysis →Understanding the profitability potential is crucial for any Airbnb investment decision. Let's analyze the revenue performance and profit margins in the Geelong market to help you make informed financial decisions.
Revenue Performance
Profitability Factors
Which Areas in Geelong Are Most Profitable for Airbnb?
Explore All Areas →Geelong’s short-term rental performance splits sharply between Bellarine Peninsula holiday towns and inner-city neighbourhoods. Coastal localities often lead on revenue; urban pockets deliver higher occupancy.
Top Performing Areas
Barwon Heads: Surf coast prestige leads the region with A$71,926 average annual revenue; occupancy runs 44% with strong summer peaks.
Ocean Grove: The peninsula’s largest holiday inventory averages A$59,659 in revenue at 45% occupancy—ideal for family beach houses.
Point Lonsdale: Rip-side beaches and lighthouse views support A$64,931 average revenue with 44% occupancy.
Geelong: The CBD and waterfront deliver A$50,311 average revenue at 56% occupancy for apartments near the bay and GMHBA Stadium.
Bellarine Peninsula & Bay Coast
Portarlington: Pier, wineries, and bay swimming drive A$43,148 average revenue at 37% occupancy.
St Leonards: Quiet bay beaches and golf courses yield A$47,608 average revenue with 39% occupancy.
Indented Head: Boutique coastal village appeal achieves A$46,976 average revenue at 38% occupancy on smaller inventory.
Urban & Inner Suburbs
Highton: Hillside family homes near schools and parks generate A$49,739 average revenue with 56% occupancy.
Geelong West: Pakington Street cafés and CBD access support A$43,168 average revenue at 57% occupancy.
Belmont: Shopping and lake precinct demand delivers A$42,301 average revenue with 58% occupancy.
Explore Other Markets in Australia
Airbnb Occupancy Rates in Surfers Paradise, Queensland
Gold Coast City, Australia
2,397 Active Listings
Airbnb Occupancy Rates in Byron Bay, New South Wales
Byron Shire Council, Australia
857 Active Listings