Best Airbnb Markets in Western Australia, Australia
The Western Australia, Australia short-term rental market offers diverse opportunities for investors who know where to look. By analyzing the top 6 performing markets, we’ve highlighted the towns that currently lead the way in occupancy and revenue.
Remember that the figures shown here are regional averages and should be used as a guide for further investigation. To access precise performance data, custom reports, and professional-grade analytics, head over to GuestFavorites.
Western Australia Airbnb Market Map (June 2026)
Perth is Australia’s sunniest capital, a dynamic and modern city that blends urban cool with world-class beaches and the spectacular Kings Park. As a major gateway to Western Australia, it attracts a diverse mix of business travelers and tourists drawn to its thriving waterfront and the historic charm of nearby Fremantle. The Airbnb market is exceptionally strong, featuring an occupancy rate of 71%. Travelers favor stylish city apartments and beachside homes in suburbs like Cottesloe or Scarborough, providing hosts with a consistent annual revenue of A$70,846. Its constant growth and unique outdoor lifestyle ensure high demand year-round.
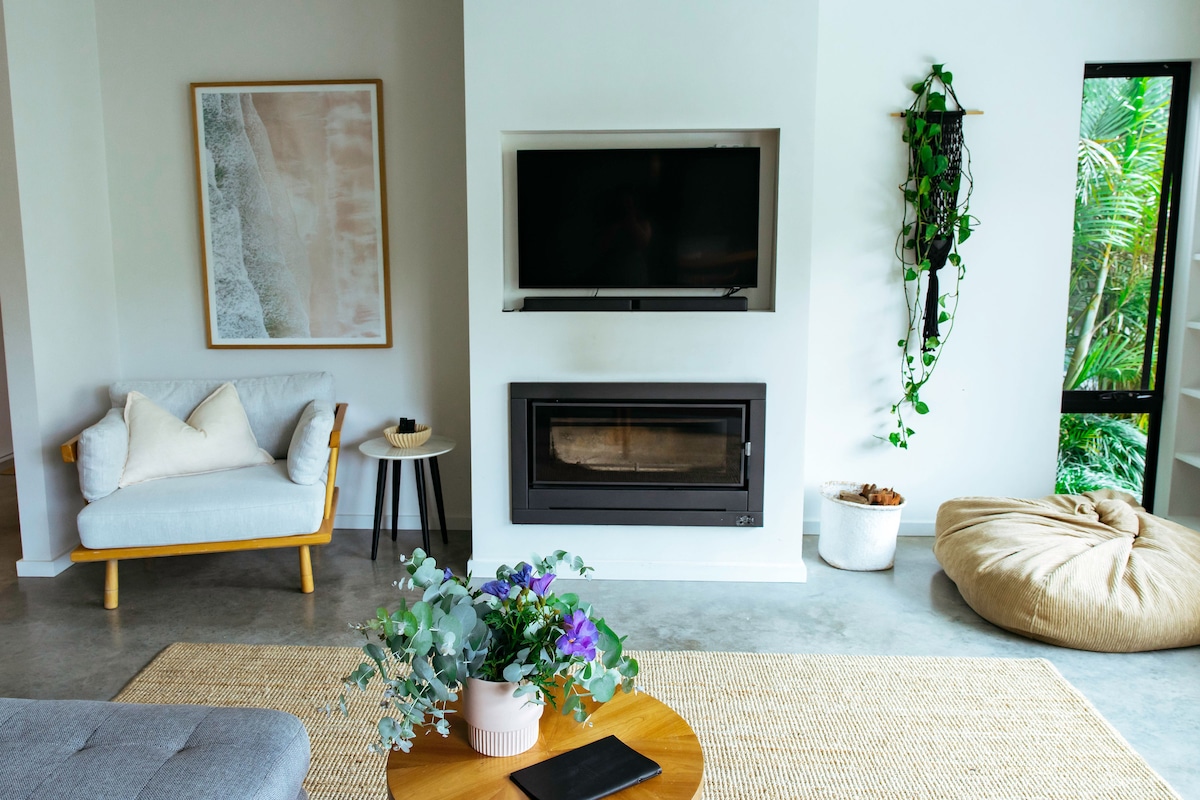
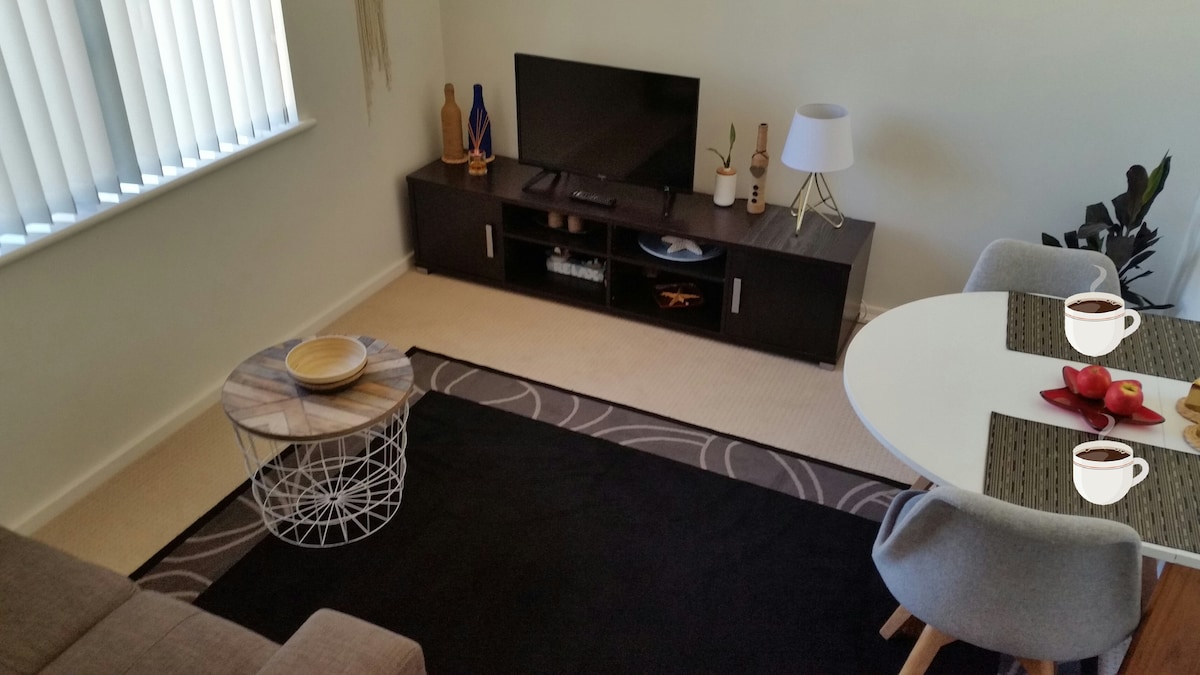
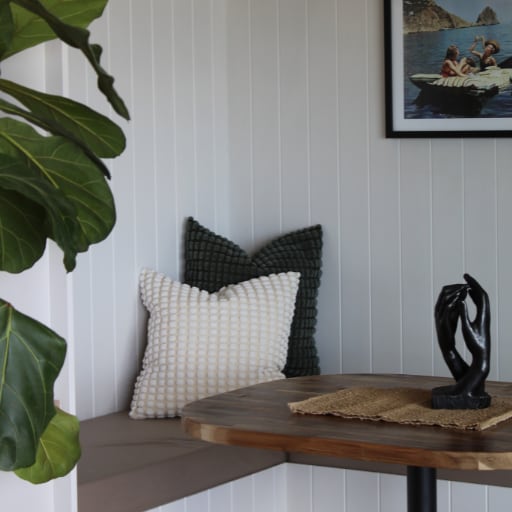
Featured Listings
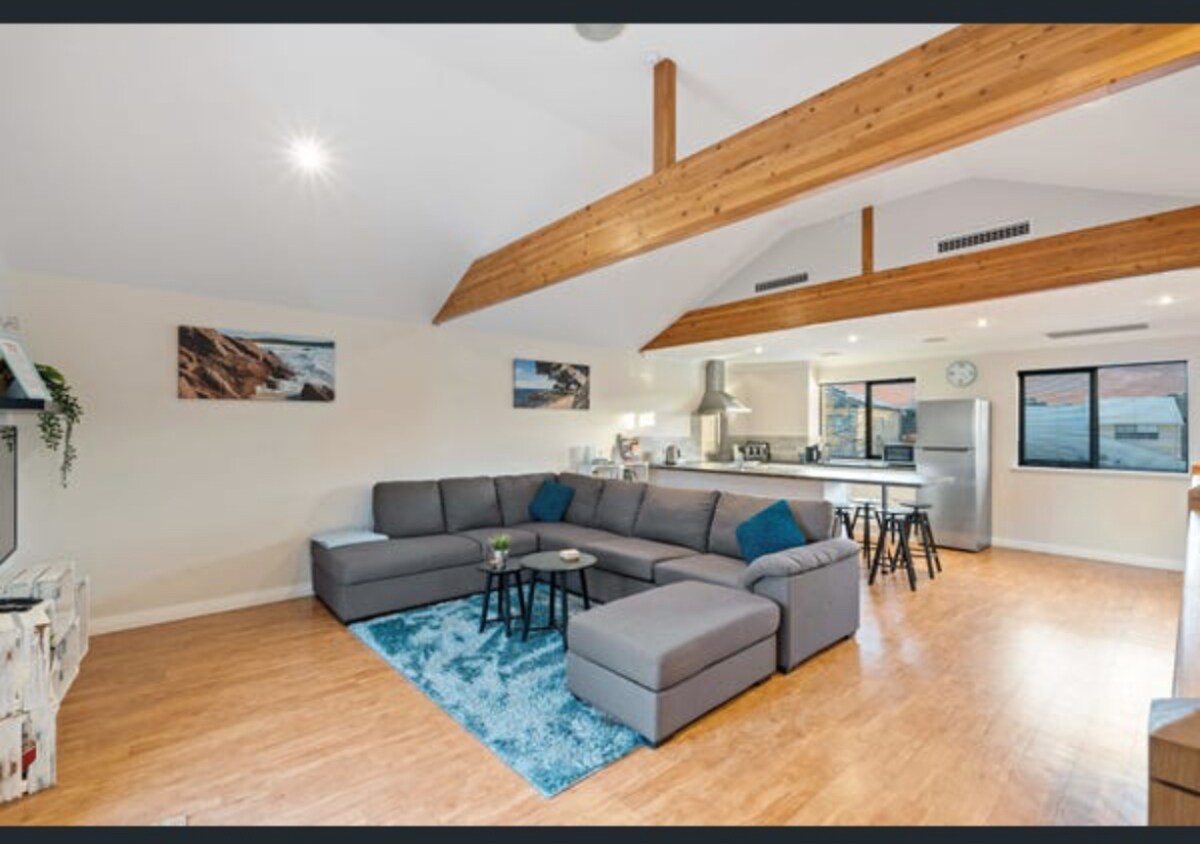
Dunsborough is the sophisticated and family-friendly heart of the Margaret River region, famous for its calm turquoise bays and proximity to world-class wineries. It offers a relaxed coastal lifestyle that is highly appealing to travelers seeking a premium getaway. The short-term rental market is robust, with an occupancy rate of 56%. Visitors seek modern holiday homes and stylish villas close to the pristine beaches of Geographe Bay, generating a strong annual revenue of A$89,581. Its status as a premier holiday destination for Perth residents ensures high seasonal peaks and reliable returns for hosts.
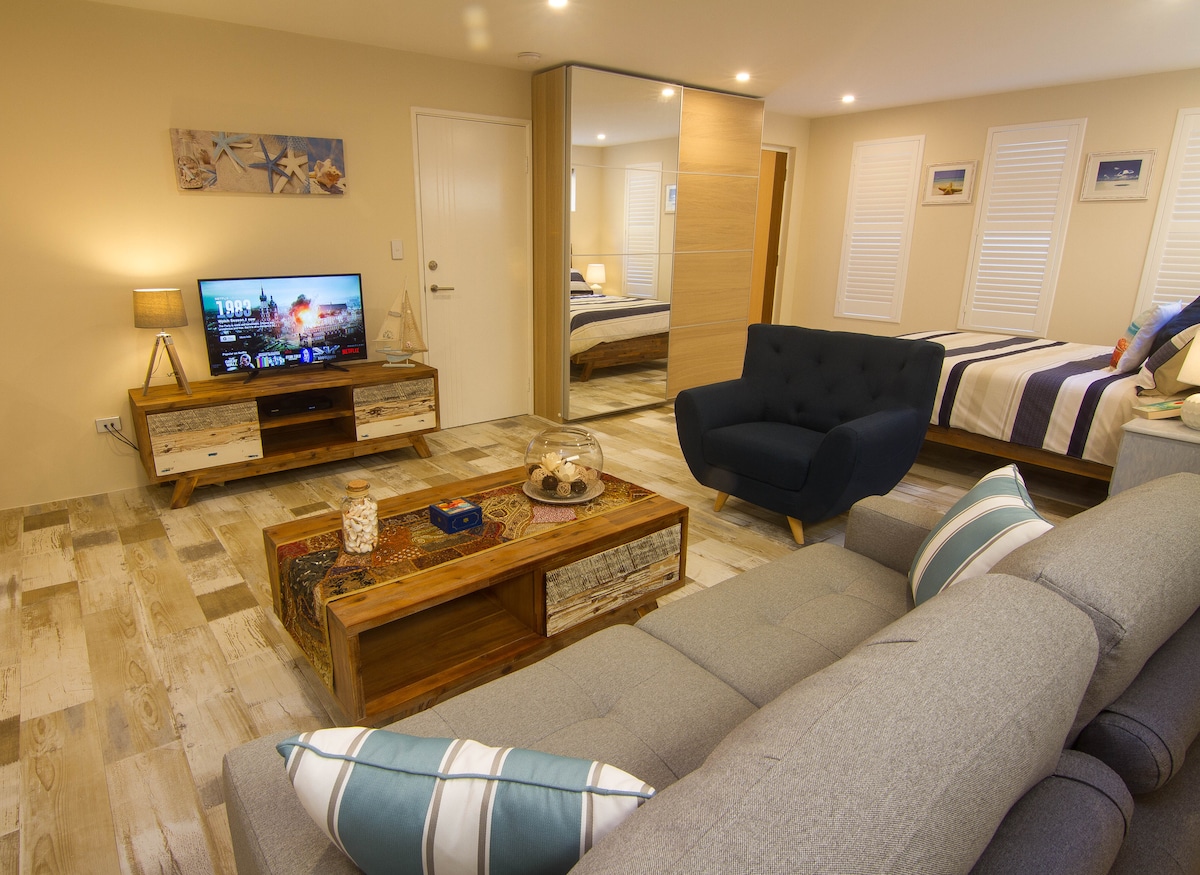
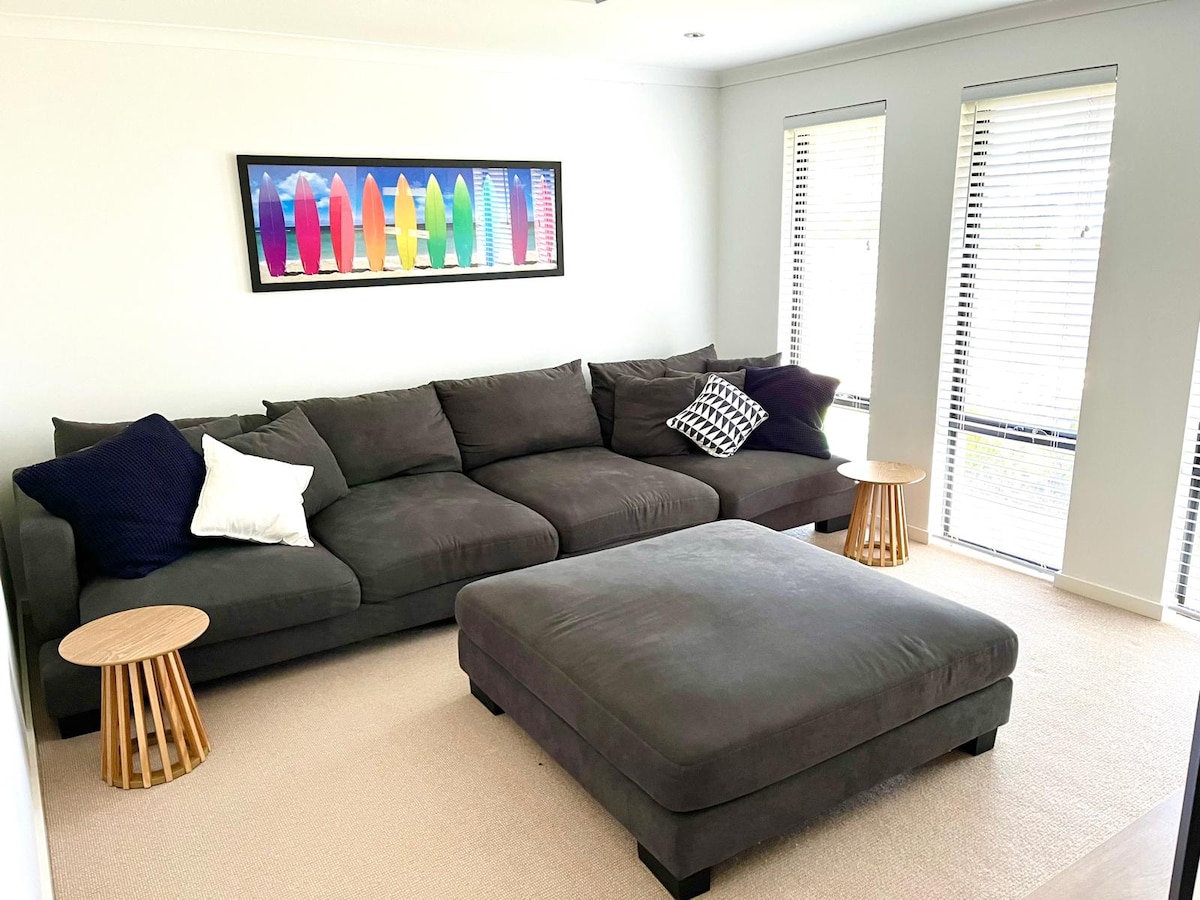
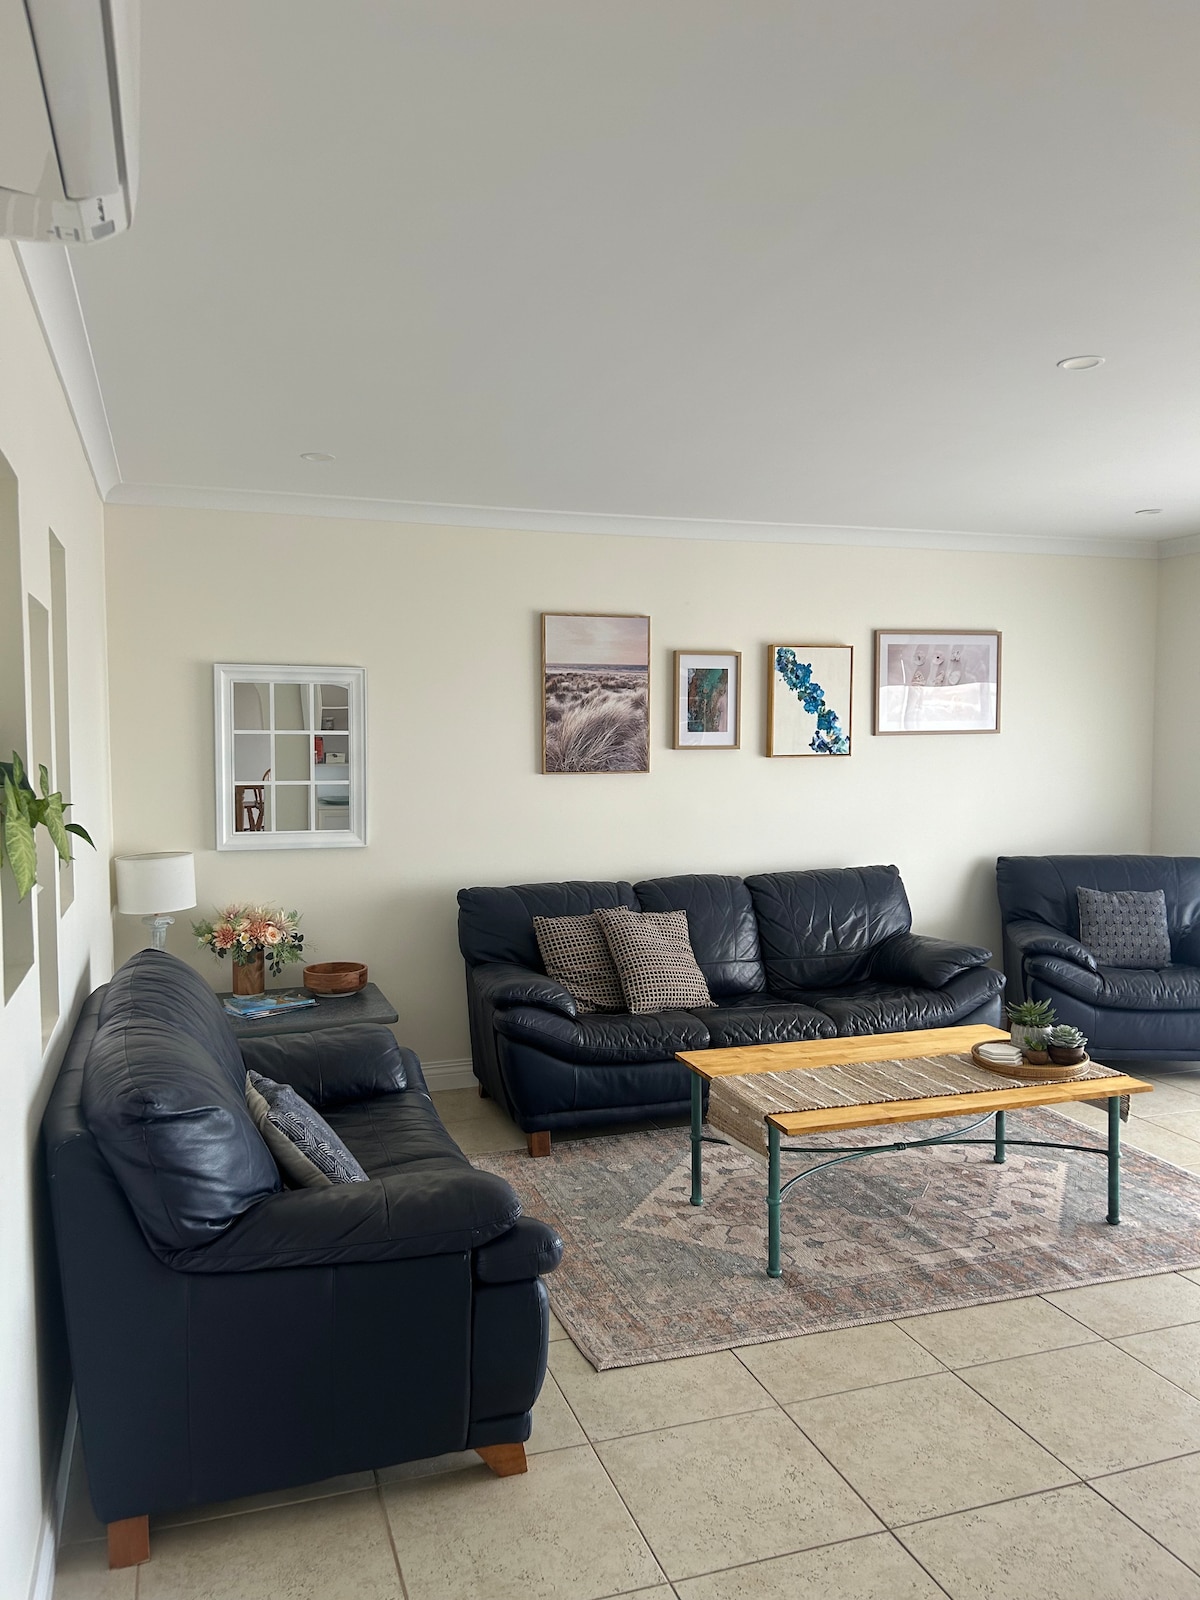
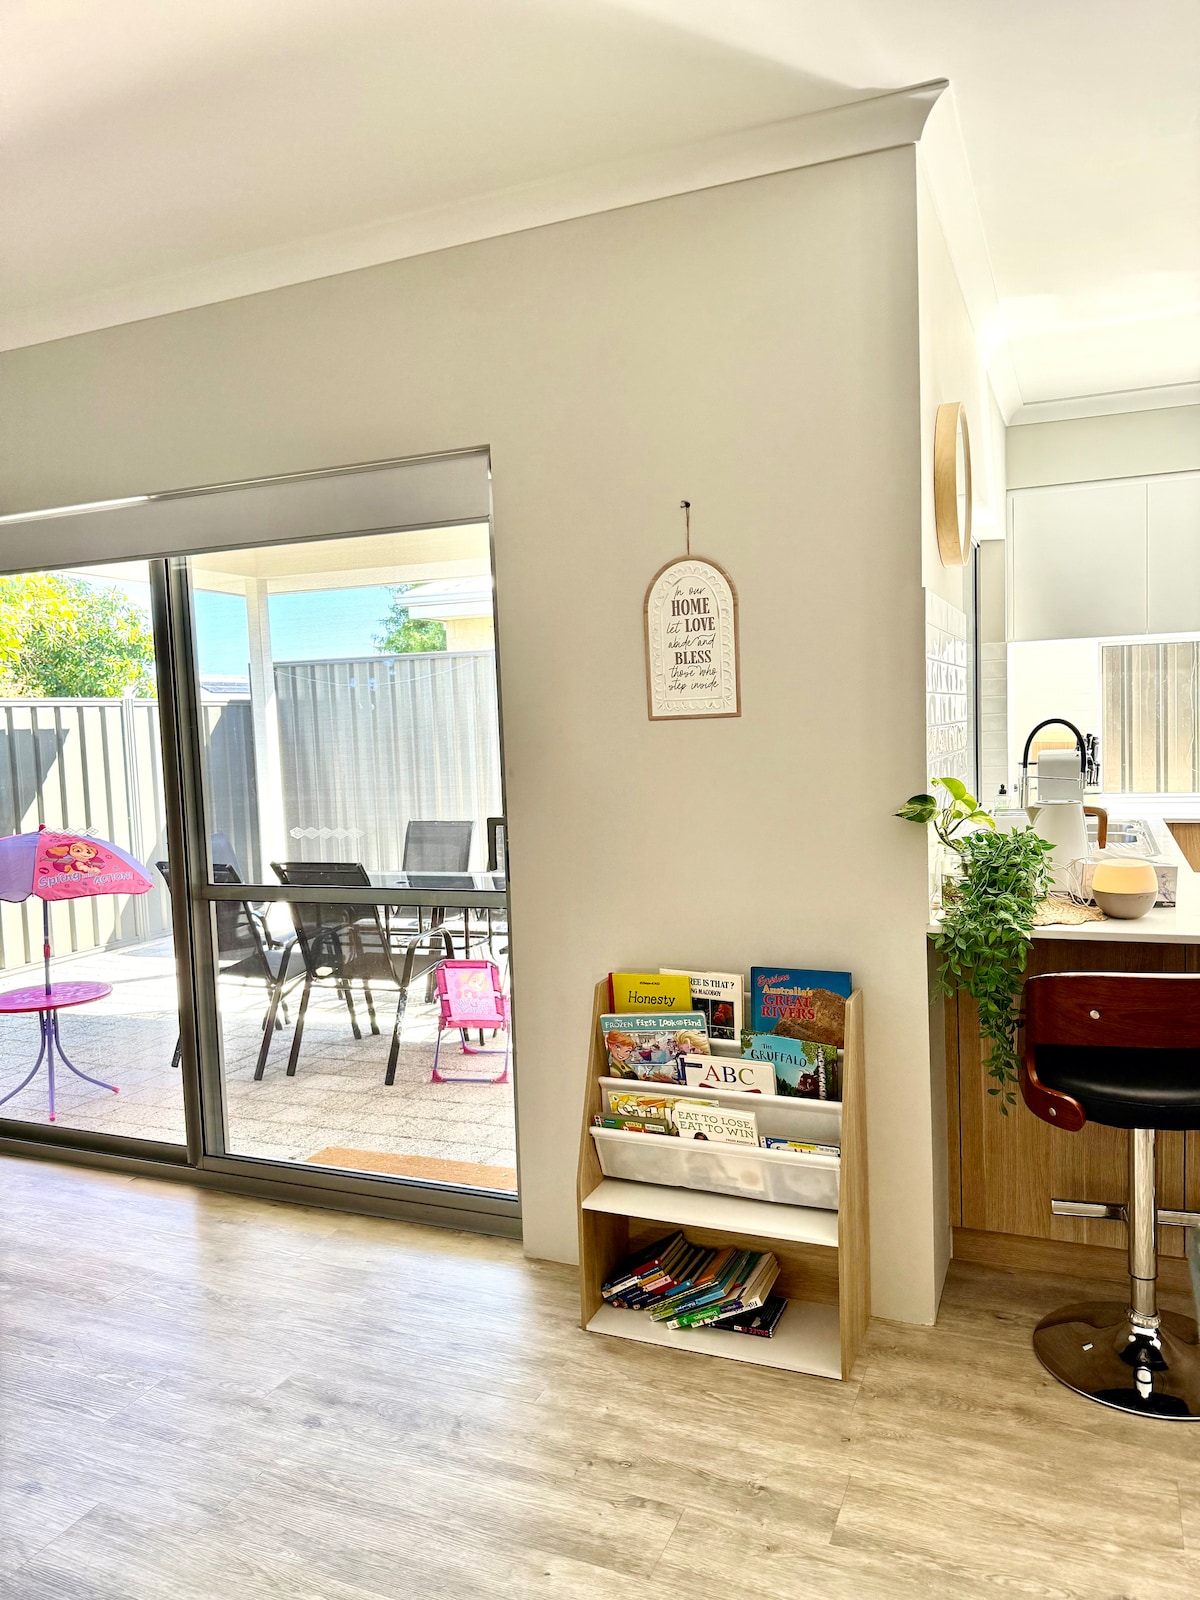
Featured Listings
Margaret River is a world-renowned destination famous for its elite wineries, spectacular surf breaks, and ancient limestone caves. It attracts a global crowd seeking a unique blend of adventure, gourmet experiences, and natural beauty. The Airbnb market is extraordinarily powerful here, featuring a high occupancy rate of 70%. Visitors seek luxury forest retreats, stylish rural cottages, and modern homes near the town center, driving an impressive annual revenue of A$88,583. Its global brand and consistent appeal to high-end travelers ensure it remains one of the most lucrative markets in Western Australia.
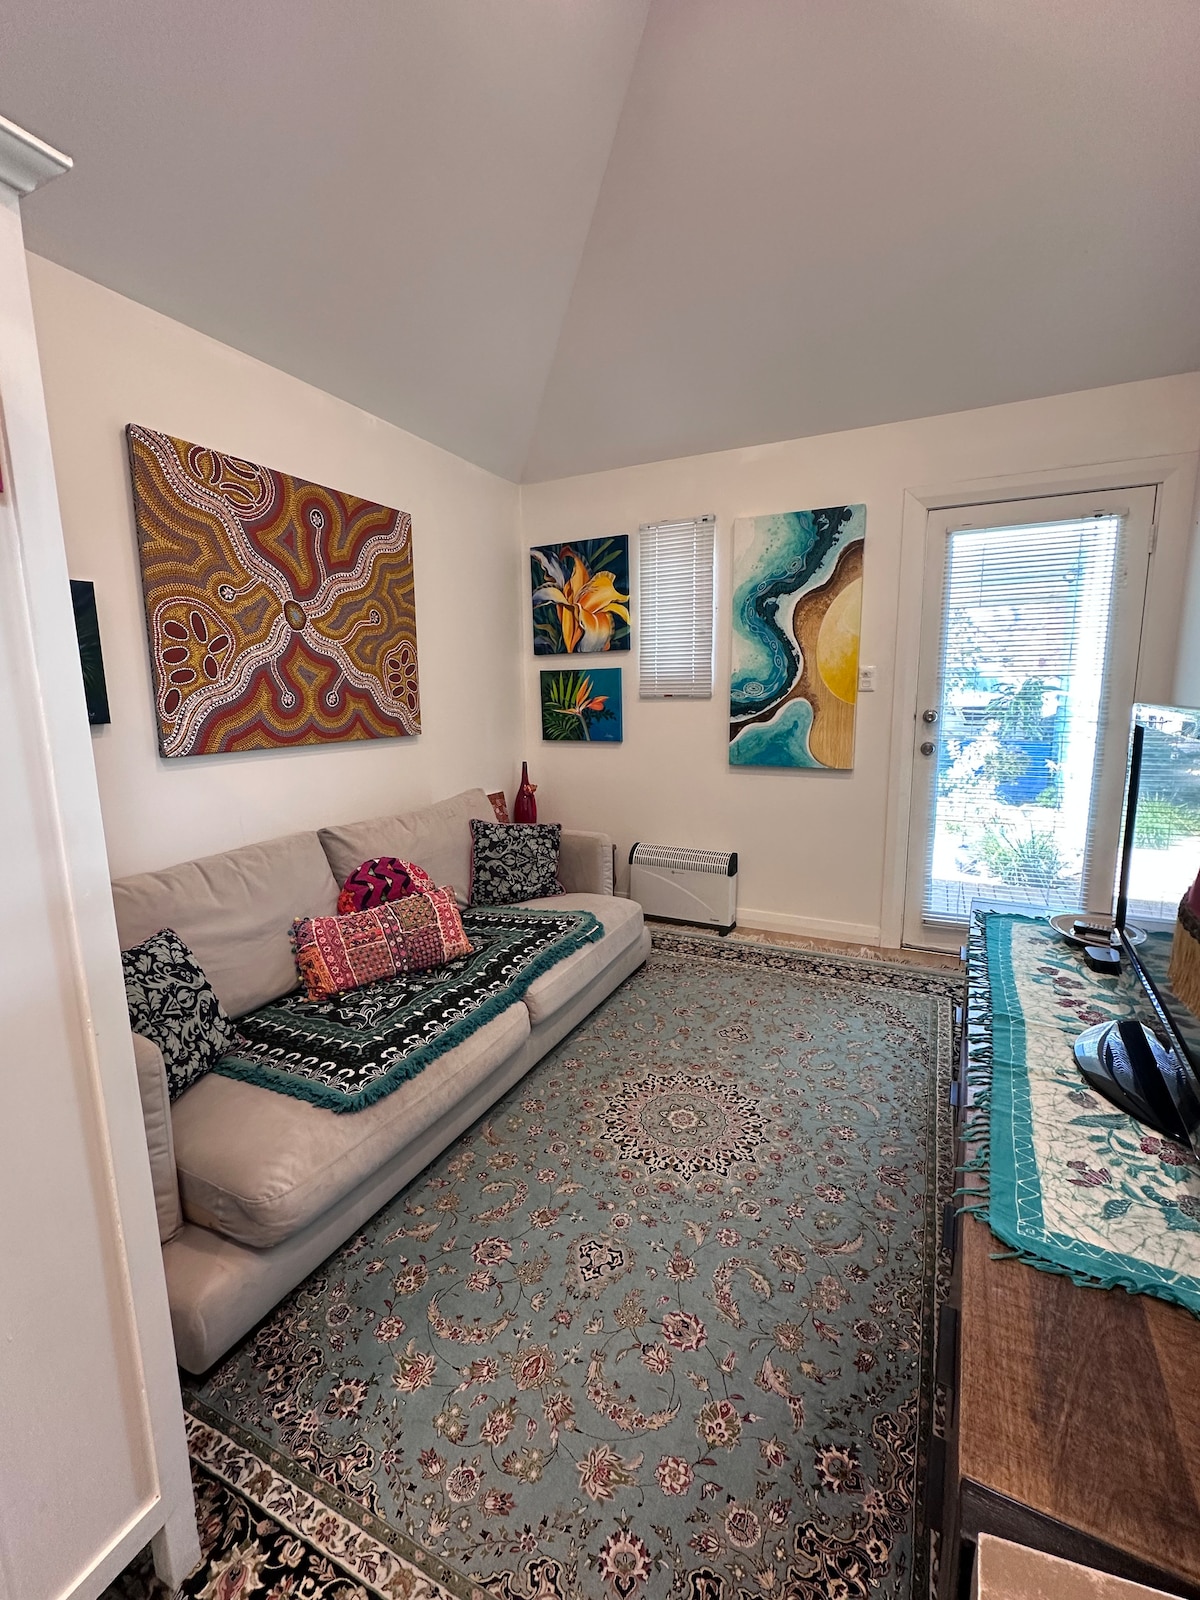
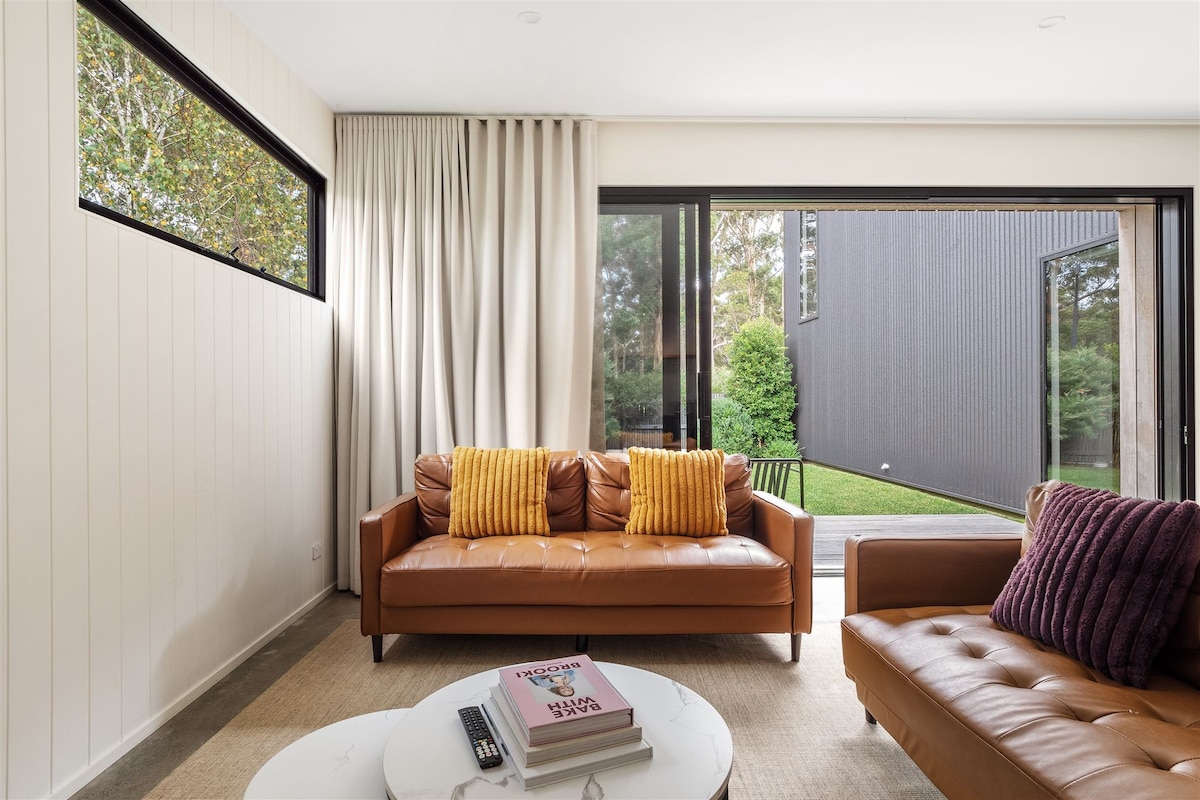
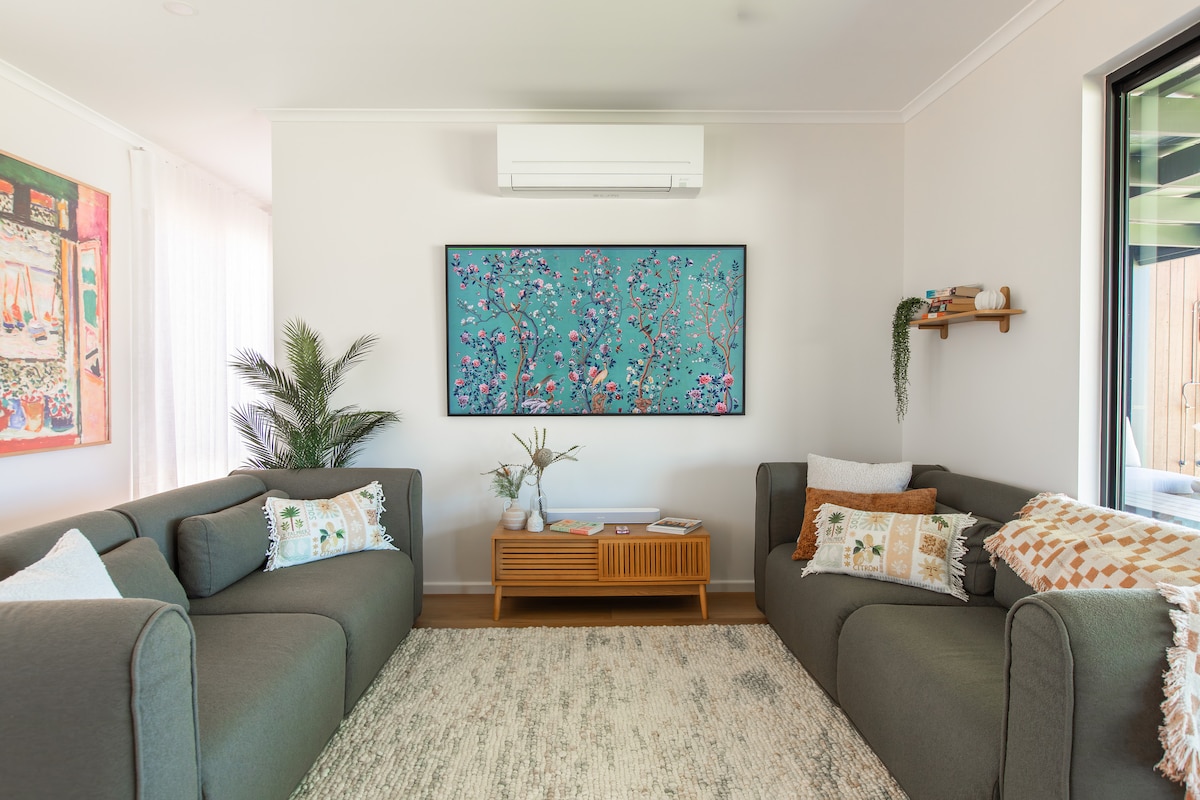
Featured Listings
Yallingup is where the forest meets the Indian Ocean, a stunning coastal destination world-famous for its powerful surf breaks and breathtaking sunsets. As a premier luxury getaway, it attracts high-end travelers seeking privacy and spectacular natural beauty. The short-term rental market is premium, featuring an average daily rate of A$500. Visitors seek architectural homes with expansive ocean views and exclusive rural estates, driving a significant annual revenue of A$101,319. Its unique combination of elite surfing and sophisticated serenity makes it a top-tier and highly yielded market for hosts.
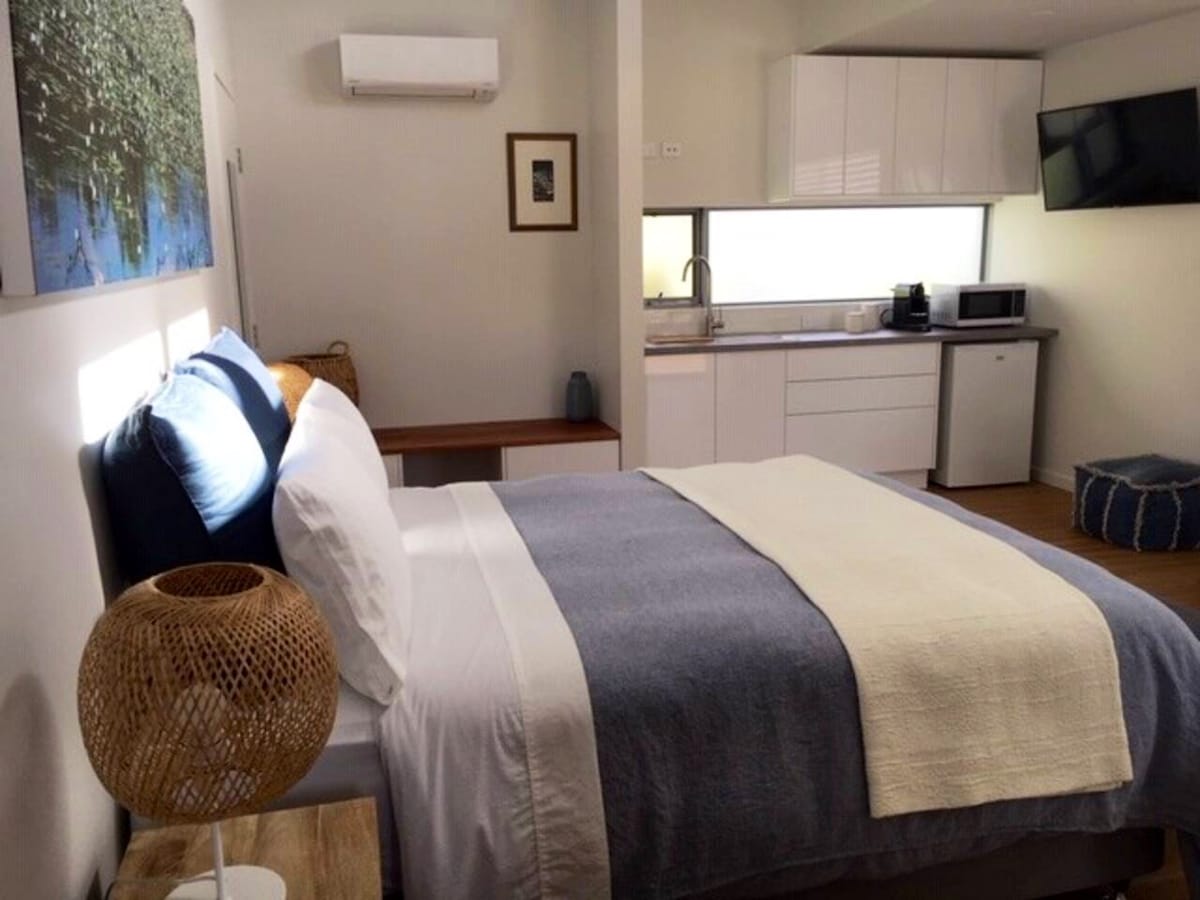
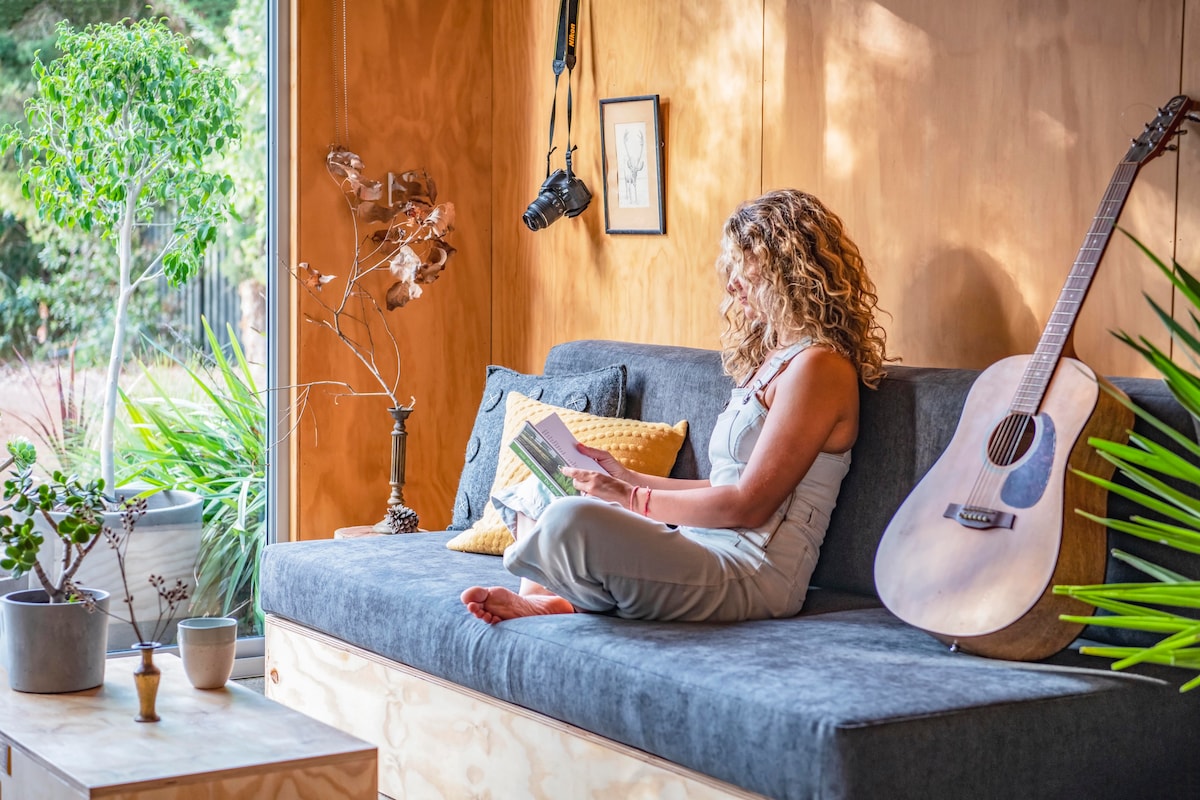
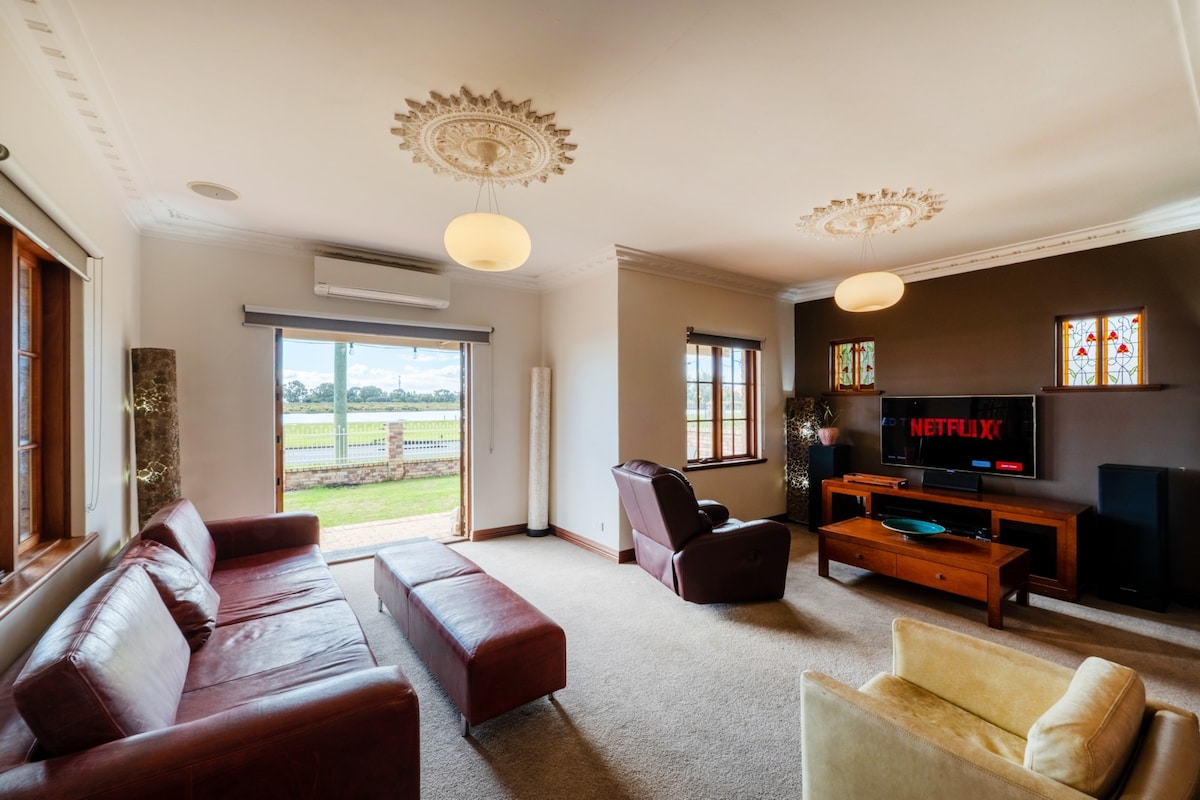
Featured Listings
Kalbarri is a stunning coastal destination where the Murchison River meets the Indian Ocean, famous for its dramatic red rock gorges and spectacular skywalk. It attracts nature lovers and adventure seekers drawn to the Kalbarri National Park and the incredible marine life. The vacation rental market is robust, with an occupancy rate of 54%. Travelers favor holiday homes with views and well-appointed apartments, resulting in an annual revenue per listing of A$51,870. Its unique landscapes and consistent popularity as a road-trip destination ensure steady demand and reliable rental performance.
Featured Listings
The City of Bunbury is a vibrant regional hub known as the ‘City of Three Waters’, offering a blend of coastal relaxation and urban energy. Famous for its resident dolphins at Koombana Bay and its thriving arts scene, it attracts a mix of business travelers and tourists. The Airbnb market is solid, featuring an occupancy rate of 62%. Visitors favor well-located city apartments and family homes near the waterfront, resulting in a steady annual revenue of A$56,561. Its role as a major administrative and service center for the South West ensures a stable and reliable rental market for hosts.
Featured Listings
Get Live Western Australia, Australia Market Intelligence
Discover detailed Western Australia, Australia Airbnb Analytics and explore real-time market data to make accurate investment decisions.
Explore Real-time Analytics