Best Airbnb Markets in Emilia Romagna, Italy
Success in the short-term rental market requires more than just a surface-level glance at the numbers. We’ve analyzed the top 10 markets in Emilia Romagna, Italy to help you identify high-performing towns and demand trends.
Please note that the data provided represents market-wide averages—a solid baseline, but only the beginning of a thorough analysis. For professional-grade insights, custom filtering, and property-specific performance metrics, use GuestFavorites to validate your next investment move.
Emilia Romagna Airbnb Market Map (June 2026)
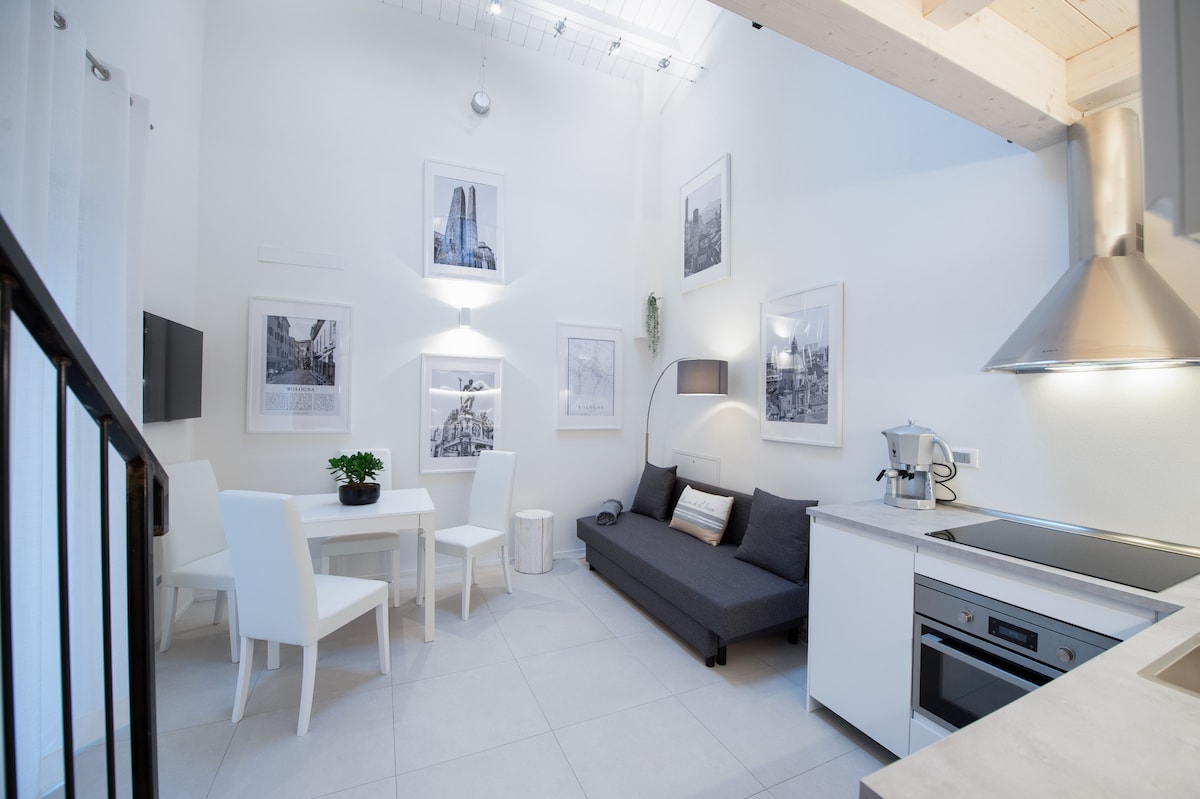
Bologna, known as ‘the Fat, the Learned, and the Red’, is a vibrant and cultured city famous for its UNESCO-listed porticoes, its millennial university, and world-renowned gastronomy. It is a premier economic and cultural hub attracting international tourism and a strong professional clientele year-round. The Airbnb market is very efficient here, featuring an occupancy rate of 66%. Visitors seek the charm of apartments in historic city-center palaces or the modernity of well-connected lofts, paying an average daily rate of €146. Its academic and economic energy ensures strong and consistent profitability for property owners.
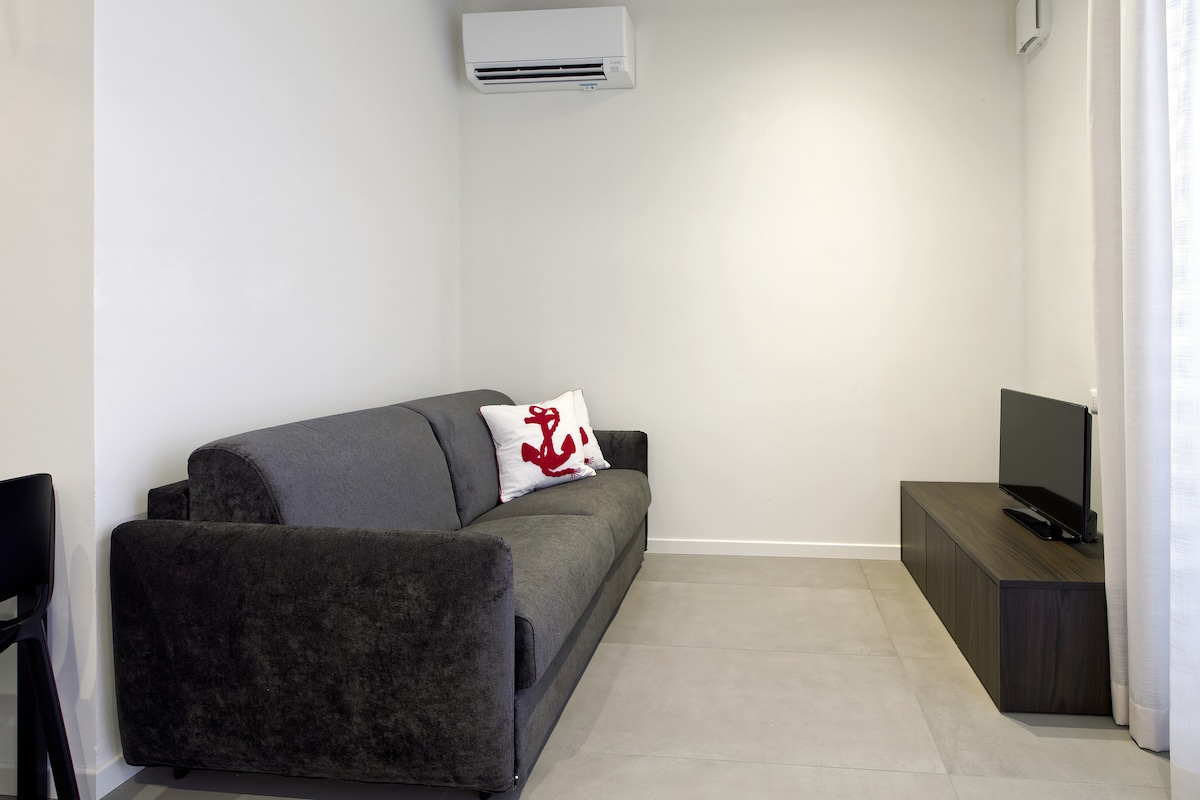
Featured Listings
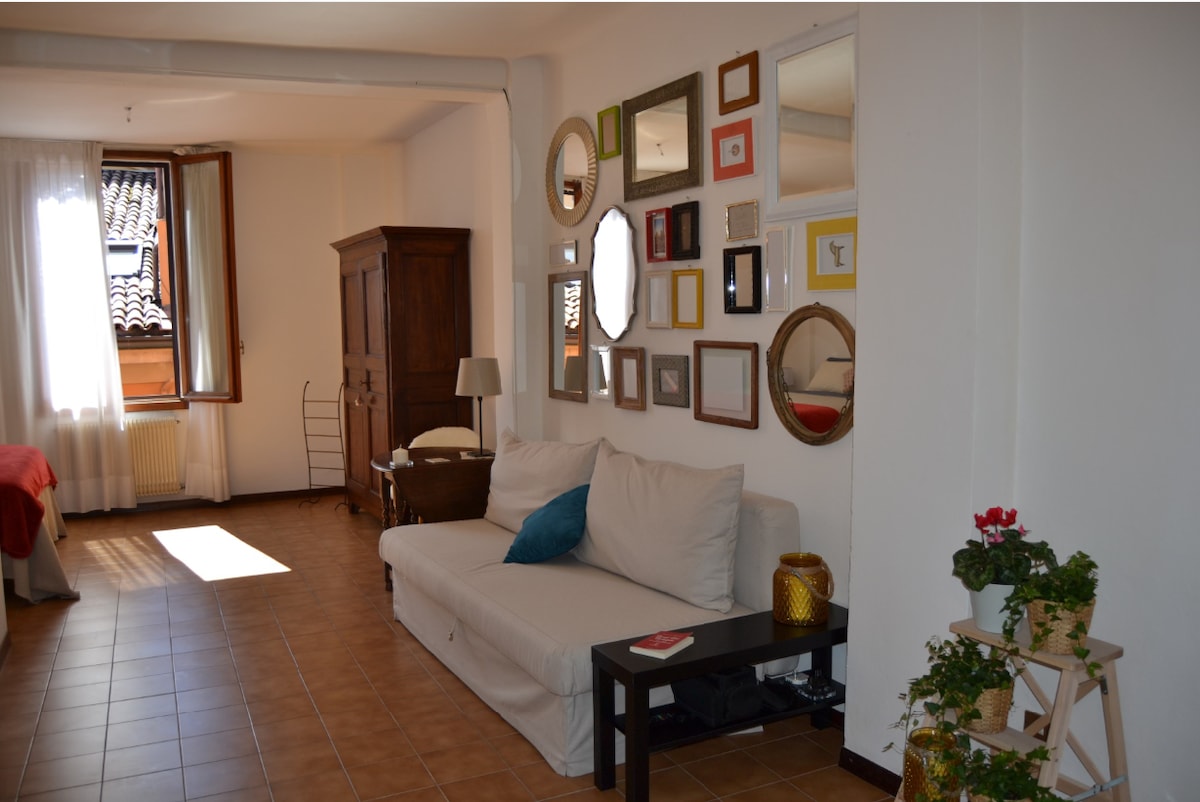
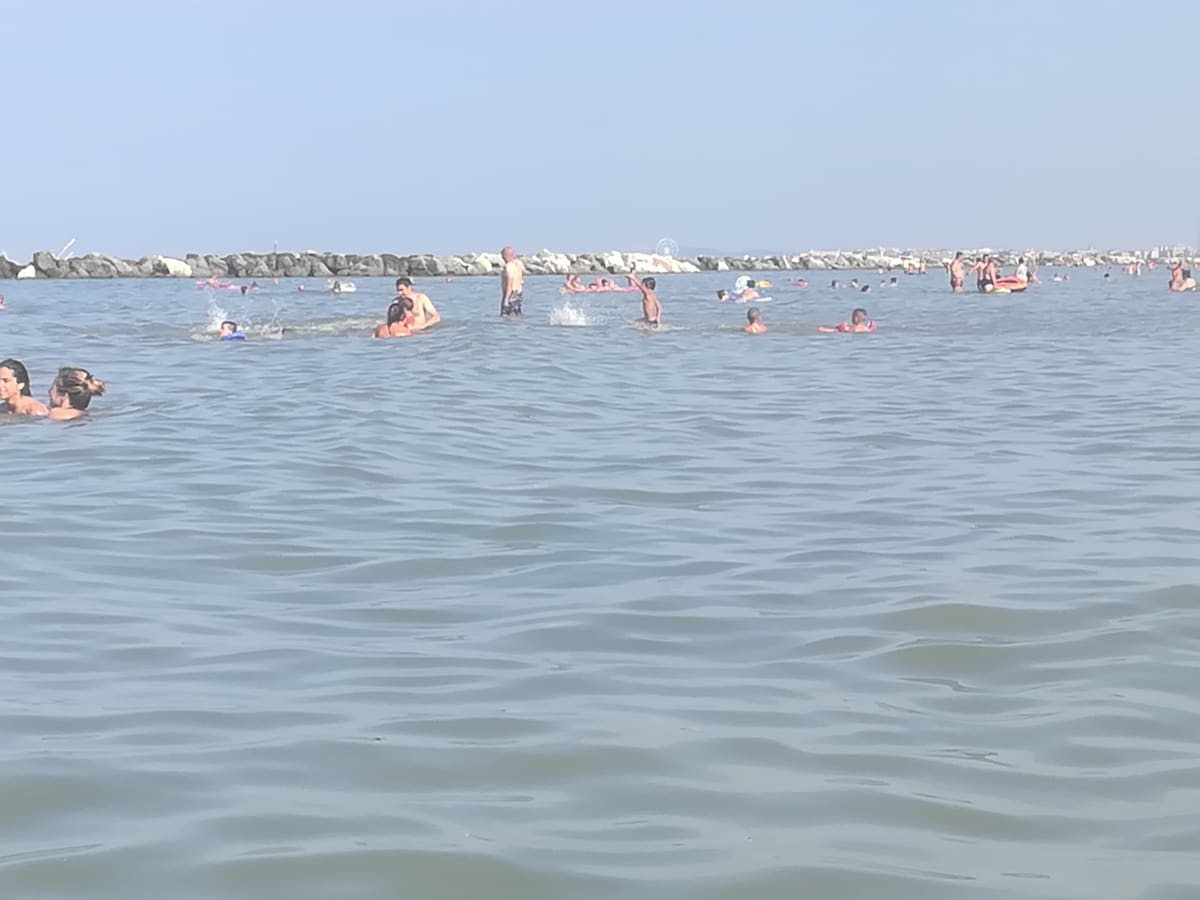
Rimini, the capital of Adriatic holidays famous for its vast beach, Roman historic center, and lively nightlife, is an Italian tourism icon. It is a massive market attracting millions of visitors from around the world thanks to its top-tier leisure, sports, and convention offerings. The Airbnb market is solid here, featuring an occupancy rate of 51%. Visitors appreciate modern apartments near the waterfront and centrally located rentals in the historic heart, paying an average daily rate of €132. Its prestige and constant renewal of tourism infrastructure ensure stable and consistent year-round profitability for property owners.
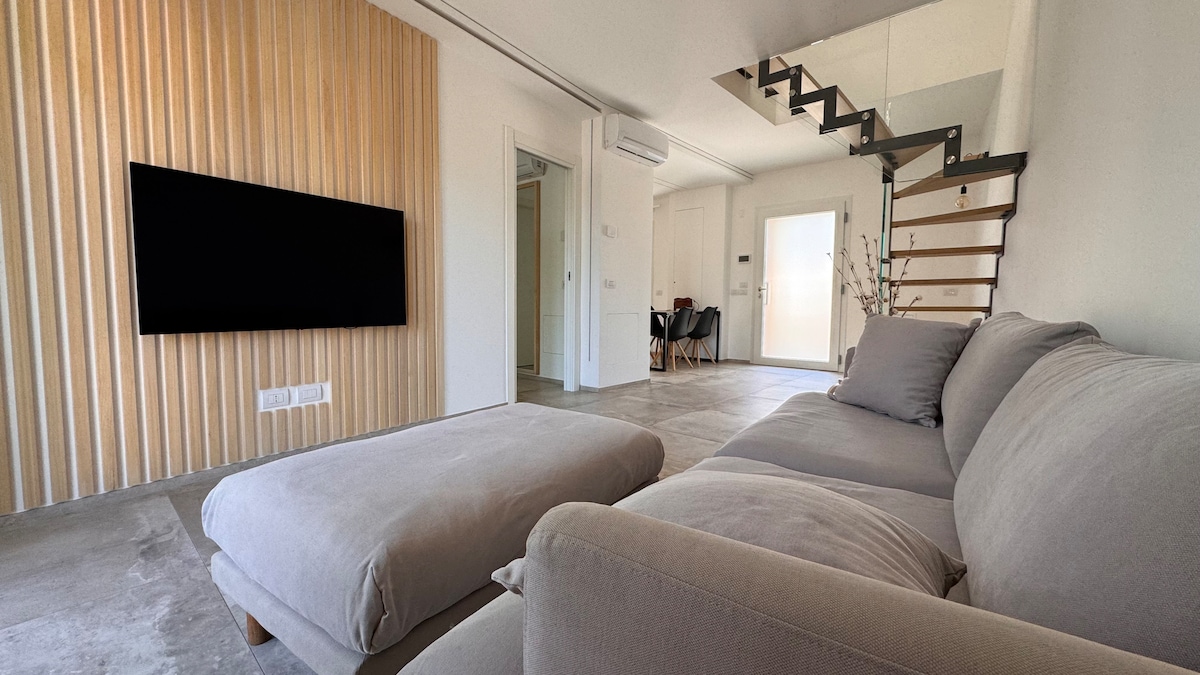
Featured Listings
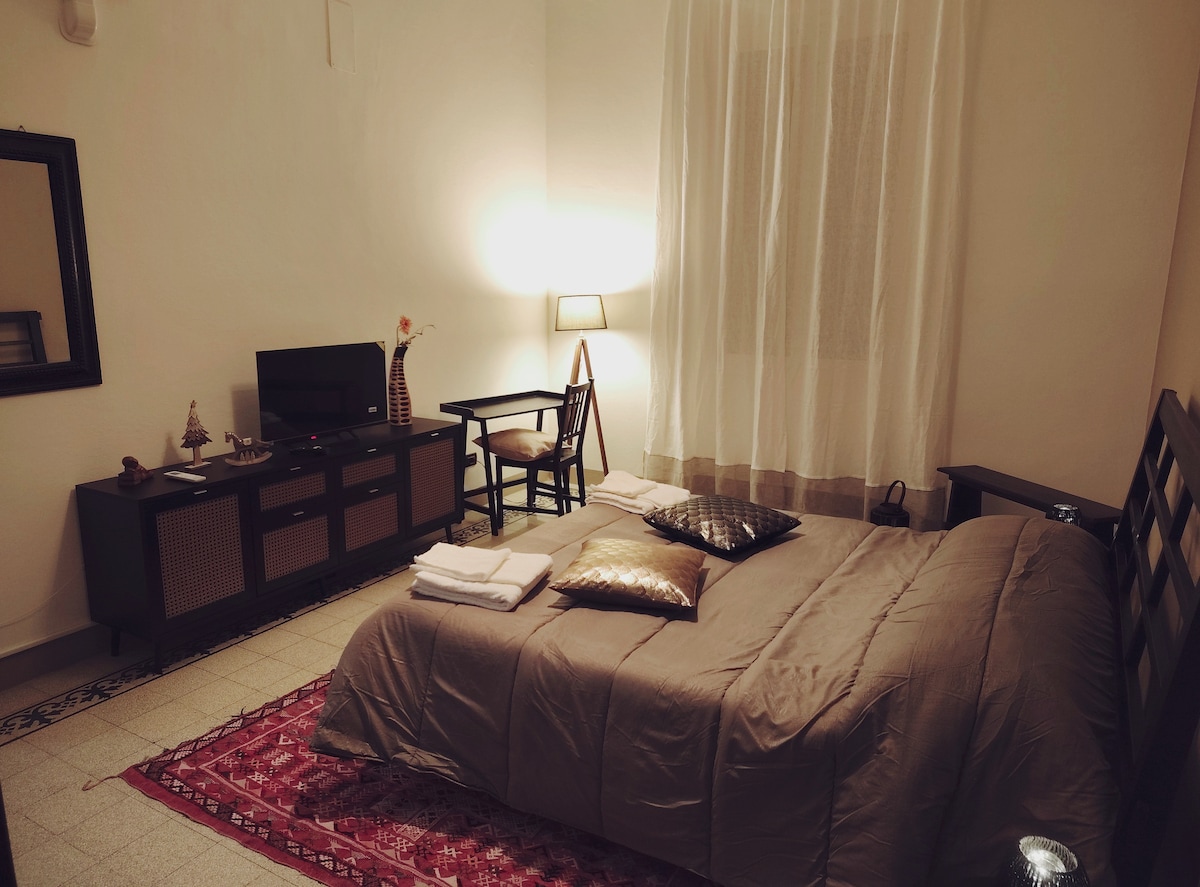
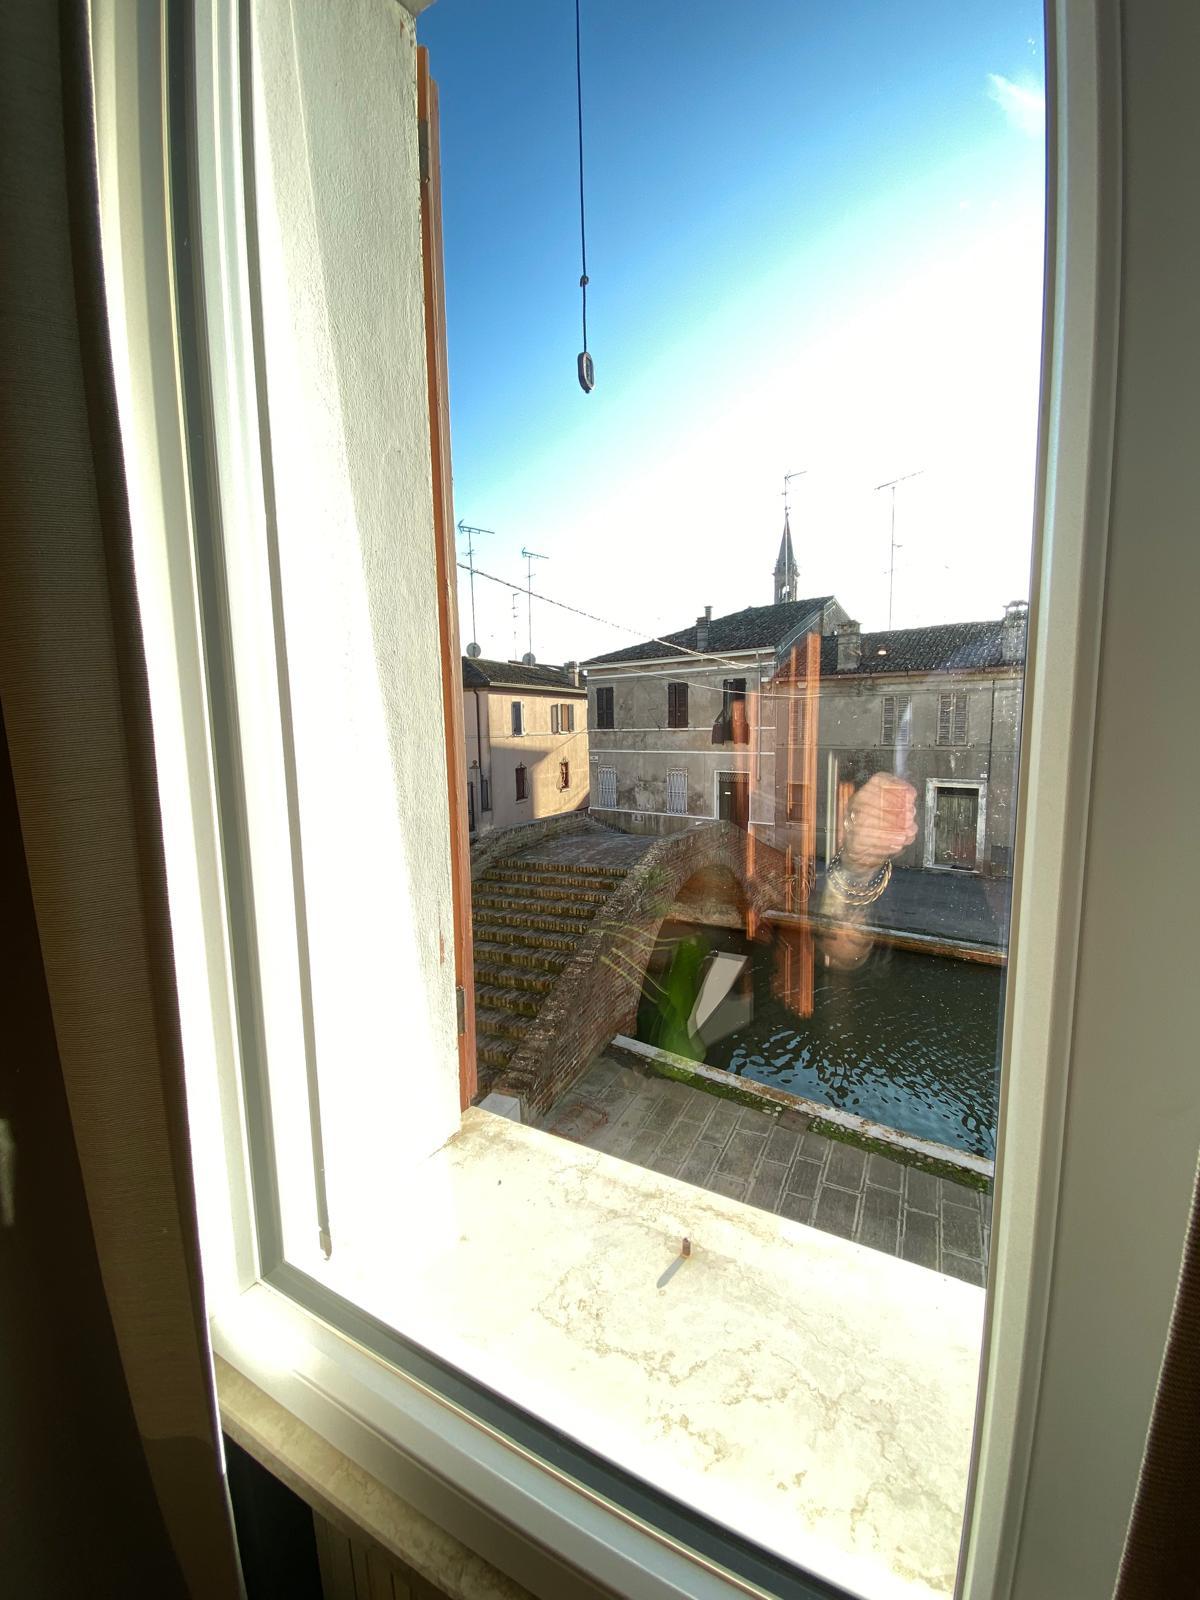
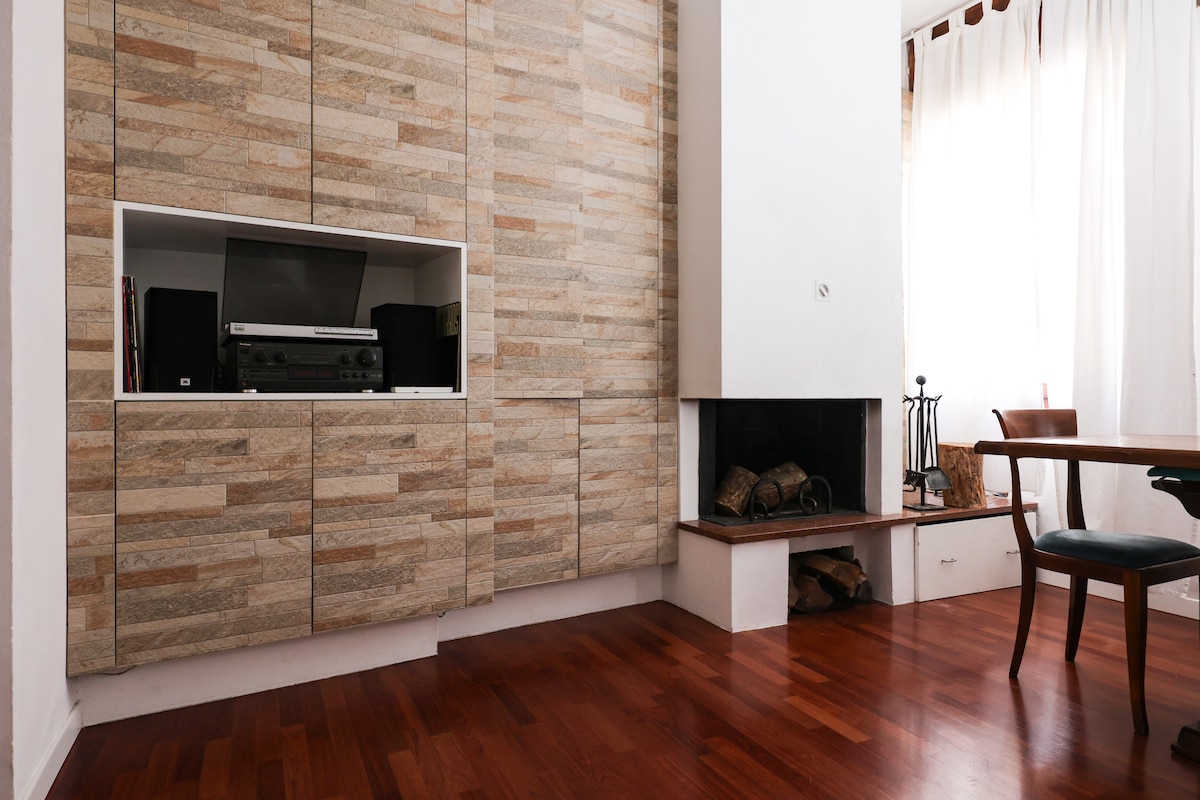
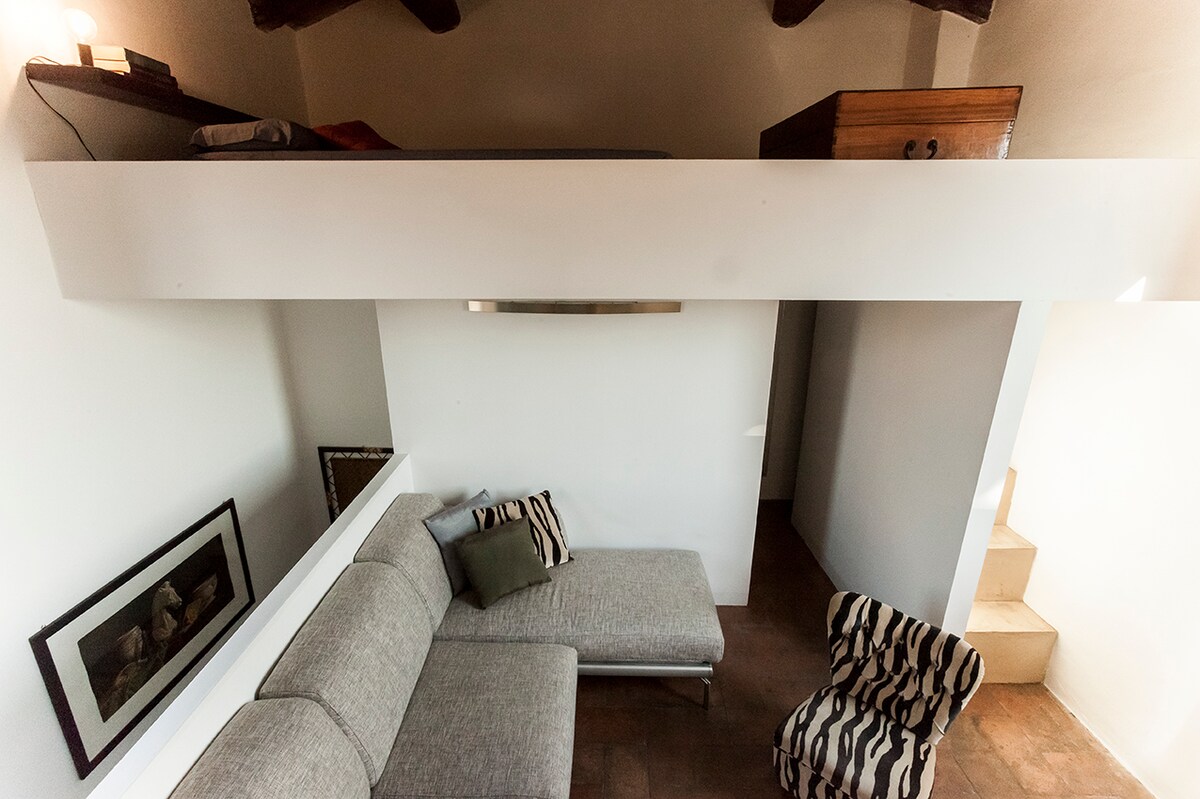
Comacchio, the ‘Little Venice’ of the Po Delta, enchants with its monumental bridges like Trepponti and its canals plying traditional boats. It is a destination of unique charm merging history, nature, and the wide beaches of the Comacchio Lidos, attracting birdwatchers and family seaside tourists. The rental market is very active here, featuring an average daily rate of €178. Visitors appreciate the character of historic city-center apartments and the modernity of holiday homes near the sea, generating an annual revenue of €34,561. Its authentic identity and the environmental richness of the Delta ensure steady demand and solid profitability.
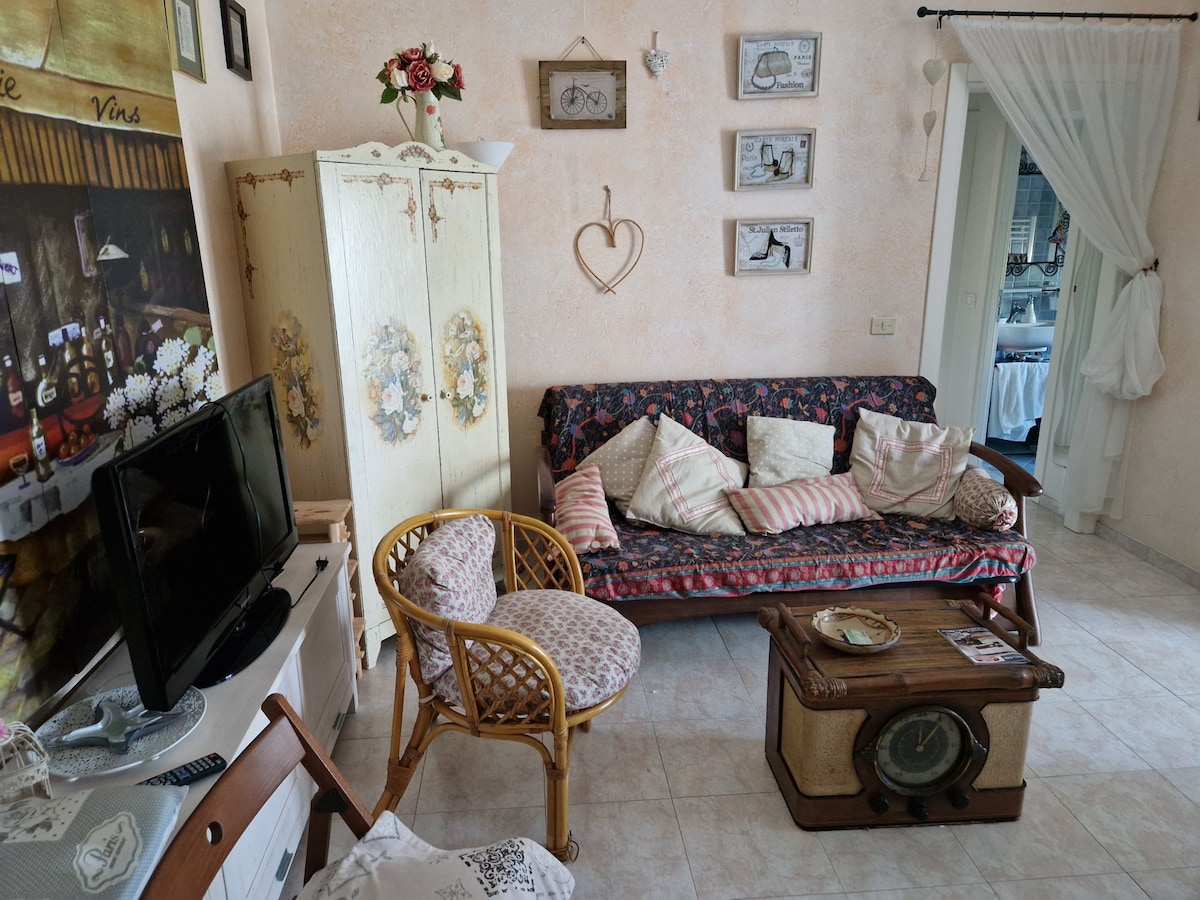
Featured Listings
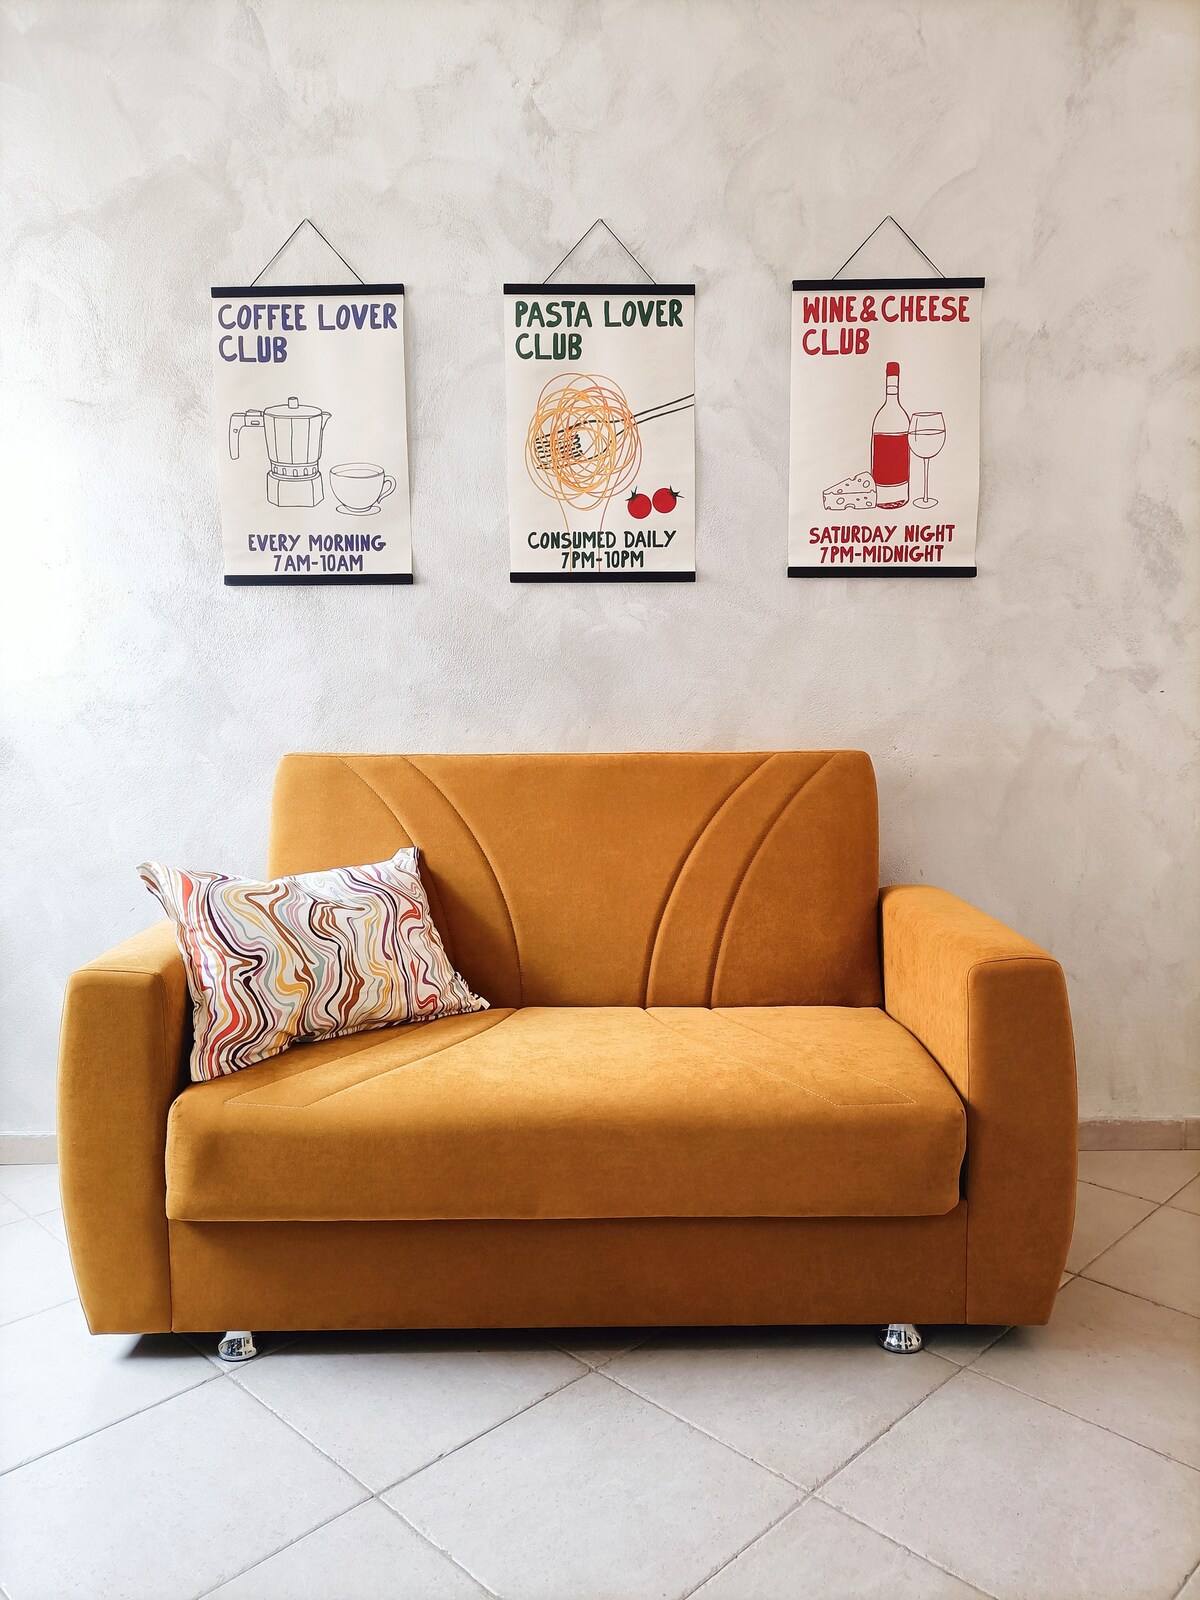
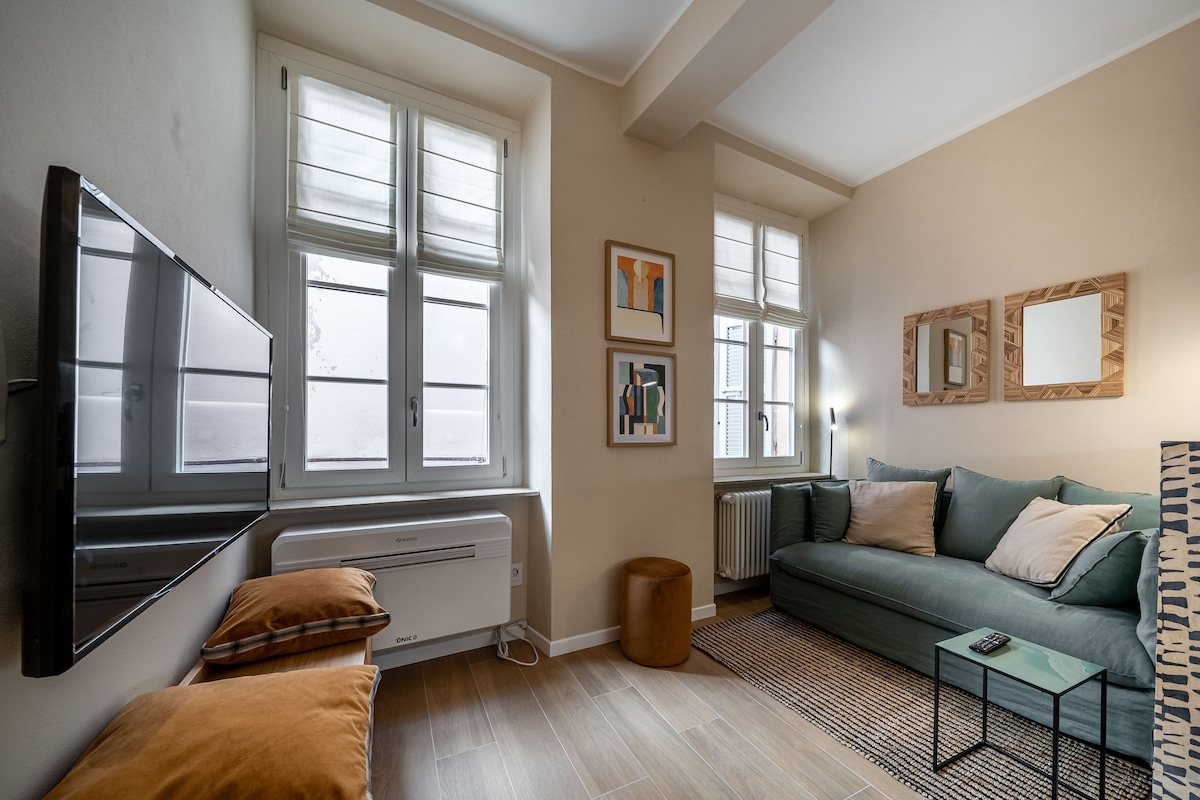
Modena, home to the Ghirlandina tower and the Land of Motors, is a gastronomic and industrial gem famous for Balsamic Vinegar, its UNESCO-listed Cathedral, and the Ferrari legend. It is a refined destination attracting international tourism seeking culinary excellence and cutting-edge automotive technology. The Airbnb market is very solid here, featuring an occupancy rate of 58%. Visitors seek the charm of apartments in historic city-center palaces and the convenience of rentals near industrial hubs, paying an average daily rate of €110. Its world-class prestige ensures steady demand and consistent profitability for owners.
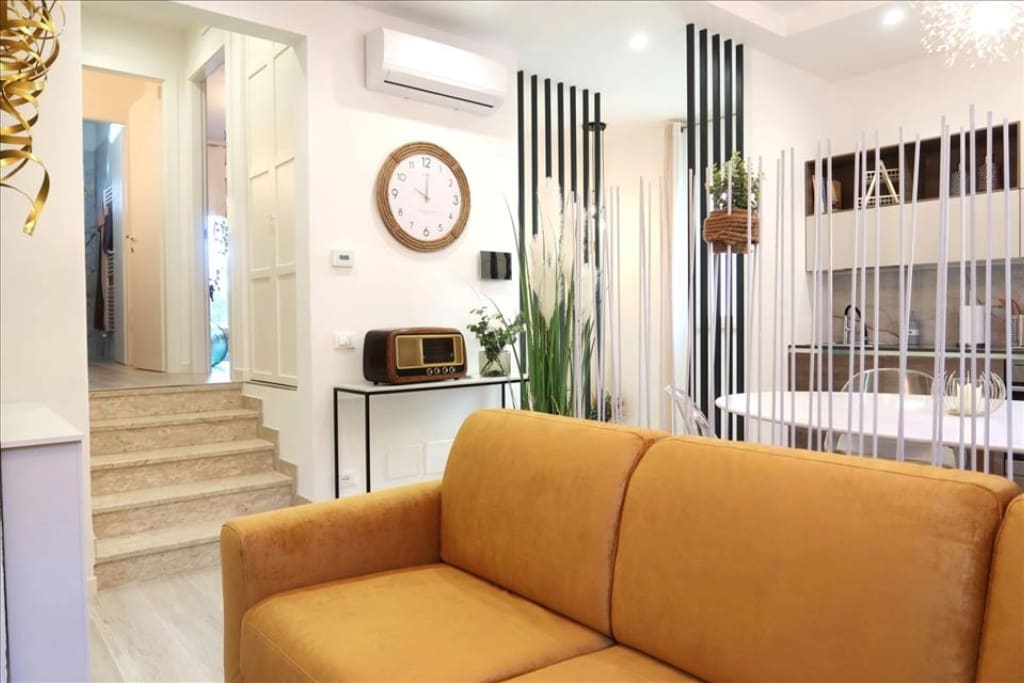
Featured Listings
![Top performing Airbnb: [Ghirlandina View] Rooftop Attic in Modena Center in Modena](https://a0.muscache.com/im/pictures/miso/Hosting-1380546676855230024/original/923f44de-acd3-4f8b-80be-9b73fb638224.jpeg)
Parma, a UNESCO Creative City of Gastronomy, is a jewel of elegance and taste famous for its Prosciutto, Parmigiano Reggiano, and the magnificent Teatro Regio. It is a destination attracting sophisticated international tourists and lovers of the ‘good life’ in a refined urban setting. The Airbnb market is very solid here, featuring an occupancy rate of 58%. Visitors appreciate the charm of historic city-center apartments and the convenience of rentals near university hubs, generating an annual revenue of €18,079. Its global reputation for food and music ensures steady demand and consistent profitability.
Featured Listings
Riccione, the ‘Green Pearl’ of the Adriatic, is an icon of trendy and sophisticated tourism, famous for its tree-lined avenues, luxury shopping on Viale Ceccarini, and lively nightlife. It is a dynamic market attracting young and family tourism from across Europe thanks to its excellent leisure and service offerings. The Airbnb market is solid here, featuring an average daily rate of €173. Visitors seek the charm of modern seaside apartments and the convenience of holiday homes in elegant residential neighborhoods, generating an annual revenue of €29,915. Its constant prestige and high-quality hospitality ensure stable profitability for owners throughout the summer.
Featured Listings
Cervia, the ‘City of Salt’, is a highly elegant seaside resort famous for its millennial pine forest, ancient salt marshes, and the trendy Milano Marittima area. It is a high-quality market attracting international tourism seeking wellness, sports, and refined entertainment. The Airbnb market is solid here, featuring an occupancy rate of 48%. Visitors seek the charm of apartments nestled in greenery and the exclusivity of residences near the waterfront, paying an average daily rate of €164. Its prestige and constant event calendar ensure steady demand and consistent profitability for owners throughout the summer season.
Featured Listings

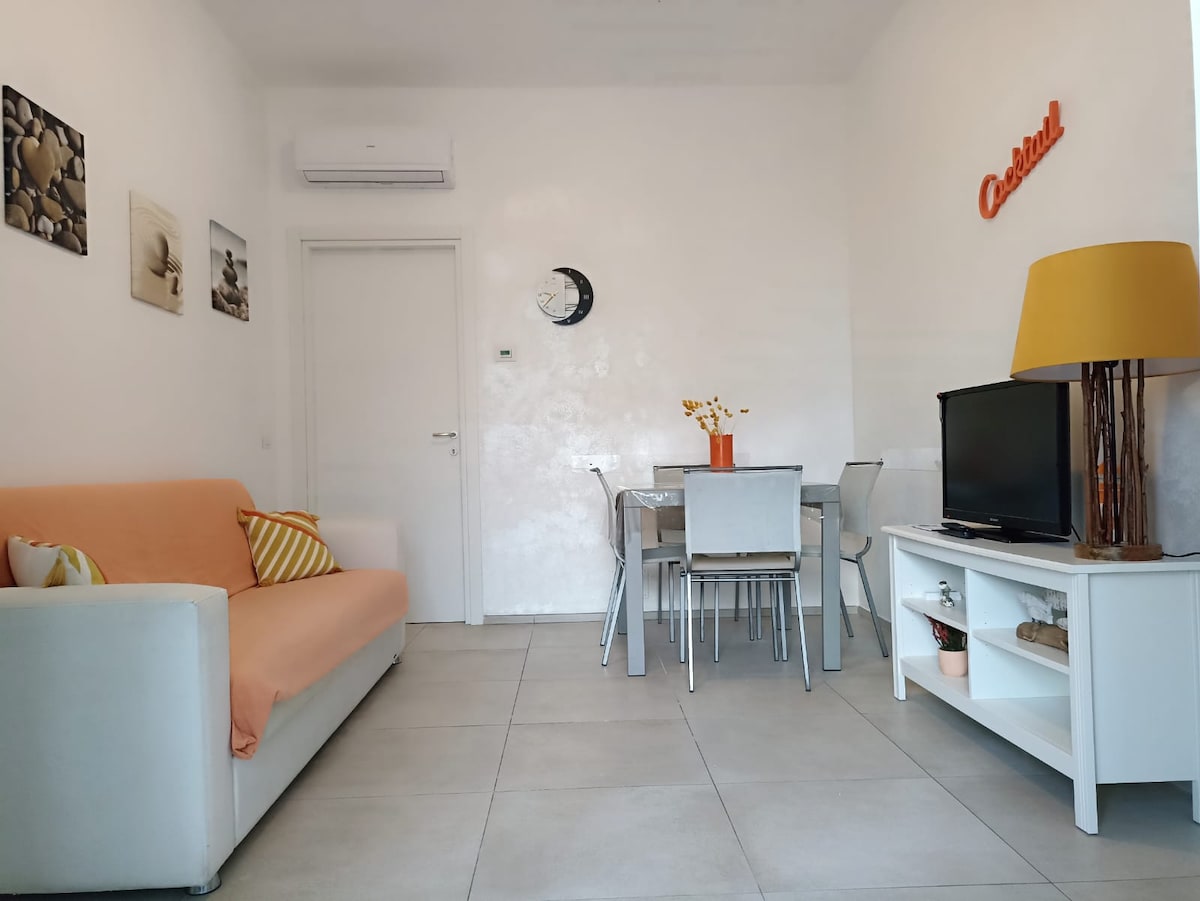
Bellaria Igea Marina is a welcoming and vibrant seaside destination, renowned for its fine sandy beaches, flowery parks, and the pedestrianized Isola dei Platani. It is an ideal market for family tourism seeking relaxation, quality services, and an authentic Romagna atmosphere. The Airbnb market is very active here, featuring an occupancy rate of 57%. Visitors appreciate modern apartments near the sea and holiday homes in quiet residential neighborhoods, generating an annual revenue of €25,175. Its legendary hospitality and safe beaches make it a stable and profitable destination for summer rental investment.
Featured Listings

Cesenatico, with its iconic Canal Harbor designed by Leonardo da Vinci and the colorful sails of the Maritime Museum boats, is one of Italy’s most evocative seaside towns. It is a destination of timeless charm merging seafaring tradition, sports (home of Marco Pantani), and excellent seaside holidays. The Airbnb market is solid here, featuring an occupancy rate of 49%. Visitors seek the charm of historic canal-front apartments and the convenience of holiday homes near the beach, paying an average daily rate of €126. Its image as a jewel of the Adriatic ensures steady demand and high profitability.
Cattolica, known as the ‘Queen of the Adriatic’ at the southern tip of the Romagna coast, enchants with its scenic squares, Aquarium, and manicured beach ideal for families. It is a refined destination offering a welcoming atmosphere and top-tier tourist services, attracting visitors from across Europe. The Airbnb market is active here, featuring an occupancy rate of 51%. Visitors appreciate modern apartments near the waterfront and holiday homes in central districts, paying an average daily rate of €128. Its tourism energy and beautiful urban setting ensure stable and consistent year-round profitability for owners throughout the summer season.
Featured Listings
Get Live Emilia Romagna, Italy Market Intelligence
Discover detailed Emilia Romagna, Italy Airbnb Analytics and explore real-time market data to make accurate investment decisions.
Explore Real-time Analytics