Airbnb Occupancy Rates in Rimini, Emilia Romagna(June 2026)
- Annual revenue:€24,980 per listing
- Occupancy:52%
- ADR:€132 per night
- Active listings:920 (as of June 2026)
Rimini is Italy’s Adriatic resort machine: beach-lid conventions, Sigep food-service weeks, Motor Show spillover, and summer family weeks on Marina Centro and Bellaria belts—not a miniature Venezia or Firenze art circuit.
Investors who import inland ADR logic onto seafront stock without bike paths, parking, and honest luglio–agosto seasonality often misprice winter softness and underestimate Emilia-Romagna ROSS1000 + CIN + Soggiorniamo tourist-tax flows.
Rimini Airbnb Market Map (June 2026)
Rimini Market Performance
Period: June 2025 - May 2026
Is Airbnb a Good Investment in Rimini?
YES — Rimini rewards operators who underwrite Adriatic resort seasonality and fair-calendar spikes with Emilia compliance discipline, not year-round corporate ADR like Milano.
Choose Rimini if you want 920 listings in a mature beach-and-convention market, can manage summer-heavy calendars, and will file CIR → CIN, Alloggiati Web, and imposta di soggiorno via Soggiorniamo before scaling.
Choose Bologna if you need university and Motor Valley demand with higher shoulder-season occupancy (€35,453, 67%, 3,359 listings)—less July compression, less salt air on fixtures.
Choose Ravenna if you prefer Byzantine heritage city breaks with a thinner pool (626 listings, €24,552) over pure lidos—compare regulation paths; both sit in Emilia-Romagna.
Choose Venezia or Firenze only if leisure ADR premiums justify monument logistics—not because Rimini “should” match their revenue (€48,538 / €43,466) on beach stock.
| City | Avg revenue | Occupancy | Listings |
|---|---|---|---|
| Rimini | €24,980 | 52% | 920 |
| Bologna | €35,453 | 67% | 3,359 |
| Venezia | €48,538 | 62% | 6,380 |
| Ravenna | €24,552 | 56% | 626 |
| Firenze | €43,466 | 65% | 9,654 |
Get Live Rimini Market Intelligence
Discover detailed Rimini Airbnb Analytics and explore real-time market data to make accurate investment decisions.
Explore Real-time Analytics
How Often Will Your Airbnb Be Booked in Rimini?
View Demand Patterns →Occupancy rates directly impact your revenue potential. Understanding demand patterns helps you set realistic expectations and optimize your availability strategy.
The current average occupancy rate in Rimini is 52%, meaning properties are booked for about 189 nights per year. However, occupancy varies significantly based on property quality and management. Here's what you can expect:
Airbnb Occupancy Tiers in Rimini
Premium(Top 10%) | High-performing(Top 25%) | Average(Median) | Low-performing(Bottom 25%) |
|---|---|---|---|
| 82% | 59% | 34% | 13% |
*High desirability & optimized availability | *Good market fit & guest satisfaction | *Standard market performance | *Higher vacancy, optimization needed |
Seasonal Occupancy Patterns in Rimini
June, July
Highest demand and occupancy rates. Perfect for premium pricing strategies and maximizing revenue. Consider longer minimum stays and higher rates.
November, January
Moderate demand with balanced pricing opportunities. Good for attracting budget-conscious travelers while maintaining reasonable occupancy rates.
December, February
Lower demand requires competitive pricing and creative marketing. Focus on local events, extended stay discounts, and targeting specific traveler segments.
How Much Can You Earn with Airbnb in Rimini?
Calculate Earnings →One of the most common questions for potential Airbnb hosts in Rimini is about earning potential. Let's break down the revenue patterns and what you can realistically expect to earn.
Monthly Revenue Trends in Rimini
Best-in-class Airbnb properties (top 10%) in Rimini achieve around €31,204 annually, while strong performers (top 25%) earn at least €20,082. Typical properties generate about €10,516 per year, and entry-level listings (bottom 25%) see earnings near €3,888, often with room for optimization. Keep in mind, these are market averages—your actual earnings can be even higher depending on your property's location, bedrooms, guest capacity, and unique amenities.
Want to see how your listing could perform? Create a free account to unlock personalized analytics and explore exclusive insights in our app!
What Can You Learn from Top-Performing Airbnbs in Rimini?
View Top Performers →Studying successful properties provides valuable insights for your own Airbnb strategy. Here are the top-performing listings in Rimini and what makes them successful.
Rimini Market Analysis
What to buy on the Adriatic strip
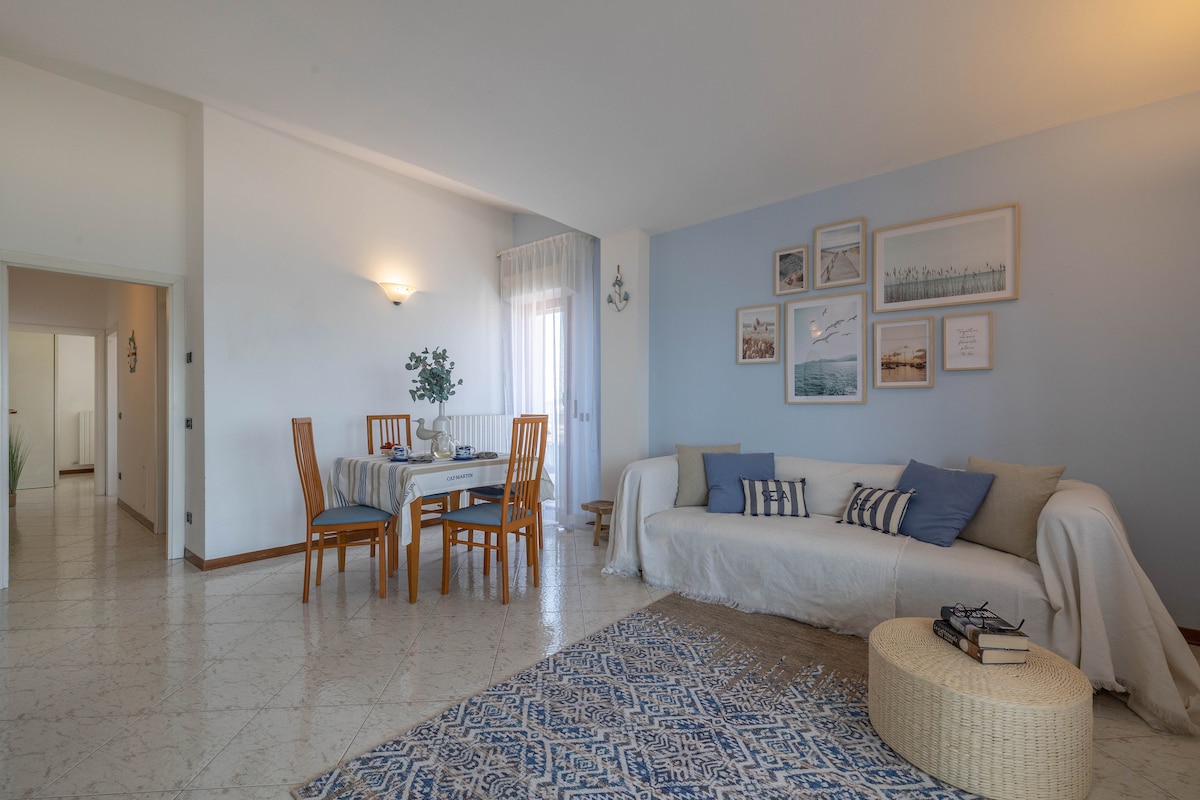
- Marina Centro / Trieste–Bellaria front-row flats with elevator, AC, and beach-kit storage—families pay for walk-to-sand, not only centro nightlife.
- Two-bedroom units near Palacongressi and fair corridors when you target Sigep, TTG, and congress weeks—price minimum stays around event calendars.
- Bike-friendly stock on lungomare routes; Rimini guests expect piadina walks and rental-bike logistics disclosed honestly.
- Parking or garage within 300 m when marketing Motor Valley or San Marino day trips—ZTL and summer traffic punish vague listings.
What to avoid
- Top-floor walk-ups without AC marketed as “sea breeze"—August heat and humidity erode reviews.
- Deep inland suburbs with no beach or fair story—occupancy tracks luglio–agosto, not year-round city breaks.
- Trophy attics far from lidos when your comp set is Bellaria–Cesenatico beach stock with pools.
- Scaling past non-imprenditorial unit caps without switching to the correct imprenditoriale / locazione breve path and L.R. 10/2025 urban checks.
What Are the Airbnb Regulations in Rimini?
Understanding local regulations is crucial for operating a successful Airbnb. Let's examine the compliance landscape and what you need to know about licensing requirements in Rimini.
Current Regulatory Status
75% compliance indicates strict regulatory enforcement in this market.
- Classify appartamento ammobiliato uso turistico (non-imprenditorial) vs locazione breve imprenditoriale—SUAP and unit caps differ.
- File opening communications via regional Accesso Unitario when the Comune requires them (appartamenti uso turistico / CIR).
- Register CIR in ROSS1000 and obtain CIN on BDSR; display CIN on every ad and at the entrance.
- Log guests on Alloggiati Web within 24 hours.
- Collect and remit imposta di soggiorno via municipal Soggiorniamo / IDS (pagare imposta di soggiorno).
- Confirm condominium rules, safety hardware tied to CIN, and cedolare secca thresholds (Agenzia delle Entrate — locazioni brevi).
- Verify L.R. 10/2025 planning constraints before marketing seafront stock.
Comune di Rimini
Rimini publishes furnished tourist-apartment rules on appartamenti uso turistico e CIR and coordinates tourist tax through Soggiorniamo / entrateonline. Regional statistics and CIR workflows align with Emilia-Romagna turismo.
National and regional rules
Italy caps each contract at 30 days per stay. CIN is mandatory under national law (Ministry BDSR FAQ). Emilia-Romagna governs extralberghiero under L.R. 16/2004 and locazione breve planning under L.R. 10/2025.
How Competitive is the Airbnb Market in Rimini?
Analyze Competition →Understanding market competition is crucial for any potential Airbnb host. Let's examine the supply dynamics and what they mean for your investment strategy. The Rimini Airbnb market currently features 920 active listings with an average occupancy rate of 52%. This represents a moderately competitive market environment where balanced supply and demand create opportunities for strategic positioning.
Airbnb Listings: Change Over Time
Strategic Entry into Rimini Airbnb Market
Competitive Positioning
- Focus on mid-market with competitive pricing
- Balance quality and competitive pricing
- Target mid-range market segment
Market Opportunities
- Strong demand supports premium pricing strategies
- Stable market provides predictable investment returns
- Established market with proven demand patterns
What Should You Charge for Your Airbnb in Rimini?
Smart Pricing Tools →Pricing is one of the most critical decisions for Airbnb success. Let's analyze the current pricing landscape and help you understand what rates you can realistically charge.
The current average daily rate in Rimini is €132 per night. However, pricing varies significantly based on property quality and location. Here's what different property tiers typically charge:
Airbnb Pricing Tiers in Rimini
Premium(Top 10%) | High-performing(Top 25%) | Average(Median) | Budget(Bottom 25%) |
|---|---|---|---|
| €176per night | €125per night | €88per night | €33per night |
*Top locations, big properties, premium amenities | *Good property management, highly rated | *Standard market performance | *Basic properties, less desirable locations |
Is It Profitable to Start an Airbnb in Rimini?
Investment Analysis →Understanding the profitability potential is crucial for any Airbnb investment decision. Let's analyze the revenue performance and profit margins in the Rimini market to help you make informed financial decisions.