Airbnb Market Data in New South Wales, Australia(July 2026)Occupancy, Revenue & Best Areas
Harbour views, northern beaches, and Blue Mountains weekender cabins all sit under the New South Wales banner — but guests search Sydney, the Central Coast, and Newcastle as separate markets long before they open a state-wide page.
As of July 2026, NSW averages A$76,220 in annual revenue per listing with 55% occupancy and A$379 ADR across 41,873 active listings. Sydney’s event calendar and coastal school holidays pull those averages in different directions.
Model the city or council area first, then compare against the NSW baseline.
New South Wales Airbnb Market Map (July 2026)
New South Wales Market Performance
Period: July 2025 - June 2026
How Much Can You Earn with Airbnb in New South Wales?
One of the most common questions for potential Airbnb hosts in New South Wales is about earning potential. Let's break down the revenue patterns and what you can realistically expect to earn.
Monthly Revenue Trends in New South Wales
Is Airbnb a Good Investment in New South Wales?
YES — New South Wales remains Australia’s largest short-stay inventory pool for hosts who can navigate strata bylaws in Sydney and still compete on the coast.
Works best if:
- You underwrite Sydney or a beach suburb like Manly with body-corporate clearance and realistic event-week ADR assumptions.
- You target family drive markets on the Central Coast or Newcastle with parking and outdoor space.
- You accept higher acquisition costs than Queensland in exchange for harbour and global-city branding.
| City | Avg revenue | Occupancy | ADR |
|---|---|---|---|
| New South Wales | A$76,220 | 55% | A$379 |
| Sydney | A$106,786 | 74% | A$394 |
| Victoria | A$58,518 | 53% | A$304 |
| Queensland | A$82,345 | 65% | A$349 |
Headwinds: NSW short-stay registration, day caps in some councils, and apartment bylaws that ban letting in popular towers.
New South Wales Market Analysis
Business & event travellers
Sydney fills on Vivid, Mardi Gras, tennis, and corporate mid-weeks when guests want walkable dining and quick access to the harbour. One-bedroom apartments near transport outperform large suburban houses unless you market for families explicitly. Event-week nightly rates can double baseline ADR, but strata bylaws in popular towers still block holiday letting in buildings where owner-occupiers dominate.
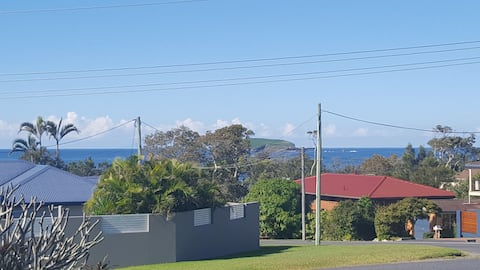
Beach & family weekends
Manly, Bondi Beach, and Central Coast towns like The Entrance trade on school holidays and short city escapes. Parking and outdoor space decide reviews more than interior styling because guests arrive with surfboards, prams, and multi-car families. Detached houses with a backyard and secure parking often sustain higher occupancy than designer apartments that photograph well but lack shade and storage.
Regional city spillover
Newcastle, Byron Bay, and Hunter wine towns like Pokolbin capture Sydney-priced-out guests, wedding weekends, and road-trip traffic. Average nightly rates are usually lower than inner Sydney, but detached stock faces fewer body-corporate fights and can carry stronger winter occupancy when marketed for work-from-coast mid-stays.
Most Profitable Areas in New South Wales
NSW short-stay demand sits in Sydney, northern and southern beaches, wine country, and a handful of regional gateways — not evenly across every shire. The towns below combine strong listing counts with revenue that scales through peak holiday weeks.
Top performing towns & cities
Byron Bay:830 listings at A$138,429 and 58% occupancy — international surf culture and festival weekends.
Sydney:493 listings earning A$106,786 — global-city events, corporate travel, and harbour tourism.
Bondi Beach:427 listings at A$111,879 with 71% occupancy — iconic beach demand with tight apartment supply.
Manly:425 listings at A$102,269 — ferry-linked northern beaches premium and family surf weekends.
Pokolbin:402 listings earning A$106,270 — Hunter Valley wine weekends and wedding groups.
Kingscliff:398 listings at A$98,319 — Tweed Coast family beaches south of the Gold Coast border.
Nelson Bay:531 listings at A$68,765 — Port Stephens dolphin tours and boating holidays.
Jindabyne:628 listings at A$86,612 — Snowy Mountains ski base with summer lake demand.
Yamba:484 listings earning A$73,894 — Clarence Valley surf and fishing road trips.
Vincentia:429 listings at A$74,374 — Jervis Bay beach houses and whale-watching season.
Wine & hinterland escapes
Pokolbin and the broader Hunter Valley draw hen weekends, wedding parties, and couples who want vineyard dining without a long drive from Sydney. Stock is mostly detached houses with pools and entertaining decks rather than city apartments. Revenue peaks around autumn harvest events and spring wedding season, so plan for higher cleaning turnover and minimum-stay rules that match group bookings.
Snowy Mountains & northern rivers
Jindabyne books ski weeks in winter and lake fishing or cycling groups in summer when Snowy Hydro views still sell. Coastal towns like Yamba and Kingscliff trade on school holidays with lower acquisition costs than Bondi but thinner weekday corporate demand. Heating, linen for cold arrivals, and honest drive-time notes matter as much as interior photos in both markets.
Top 10 Airbnb Markets in New South Wales
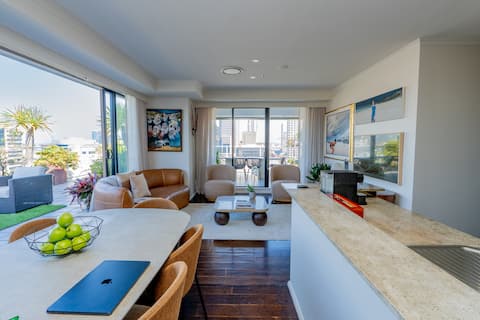
Sydney is Australia’s global icon, world-famous for its stunning harbor, the Opera House, and incredible city beaches like Bondi. As a premier international destination, it attracts a massive and diverse mix of business and leisure travelers throughout the year. The Airbnb market is incredibly vast, with over 11,798 listings and a strong occupancy rate of 67%. Visitors seek everything from luxury urban apartments in the CBD to character homes in trendy eastern suburbs, providing hosts with a substantial annual revenue of A$82,205. Its status as a world city ensures constant demand and a highly dynamic environment for short-term rentals.
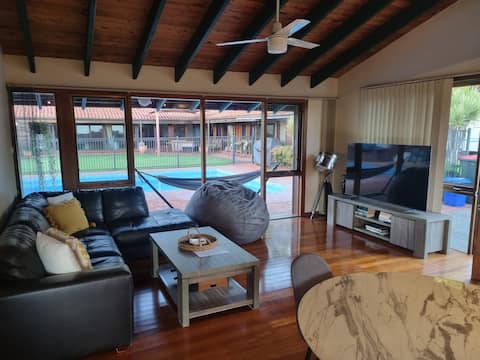
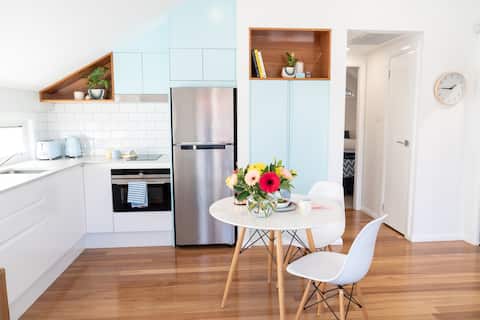
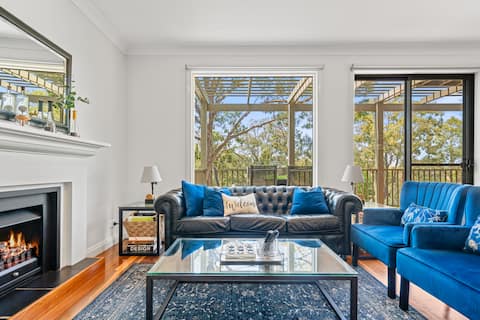
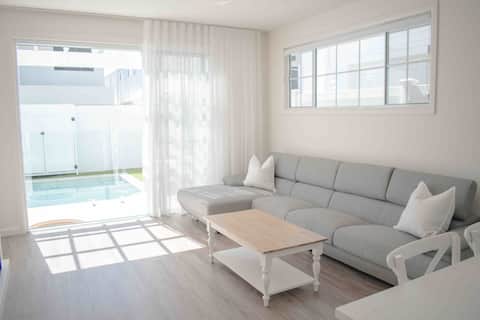
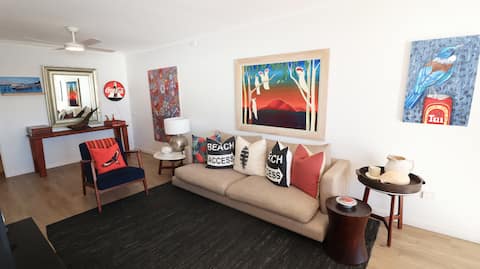
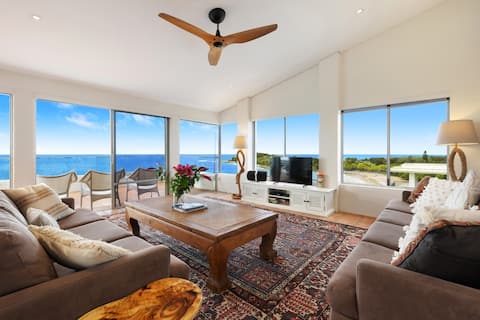
Featured Listings
Byron Bay is an international icon, famous for its world-class surfing, bohemian spirit, and stunning natural beauty at Australia’s easternmost point. As a premium lifestyle destination, it attracts a diverse mix of celebrities, backpackers, and families. The vacation rental market is one of the most lucrative in the country, featuring an average daily rate of A$649. Visitors seek everything from luxury architectural estates to quirky beach shacks, driving a massive annual revenue of A$138,429. Despite high demand, its unique charm and “Byron vibe” ensure it remains a top-tier, high-yielding market for hosts.
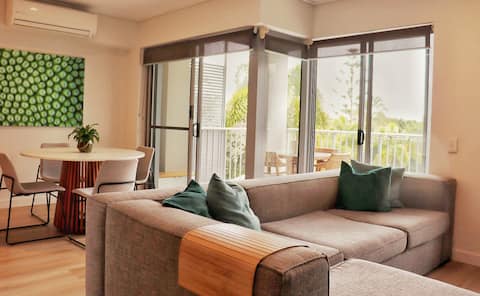
Featured Listings
Jindabyne is the essential gateway to the Snowy Mountains, serving as the primary base for skiers and snowboarders heading to Perisher and Thredbo. It’s a dynamic dual-season market that thrives in winter for snow sports and in summer for fishing, hiking, and mountain biking on Lake Jindabyne. The short-term rental market is very strong, with an average daily rate of A$516. Travelers seek spacious lodges for groups and cozy apartments with lake views, resulting in an annual revenue of A$86,612. Its strategic location and massive seasonal peaks ensure high demand and excellent returns for property owners.
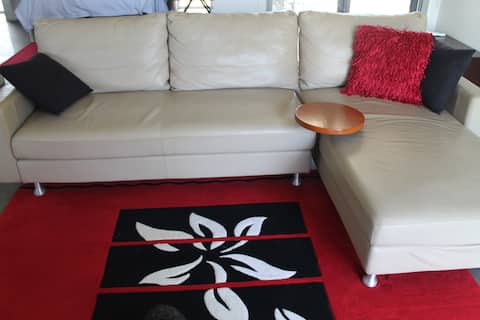
Featured Listings

Coffs Harbour is a beloved coastal destination on the Mid North Coast, famous for its Big Banana icon, stunning beaches, and the beautiful Solitary Islands Marine Park. It’s a premier family holiday spot that blends a relaxed coastal vibe with excellent urban amenities. The vacation rental market is robust, featuring an occupancy rate of 53%. Travelers favor well-located holiday apartments and family homes near the jetty and Park Beach, resulting in a steady annual revenue of A$64,266. Its central location between Sydney and Brisbane and its year-round outdoor appeal ensure a stable and reliable rental market.
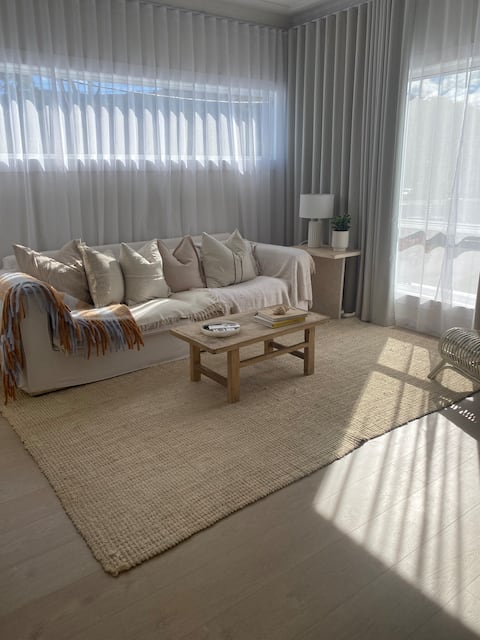
Featured Listings

Newcastle is Australia’s second-oldest city, a vibrant coastal hub that has successfully transitioned from an industrial past to a trendy destination known for its world-class surf beaches and thriving dining scene. It attracts a mix of business travelers and tourists seeking a sophisticated yet relaxed urban escape. The Airbnb market is robust, featuring an occupancy rate of 63%. Visitors favor renovated character homes and modern apartments near the harbor and beaches, generating a strong annual revenue of A$70,738. Its consistent events calendar and growing reputation as a cultural hub ensure steady demand year-round.
Featured Listings
Pokolbin is the heart of the Hunter Valley wine country, famous for its world-class vineyards, gourmet dining, and spectacular golf courses. It’s a premier weekend destination for travelers seeking a sophisticated escape from Sydney. The short-term rental market is exceptionally high-yielding, featuring an average daily rate of A$728. Visitors seek luxury vineyard estates and charming cottages, driving a massive annual revenue of A$106,270. Its constant stream of weddings, concerts, and wine festivals ensures consistent demand and premium pricing, making it a top-tier market for high-end hosts.
Featured Listings
Kingscliff is a charming seaside village on the Tweed Coast, offering a relaxed and upscale alternative to the busy Gold Coast. Famous for its long sandy beaches, creek-side activities, and a high-quality dining strip, it’s a favorite for families and couples seeking a quiet getaway. The Airbnb market is high-performing, with an occupancy rate of 61%. Visitors favor modern beach houses and resort-style apartments, generating a strong annual revenue of A$98,319. Its proximity to both the Gold Coast and Byron Bay, combined with its peaceful atmosphere, makes it a highly desirable and stable rental market.
Featured Listings
Wollongong is a stunning coastal city located between the Illawarra Escarpment and the Pacific Ocean, offering a unique blend of industrial heritage and spectacular natural beauty. As a major regional center, it attracts a diverse mix of students, business travelers, and families seeking a beachside lifestyle. The vacation rental market is solid, featuring an occupancy rate of 57%. Travelers favor modern city apartments and family homes near North Wollongong Beach, resulting in an annual revenue of A$67,439. Its proximity to Sydney and its wealth of outdoor activities make it a reliable and attractive market for short-term rental hosts.
Featured Listings
Nelson Bay is the vibrant hub of Port Stephens, known as the ‘dolphin capital of Australia’ and famous for its stunning blue waters and massive sand dunes. It’s a premier family holiday destination offering everything from whale watching to snorkeling and coastal hiking. The vacation rental market is robust, with an occupancy rate of 48%. Travelers favor beachside apartments and spacious holiday homes, resulting in an annual revenue per listing of A$68,765. Its consistent popularity with Sydney-based families and its spectacular natural setting ensure steady demand and reliable returns for hosts.
Featured Listings
Yamba is the Clarence Valley’s coastal gem, frequently voted as one of Australia’s best towns for its incredible surf, fresh seafood, and unhurried pace of life. It offers a nostalgic and authentic beach holiday experience that is increasingly rare. The short-term rental market is strong, featuring an occupancy rate of 53%. Visitors seek character-filled beach houses and apartments with views of the Clarence River or the ocean, generating an annual revenue of A$73,894. Its reputation as a ‘hidden gem’ ensures a loyal following of domestic travelers and a stable environment for rental investment.
Featured Listings
Get Live New South Wales, Australia Market Intelligence
Discover detailed New South Wales, Australia Airbnb Analytics and explore real-time market data to make accurate investment decisions.
Explore Real-time Analytics