Airbnb Occupancy Rates in City Of Hobart, Tasmania(October 2026)
Short-term rentals across Hobart generate an average of A$69,884 per year, with a typical occupancy rate of 68% and daily rates averaging A$283. As of October 2026, there were 942 active listings on Airbnb in Australia’s southernmost capital—from the waterfront CBD to Battery Point, Sandy Bay, and the foothills suburbs.
Hobart pairs world-class culture (MONA, Salamanca Market, Dark Mofo) with Antarctic gateway tourism and access to the Tasmanian wine trail. Investors find a compact, high-ADR market where heritage terraces and harbour-view apartments often outperform national averages on nightly rates.
City Of Hobart Airbnb Market Map (October 2026)
City Of Hobart Market Performance
Australia average: 58% occupancy, A$333 per night.
Airbnb occupancy rates by city in AustraliaPeriod: October 2025 - September 2026
Is Airbnb a Good Investment in City Of Hobart?
YES, Hobart is a compelling short-term rental market for investors who want a smaller, premium market with strong ADR and less east-coast oversupply.
Hobart delivers above-average annual revenue and occupancy relative to listing count, with daily rates that compete with larger capitals. The trade-off is scale: fewer than 1,000 metro-wide listings means less room for mass-market strategies, but well-positioned properties face less competition. Compliance centres on Tasmanian planning permits and City of Hobart rates rules—not a simple statewide register.
Market Comparison: Hobart vs. Major Australian Markets
| Market | Avg Revenue | Occupancy | What stands out |
|---|---|---|---|
| Hobart | A$69,884 | 68% | Premium ADR; compact market; culture and cruise tourism. |
| Sydney | A$81,843 | 68% | Largest revenue pool; 180-day non-hosted cap in NSW. |
| Melbourne | A$59,054 | 60% | Deepest inventory; Victoria short-stay levy. |
| Adelaide | A$63,206 | 63% | Similar mid-size capital profile; festival and wine regions. |
| Brisbane | A$65,199 | 67% | Larger east-coast hub; no QLD night cap. |
Strategic Advantages
- Premium ADR: Harbour and heritage stock often commands higher nightly rates than metro averages suggest.
- Culture tourism: MONA, Salamanca Market, and Dark Mofo draw interstate and international visitors year-round.
- Cruise gateway: Antarctic and cruise-ship seasons add bursts of waterfront demand.
- Manageable scale: A concentrated market where quality presentation and location beat sheer volume.
Get Live City Of Hobart Market Intelligence
Discover detailed City Of Hobart Airbnb Analytics and explore real-time market data to make accurate investment decisions.
Explore Real-time Analytics
How Often Will Your Airbnb Be Booked in City Of Hobart?
View Demand Patterns →Occupancy rates directly impact your revenue potential. Understanding demand patterns helps you set realistic expectations and optimize your availability strategy.
The current average occupancy rate in City Of Hobart is 68%, meaning properties are booked for about 247 nights per year. However, occupancy varies significantly based on property quality and management. Here's what you can expect:
Airbnb Occupancy Tiers in City Of Hobart
Premium(Top 10%) | High-performing(Top 25%) | Average(Median) | Low-performing(Bottom 25%) |
|---|---|---|---|
| 94% | 83% | 69% | 50% |
*High desirability & optimized availability | *Good market fit & guest satisfaction | *Standard market performance | *Higher vacancy, optimization needed |
Seasonal Occupancy Patterns in City Of Hobart
November, February
Highest demand and occupancy rates. Perfect for premium pricing strategies and maximizing revenue. Consider longer minimum stays and higher rates.
September, April
Moderate demand with balanced pricing opportunities. Good for attracting budget-conscious travelers while maintaining reasonable occupancy rates.
August, May
Lower demand requires competitive pricing and creative marketing. Focus on local events, extended stay discounts, and targeting specific traveler segments.
How Much Can You Earn with Airbnb in City Of Hobart?
Calculate Earnings →One of the most common questions for potential Airbnb hosts in City Of Hobart is about earning potential. Let's break down the revenue patterns and what you can realistically expect to earn.
Monthly Revenue Trends in City Of Hobart
Best-in-class Airbnb properties (top 10%) in City Of Hobart achieve around A$101,752 annually, while strong performers (top 25%) earn at least A$74,221. Typical properties generate about A$50,062 per year, and entry-level listings (bottom 25%) see earnings near A$29,181, often with room for optimization. Keep in mind, these are market averages—your actual earnings can be even higher depending on your property's location, bedrooms, guest capacity, and unique amenities.
Want to see how your listing could perform? Create a free account to unlock personalized analytics and explore exclusive insights in our app!
What Can You Learn from Top-Performing Airbnbs in City Of Hobart?
View Top Performers →Studying successful properties provides valuable insights for your own Airbnb strategy. Here are the top-performing listings in City Of Hobart and what makes them successful.
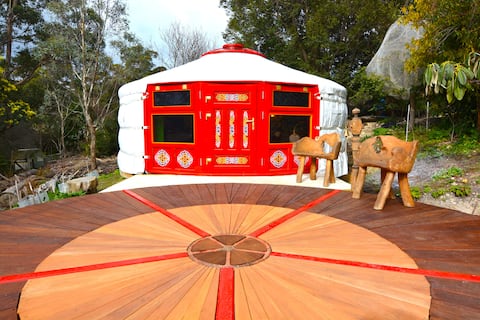
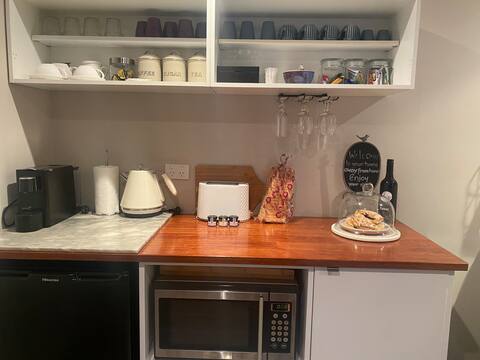
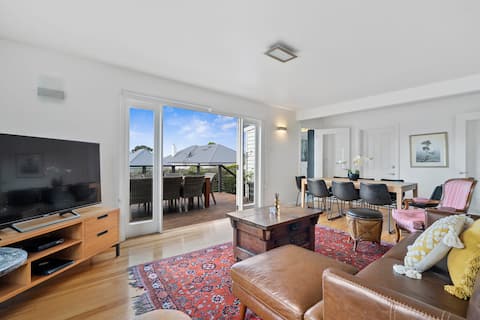
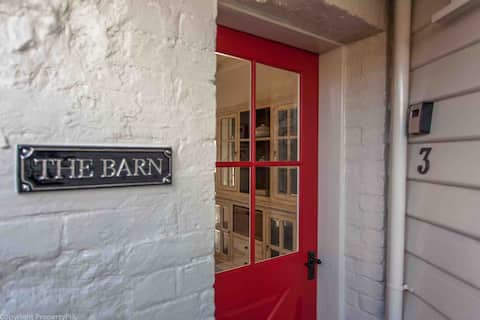
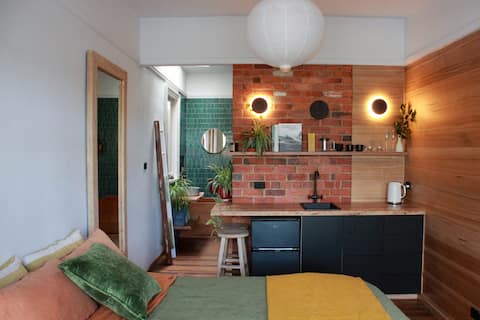
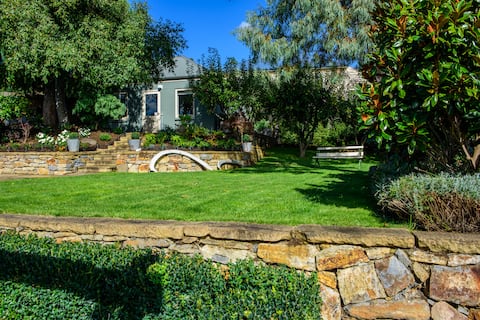
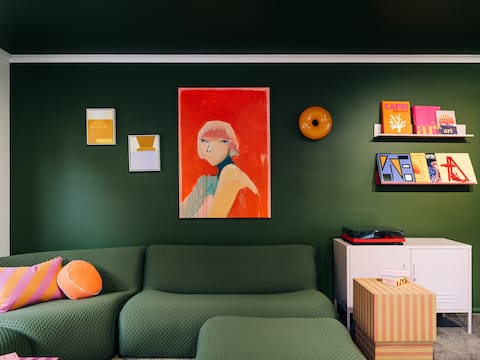
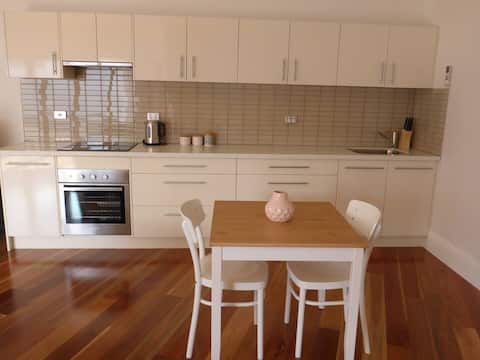
City Of Hobart Market Analysis
Hobart Short-Term Rental Market Insights
Hobart’s short-term rental market is compact but high-performing. The city clusters around the Derwent River waterfront, with Battery Point, Sandy Bay, and the CBD forming the core guest map. Unlike Sydney or Melbourne, there are no distant beach suburbs inside the council area—almost every listing competes within a 15-minute drive of Salamanca.
Demand Drivers
Cultural tourism is the headline: the Museum of Old and New Art (MONA), Salamanca Market, and festivals such as Dark Mofo and the Taste of Tasmania drive strong weekend and event-period bookings. Antarctic expedition departures and cruise-ship days lift waterfront precincts. Domestic travellers increasingly visit Tasmania for food, wine, and wilderness add-ons, using Hobart as a base.
Government, university, and hospital employment support mid-week corporate and academic stays in Sandy Bay, New Town, and the CBD.
Seasonality
Summer (December–February) is peak season for festivals, cruises, and outdoor dining. Autumn and spring remain solid for cultural events and wine-country weekends. Winter is cooler but Dark Mofo and cosy heritage cottages sustain occupancy in inner suburbs better than purely coastal markets.
Investment Outlook
Hobart rewards character properties—convict-era terraces, renovated workers’ cottages, and harbour-view apartments. Whole-home investment lets usually need a City of Hobart planning permit unless you qualify for home-sharing (principal residence) exemptions. Budget for differential council rates on permitted whole-property short-stay use. Check strata by-laws before buying apartments.
What Are the Airbnb Regulations in City Of Hobart?
Understanding local regulations is crucial for operating a successful Airbnb. Let's examine the compliance landscape and what you need to know about licensing requirements in City Of Hobart.
Registration Numbers on Airbnb
76% of the active Airbnb listings we tracked last month display a registration or license number.
This reflects what hosts publish on their Airbnb listings, not the local legal requirements. Always confirm them with local authorities.
Short-term rental accommodation in Hobart is regulated through Tasmanian state planning law, the Short Stay Accommodation Act 2019, and City of Hobart planning and rates rules. There is no statewide annual night cap comparable to New South Wales.
Planning & Permits
- Whole-home short-stay use generally requires a planning permit from City of Hobart unless you qualify for a home-sharing exemption.
- Home-sharing (no permit for many cases): Your principal place of residence, let only while you are on holiday or temporarily absent, or you live on site and host guests in not more than four bedrooms.
- Investment properties: Non-owner whole-home lets typically need a discretionary planning permit; strata properties with other dwellings on title face stricter tests under the Tasmanian Planning Scheme.
- Apply via City of Hobart visitor accommodation planning guidance and check zones on the state planning scheme viewer.
Platform Reporting (Statewide)
- The Short Stay Accommodation Act 2019 requires booking platforms to collect and display permit or exemption details on listings—hosts must declare compliance on Airbnb and similar sites.
Hobart Rates & Strata
- From 1 July 2024, Hobart applies differential general rates for properties classified as short-stay visitor accommodation when a whole-property planning permit is in place. Home-sharing exemptions above are generally excluded.
- Strata by-laws may restrict short-term use even when planning allows it—check body corporate rules before purchasing apartments.
Official Sources
What Should You Charge for Your Airbnb in City Of Hobart?
Smart Pricing Tools →Pricing is one of the most critical decisions for Airbnb success. Let's analyze the current pricing landscape and help you understand what rates you can realistically charge.
The current average daily rate in City Of Hobart is A$283 per night. However, pricing varies significantly based on property quality and location. Here's what different property tiers typically charge:
Airbnb Pricing Tiers in City Of Hobart
Premium(Top 10%) | High-performing(Top 25%) | Average(Median) | Budget(Bottom 25%) |
|---|---|---|---|
| A$450per night | A$332per night | A$241per night | A$177per night |
*Top locations, big properties, premium amenities | *Good property management, highly rated | *Standard market performance | *Basic properties, less desirable locations |
Is It Profitable to Start an Airbnb in City Of Hobart?
Investment Analysis →Understanding the profitability potential is crucial for any Airbnb investment decision. Let's analyze the revenue performance and profit margins in the City Of Hobart market to help you make informed financial decisions.
Revenue Performance
Profitability Factors
Which Areas in City Of Hobart Are Most Profitable for Airbnb?
Explore All Areas →Hobart’s short-term rental map is tight: eight primary localities with landing-page data, each within minutes of the CBD. Performance is driven by waterfront proximity, heritage charm, and university adjacency rather than sprawling suburban zones.
Top Performing Areas
Battery Point: Heritage cottages and harbour walks lead the market with A$81,977 average annual revenue and 65% occupancy.
Hobart: The CBD and waterfront core deliver A$77,953 average revenue at 67% occupancy for apartments targeting business and cruise guests.
Sandy Bay: University of Tasmania and Wrest Point precinct support A$69,737 average revenue with 69% occupancy.
North Hobart: Elizabeth Street dining and quick CBD access yield A$67,978 average revenue at 68% occupancy.
Historic & Waterfront Districts
West Hobart: Hilltop views and village cafés achieve A$64,192 average revenue with 68% occupancy in character-home stock.
South Hobart: kunanyi/Mount Wellington access and creative community appeal drive A$56,048 average revenue at 69% occupancy.
Inner Suburbs & Lifestyle Pockets
New Town: Main Road shopping and hospital proximity support A$56,650 average revenue with 71% occupancy.
Lenah Valley: Leafy residential streets near the city fringe deliver A$53,506 average revenue at 63% occupancy for quieter whole-home stays.
Explore Other Markets in Australia
Airbnb Occupancy Rates in Surfers Paradise, Queensland
Gold Coast City, Australia
2,397 Active Listings
Airbnb Occupancy Rates in Byron Bay, New South Wales
Byron Shire Council, Australia
857 Active Listings