Best Airbnb Markets in Nuoro, Sardegna
Finding the right investment opportunity in Nuoro, Sardegna starts with accurate, data-driven insights. Our team has evaluated the top 7 markets across the area to pinpoint where demand is strongest and which towns are truly thriving.
Keep in mind that these figures reflect broad market averages, which serve as an essential starting point for your research. To dive deeper into specific properties, custom filters, and advanced ROI projections, explore the full suite of tools at GuestFavorites.
Nuoro Airbnb Market Map (June 2026)
Orosei, nestled between imposing limestone cliffs and the crystal-clear waters of the Gulf of Orosei, is a destination of wild enchantment famous for the Biderosa Oasis and its white sand beaches. It is a prestigious village merging a well-preserved medieval historic center with exceptional coastal nature, attracting international tourism seeking relaxation and Sardinian authenticity. The Airbnb market is high-performing here, featuring an occupancy rate of 62%. Visitors seek exclusive residences nestled in pine forests and the charm of old-town apartments, paying an average daily rate of €138. Its annual revenue of €31,635 confirms Orosei as a gem for seaside real estate investment.
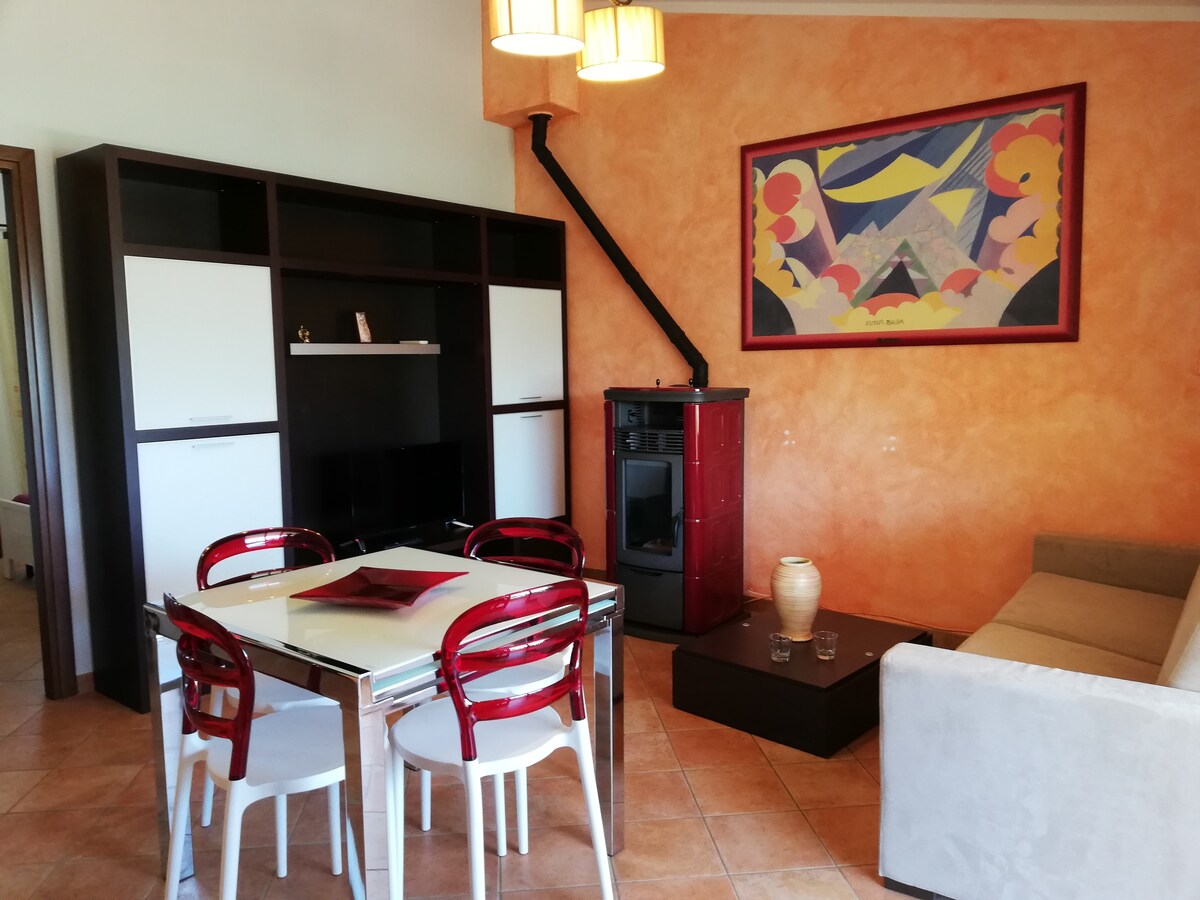
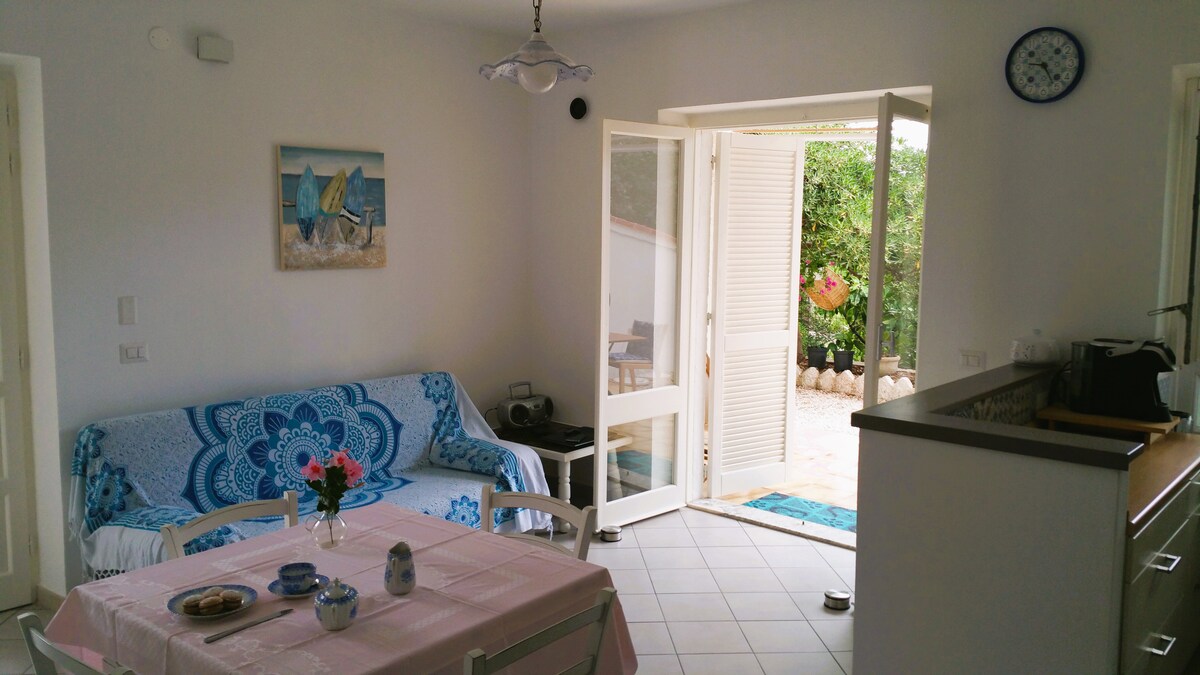
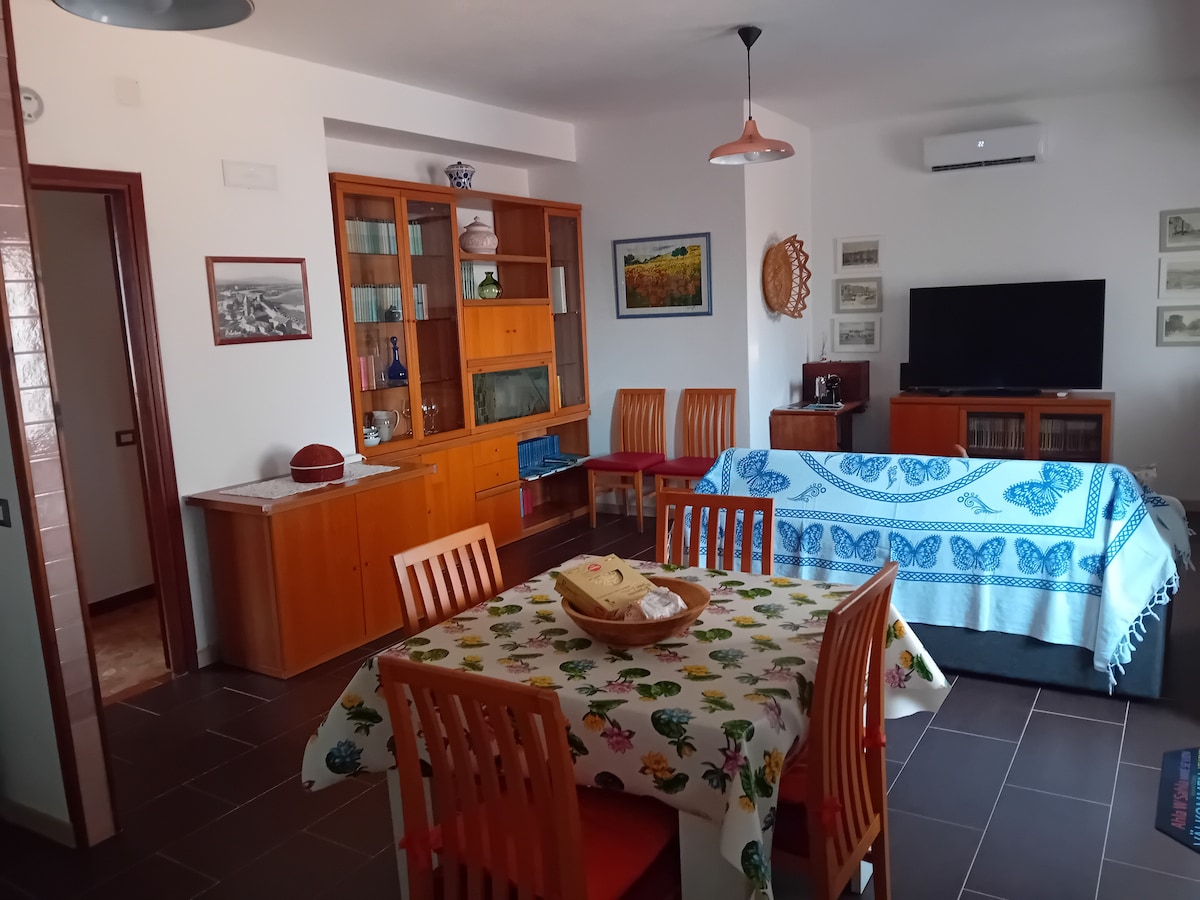
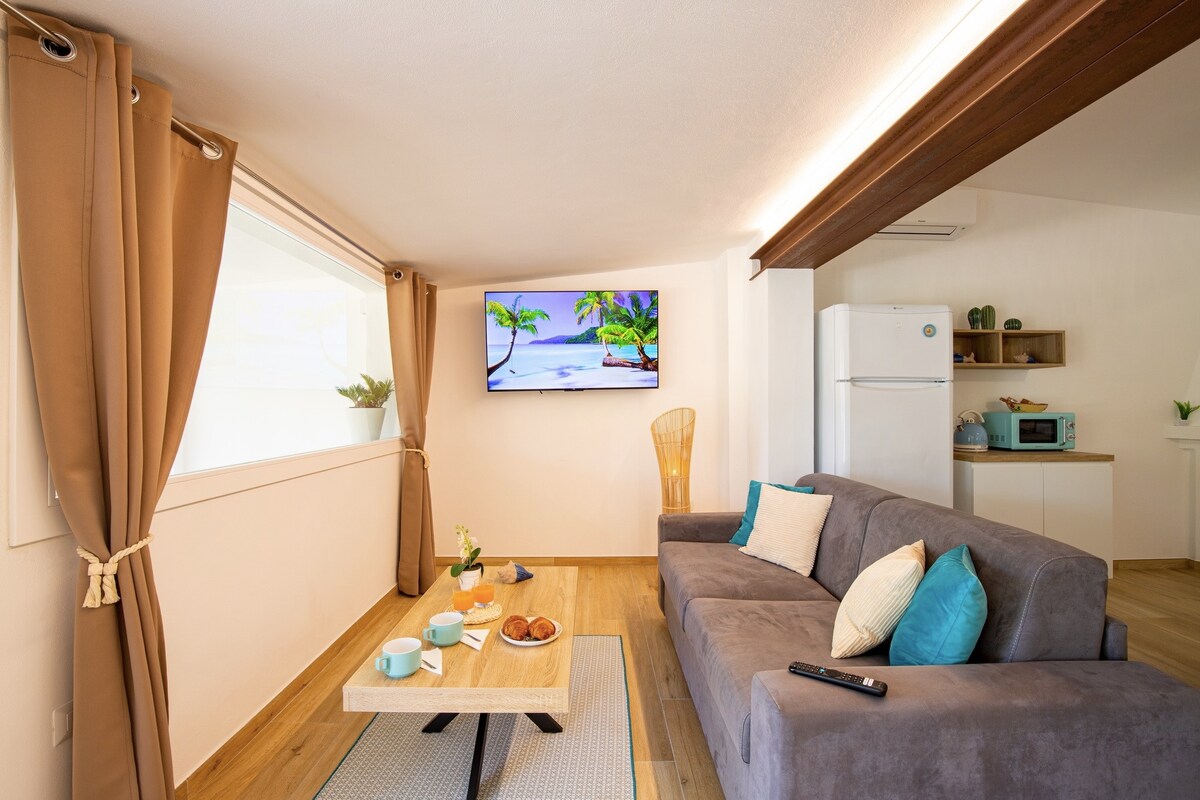
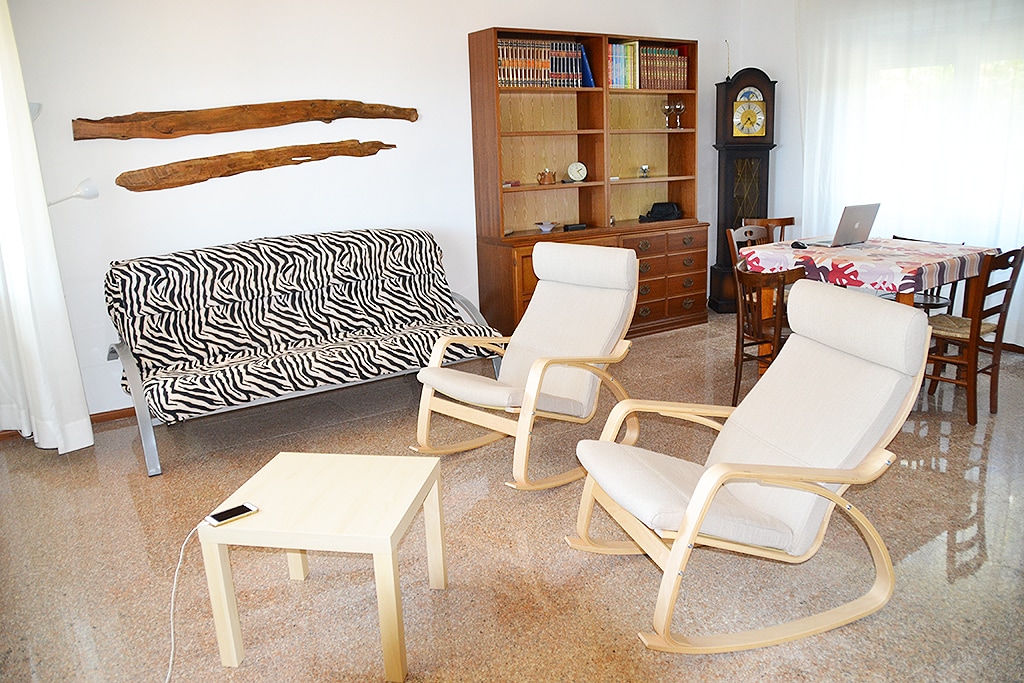
Featured Listings
Siniscola, a pearl of the eastern Sardinian coast, offers a natural scenery of rare beauty with its brilliant white-sand beaches and the pine forests of La Caletta. It is a destination that wins people over with its balance between crystalline sea and local traditions, attracting international tourism seeking relaxation and authenticity. The Airbnb market here is extraordinarily active, featuring an occupancy rate of 62%. Visitors seek the charm of holiday homes near the dunes and the functionality of apartments in the seaside village, generating an average annual revenue of €28,488. Its pristine beauty ensures some of the most solid profitability in the area.
Dorgali, a village set between the Supramonte mountains and the azure waters of Cala Gonone, offers one of the most spectacular natural settings in the Mediterranean. It is a mythical destination attracting international tourism seeking adventure, beaches accessible only by sea, and millenary archaeological sites. The Airbnb market here is high-performing, featuring an occupancy rate of 58%. Visitors appreciate the quality of apartments with gulf views and the character of stone houses in the center, generating an average annual revenue of €28,039. Its global fame and wild beauty ensure steady demand.
Tortolì, the beating heart of Ogliastra, enchants with its red rocks and the paradisiacal beaches of Lido di Orrì. It is a vibrant destination combining the vitality of an urban center with the beauty of an untouched coast, attracting family and youth tourism seeking sea, sports, and nature. The Airbnb market here is solid and efficient, featuring an occupancy rate of 58%. Visitors seek the modernity of apartments near the harbor and the independence of villas with gardens, generating an average annual revenue of €29,705. Its summer energy and hospitable climate ensure stable profitability.
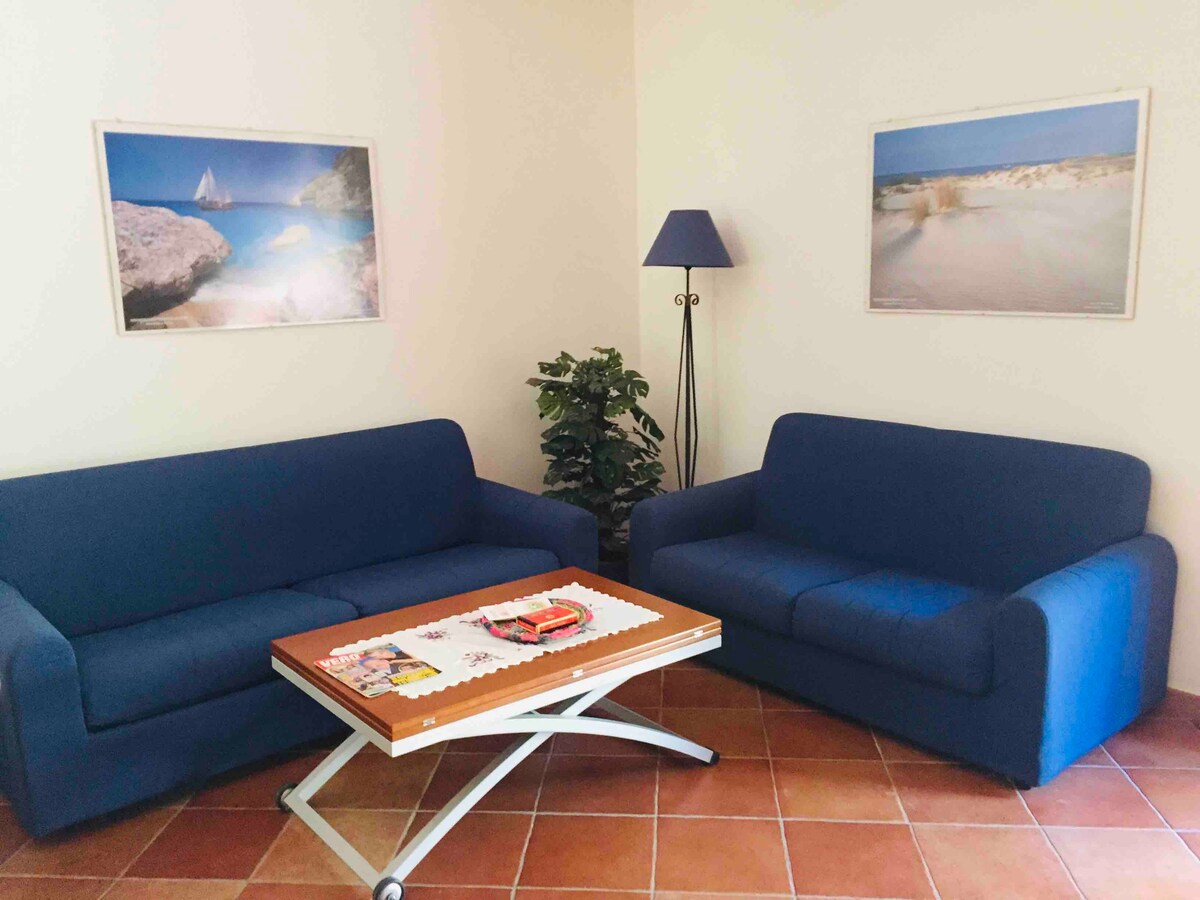
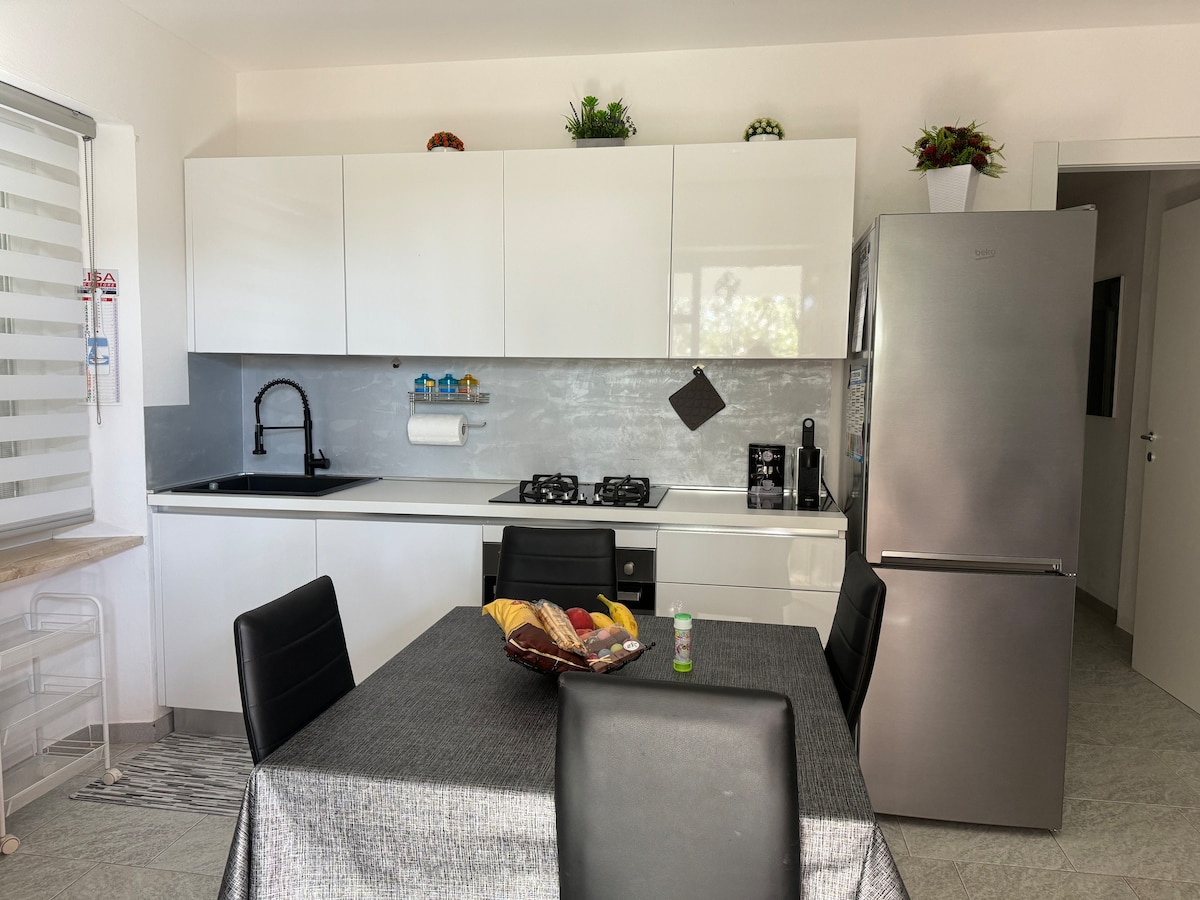
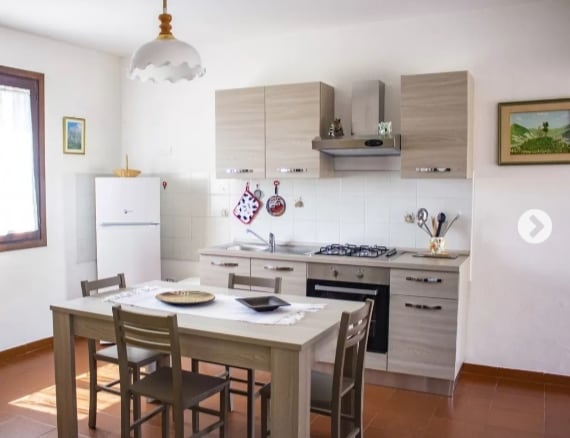
Featured Listings
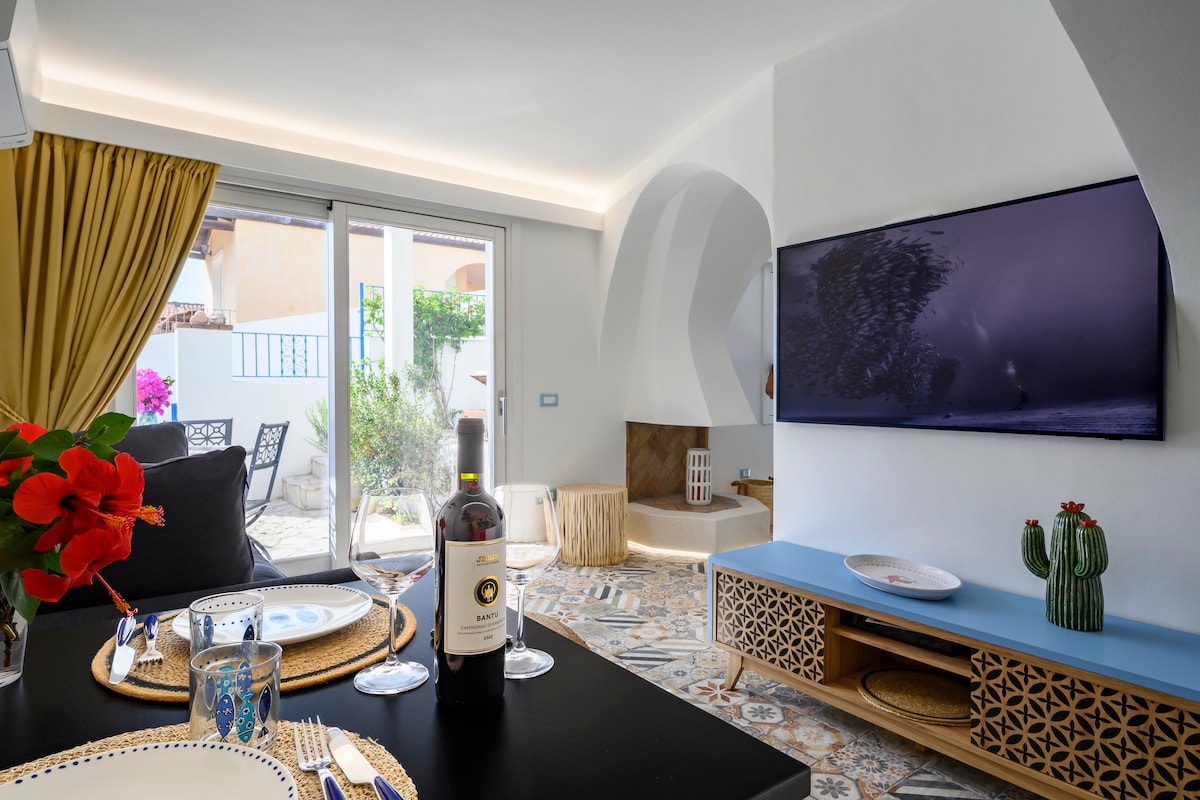
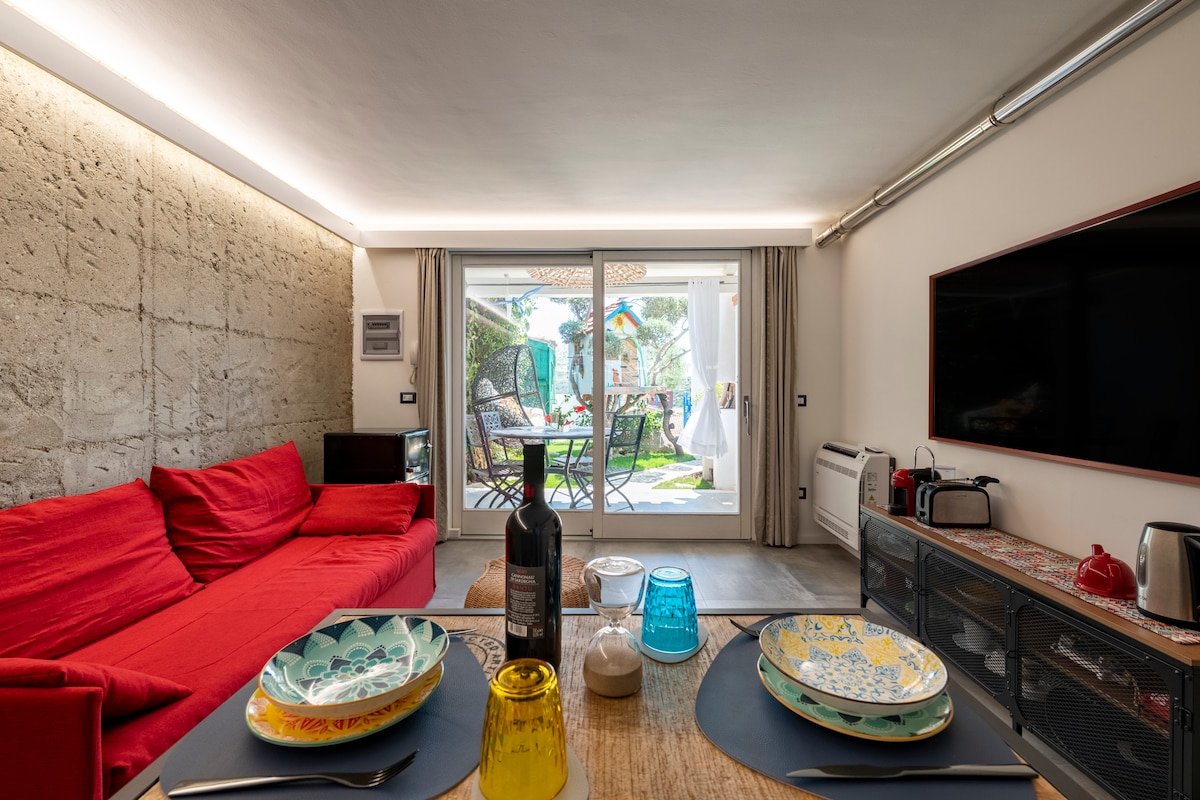
Tertenia, enclosed between the spectacular Ogliastra mountains and the emerald sea of the Sarrala marina, offers a natural scenery of rare visual power. It is a destination prioritizing absolute peace and contact with wild nature, attracting travelers seeking solitary beaches and slow rhythms. The Airbnb market here is incredibly profitable, featuring a notable annual revenue of €38,588. Visitors seek the exclusivity of stone villas with pools and the functionality of sea-view homes, taking advantage of an average daily rate of €168. Its pristine tranquility ensures a high-profile and successful investment.
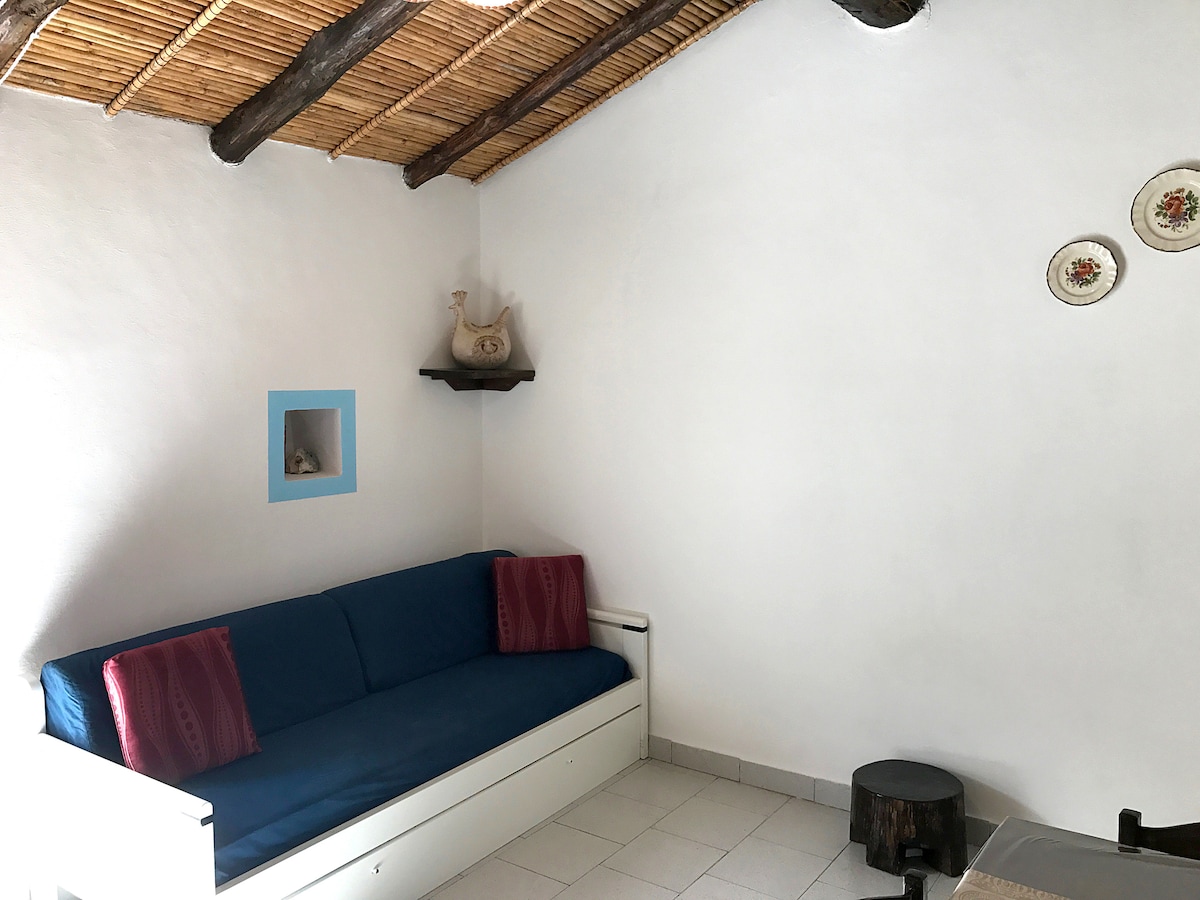
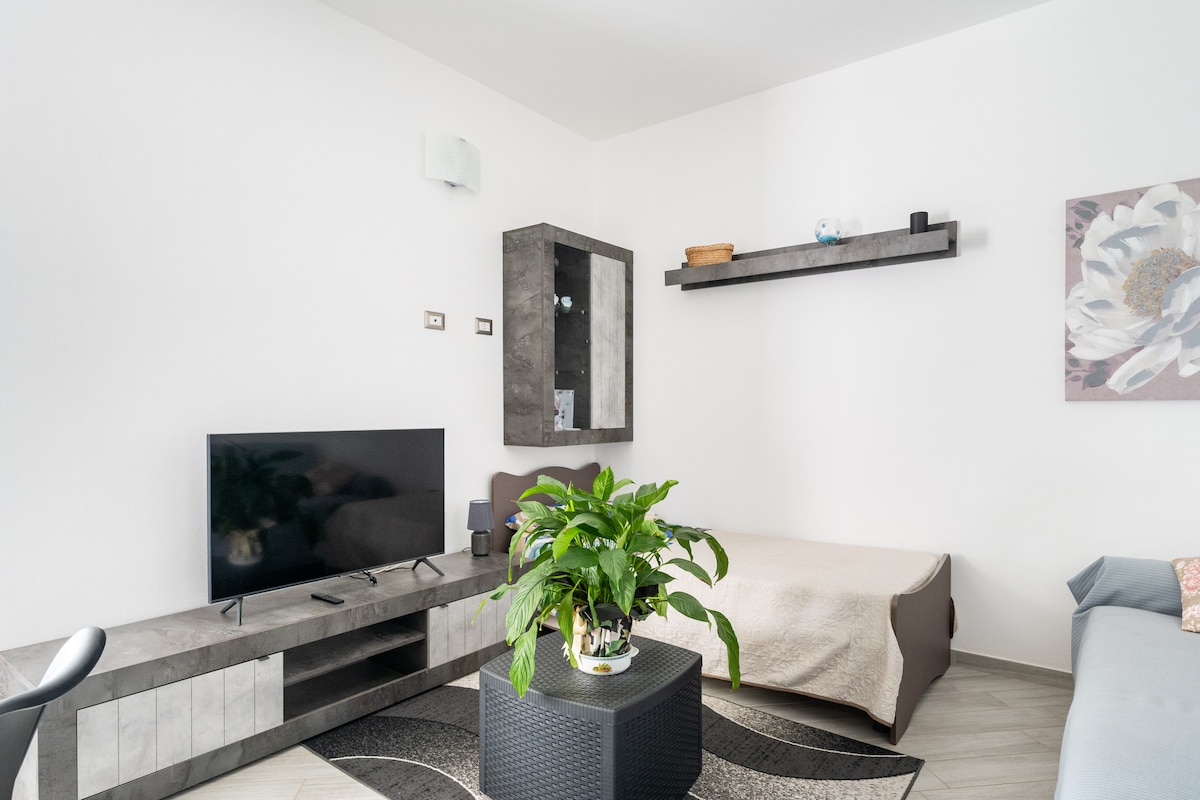
Featured Listings
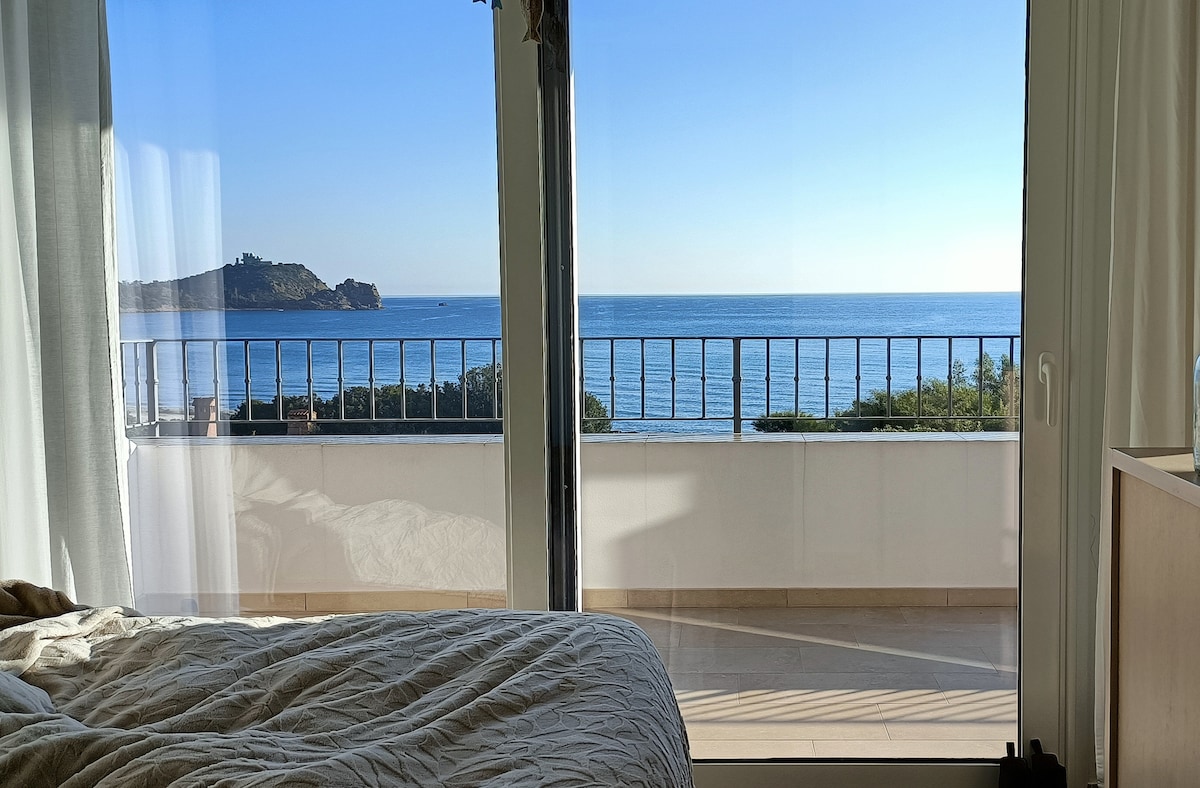
Baunei, a vertical village suspended between sky and sea, offers access to some of the world’s most iconic coves like Cala Goloritzé and Cala Mariolu. It is an exceptional destination attracting a sophisticated and trekking-loving international clientele, fascinated by the primordial beauty of the Gulf of Orosei. The Airbnb market here is extraordinarily high-performing, featuring an occupancy rate of 65%. Visitors seek the exclusivity of renovated traditional houses and the character of residences with panoramic views, taking advantage of a competitive average daily rate. With an average annual revenue of €23,009, the village ensures some of the highest profitability in Sardinia.
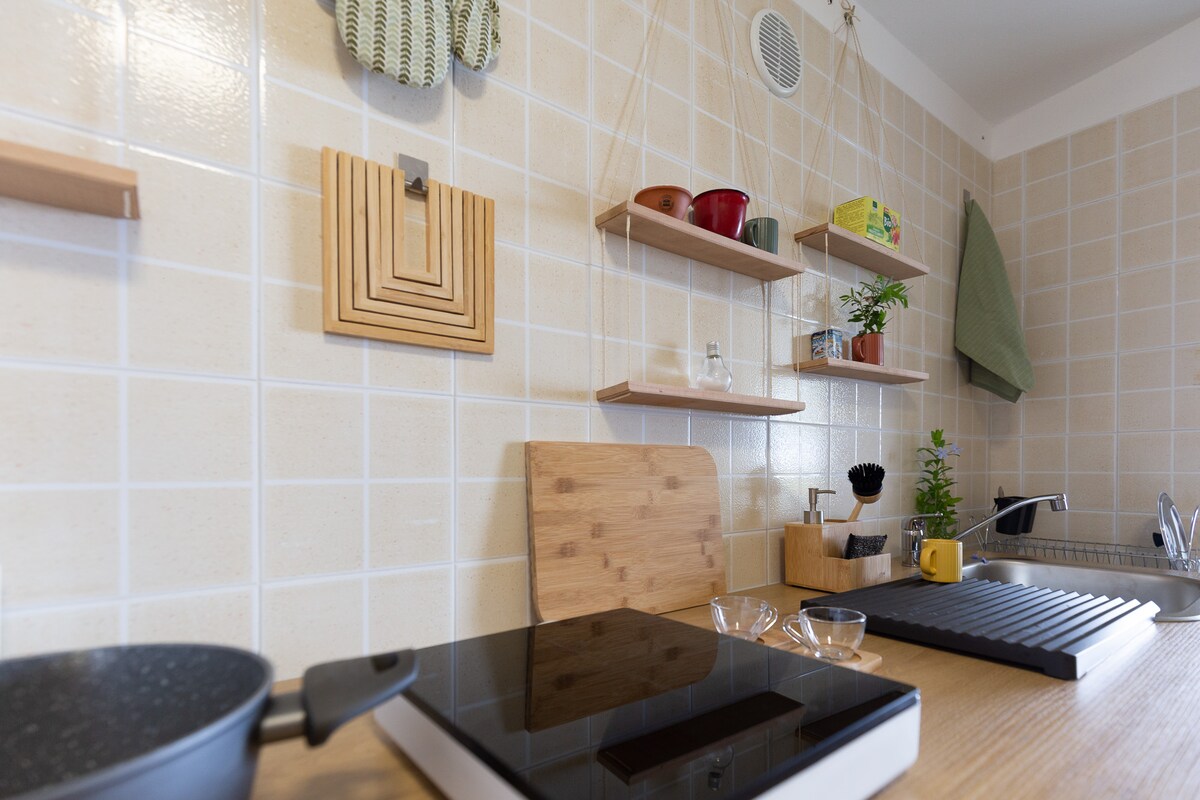
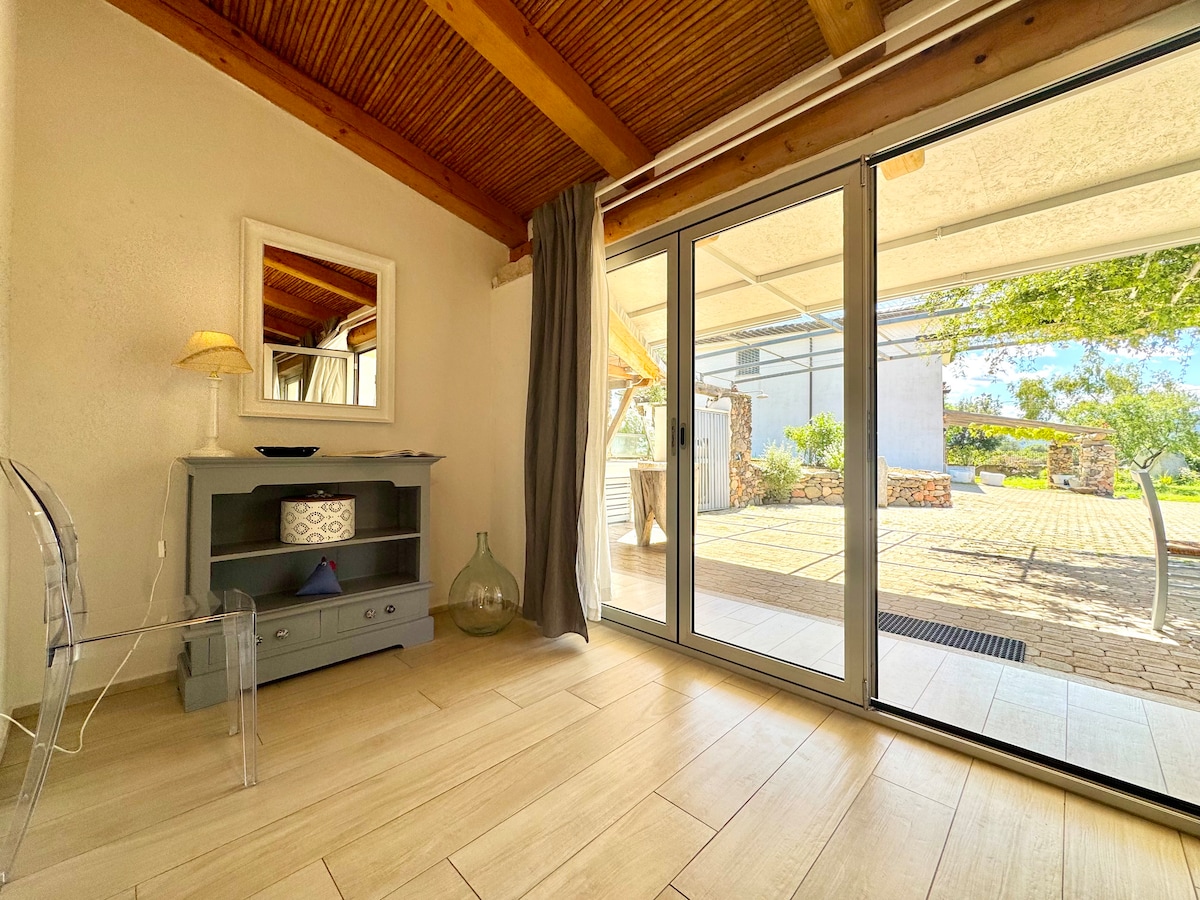
Featured Listings
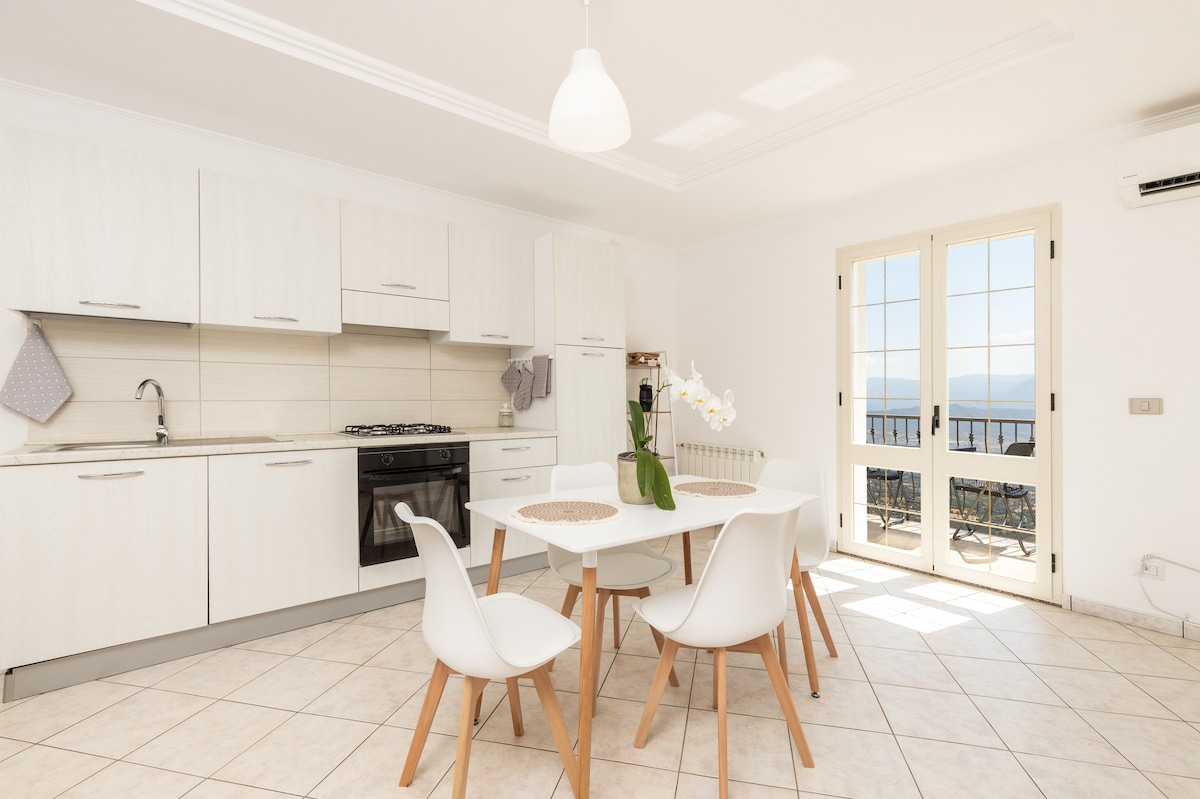

Bari Sardo, an ancient village dominated by the imposing Spanish tower on the beach of Torre di Barì, offers a perfect mix of history, crystalline sea, and Sardinian traditions. It is a destination that wins people over with its genuine hospitality and refreshing pine forests, attracting family tourism seeking relaxation and authenticity. The Airbnb market here is solid, featuring an occupancy rate of 60%. Visitors seek the charm of holiday homes immersed in greenery and the functionality of apartments near the coast, generating an average annual revenue of €26,030. Its timeless beauty ensures stable profitability.
Featured Listings
Get Live Nuoro, Sardegna Market Intelligence
Discover detailed Nuoro, Sardegna Airbnb Analytics and explore real-time market data to make accurate investment decisions.
Explore Real-time Analytics