Best Airbnb Markets in Sardegna, Italy
The Sardegna, Italy short-term rental market offers diverse opportunities for investors who know where to look. By analyzing the top 10 performing markets, we’ve highlighted the towns that currently lead the way in occupancy and revenue.
Remember that the figures shown here are regional averages and should be used as a guide for further investigation. To access precise performance data, custom reports, and professional-grade analytics, head over to GuestFavorites.
Sardegna Airbnb Market Map (June 2026)
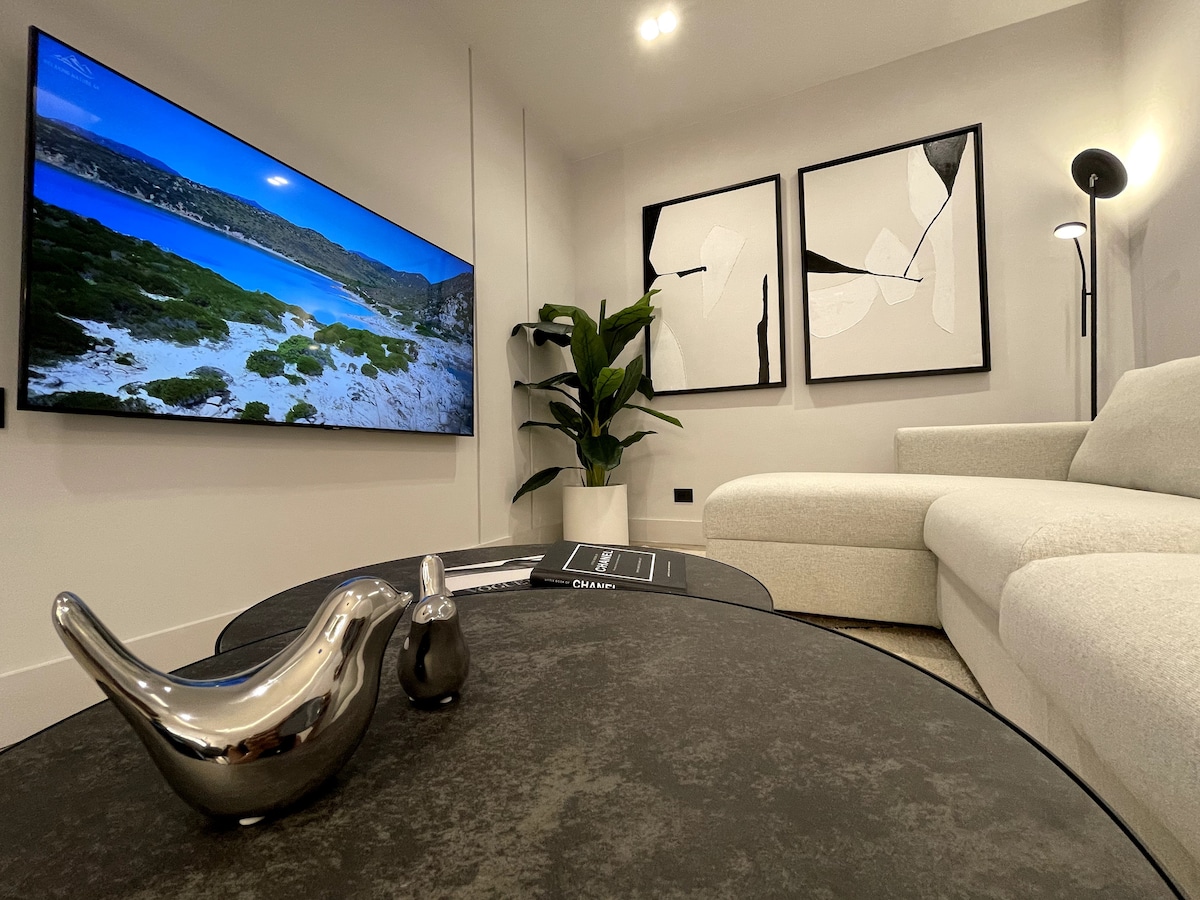
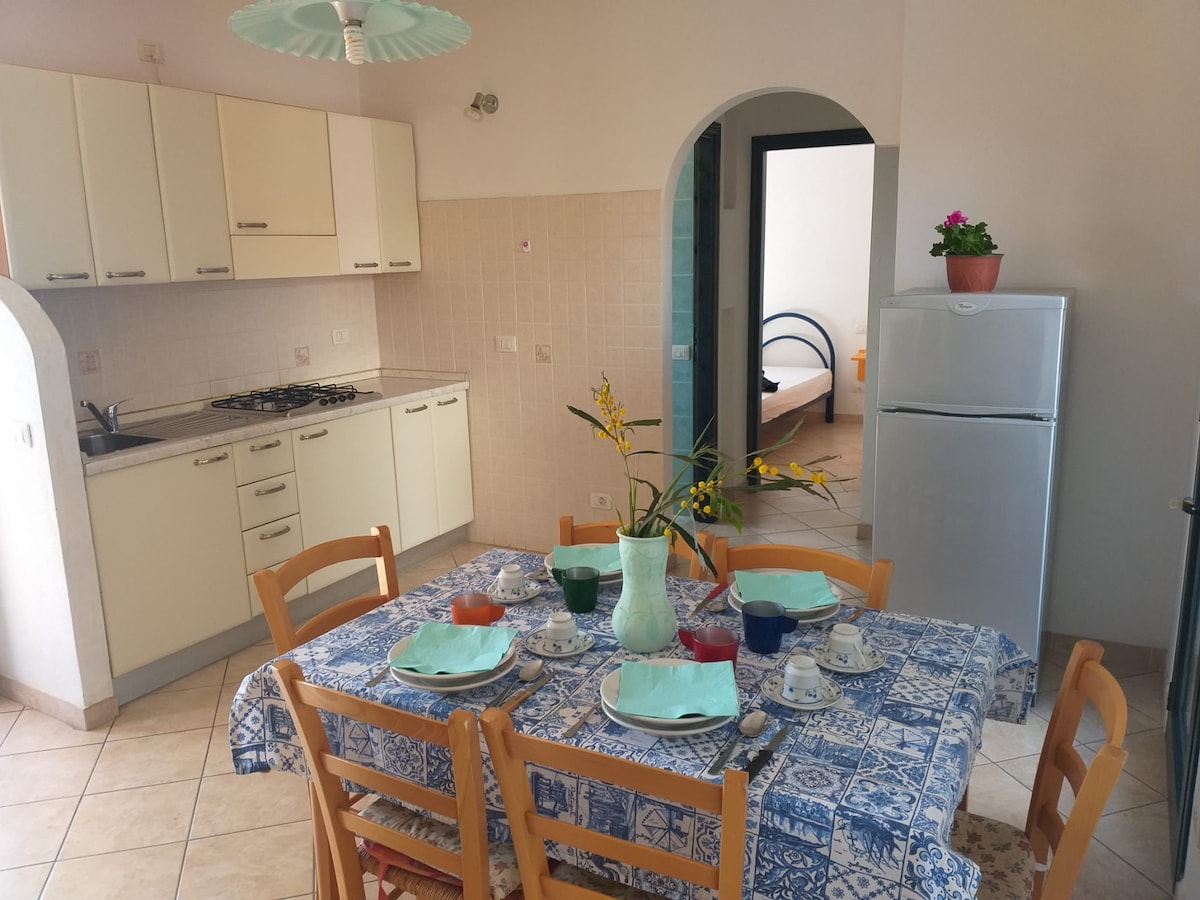
Olbia, the main gateway to the Costa Smeralda and northern Sardinia, is a city in full boom merging commercial energy with millennial history and enchanting beaches like Pittulongu. Thanks to its harbor and international airport, it attracts massive tourism and a strong business clientele year-round. The Airbnb market is extremely efficient here, featuring an occupancy rate of 60%. Visitors seek modern apartments in the vibrant center and stylish rentals near the sea and transport hubs, paying an average daily rate of €204. Its role as a strategic hub ensures an annual revenue of €45,367 for property owners.
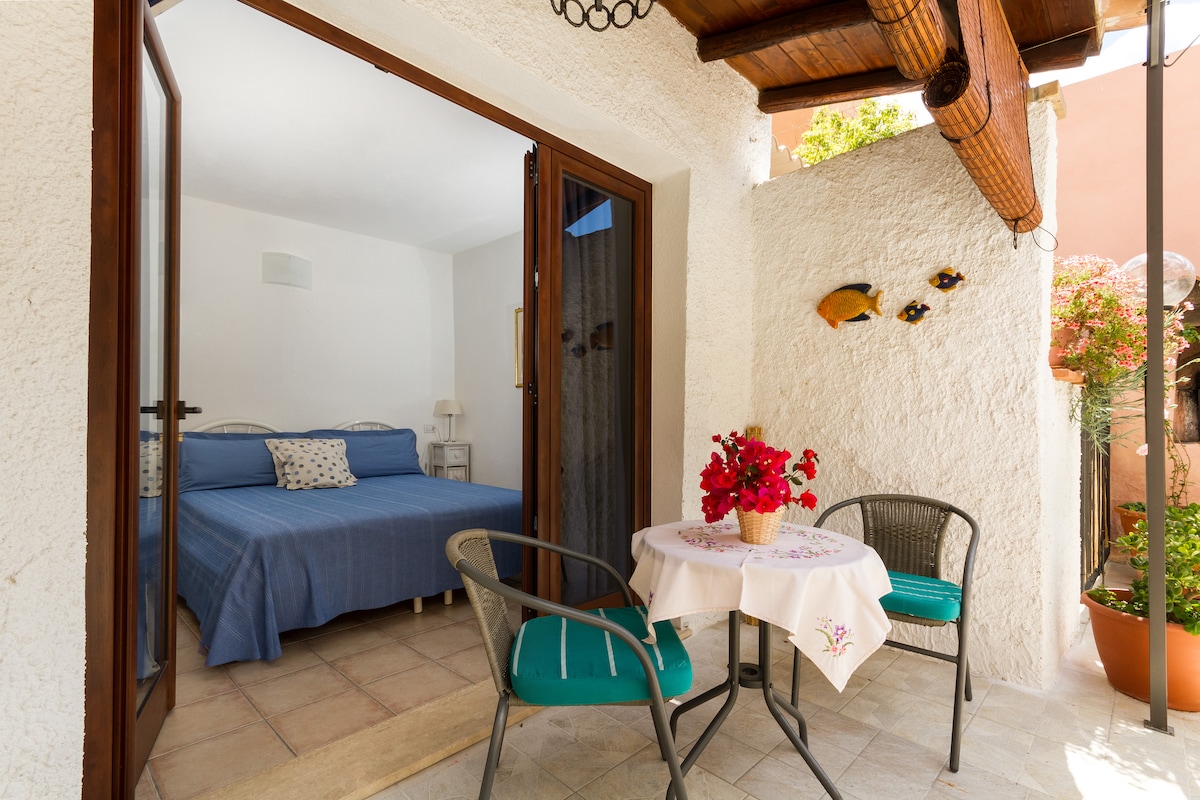
Featured Listings
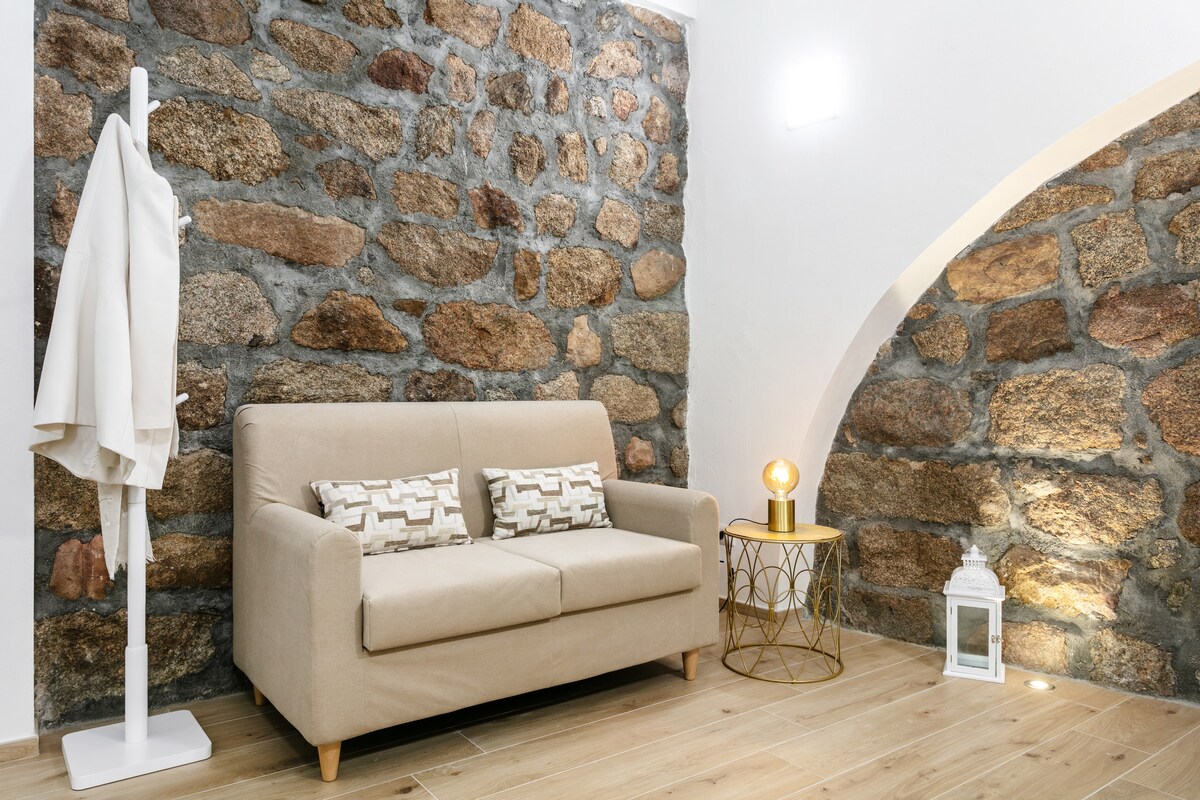
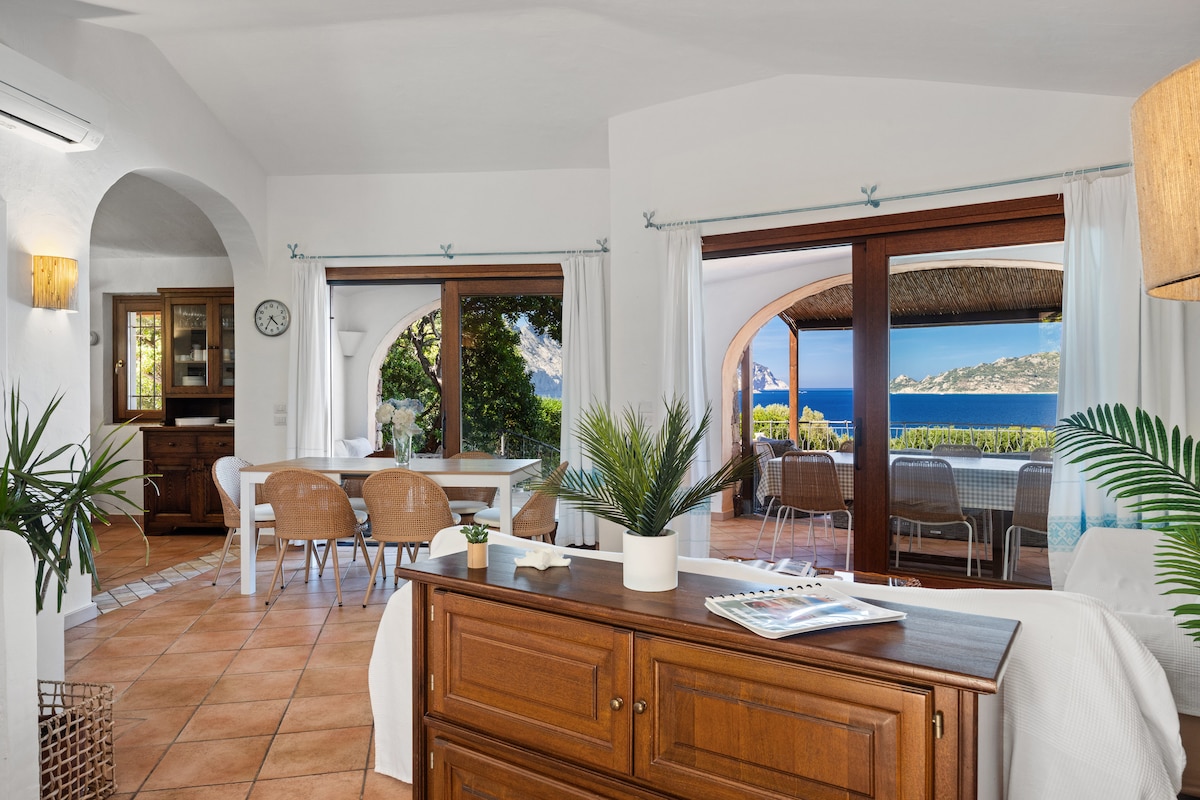
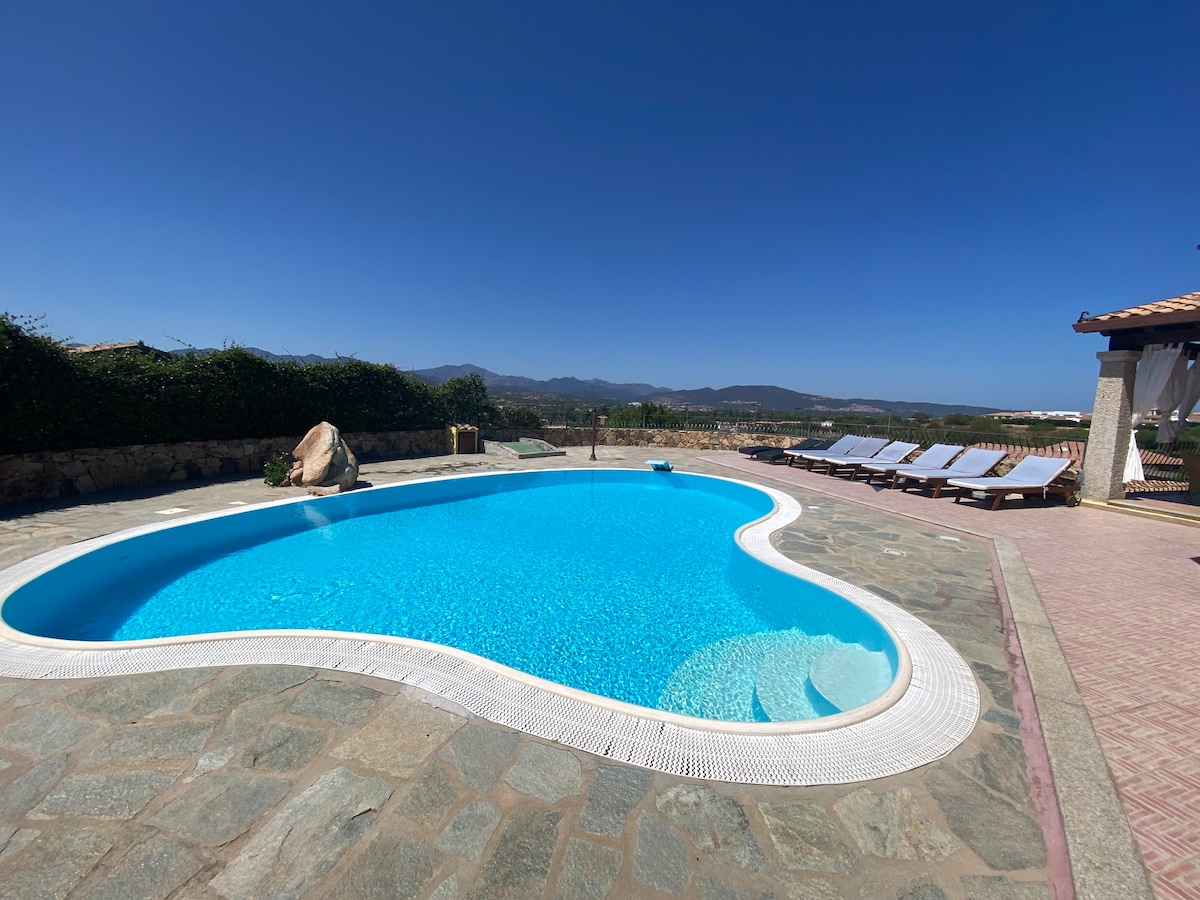
Arzachena, the administrative heart of the Costa Smeralda, is a world-class prestigious destination famous for Porto Cervo, Baja Sardinia, and its pink granite beaches with turquoise waters. It is the symbol of international luxury attracting elite tourism seeking exclusivity, high society, and untouched Sardinian nature. The Airbnb market is extraordinarily profitable here, featuring an average daily rate of €365. Visitors seek exclusive villas with pools nestled in Mediterranean scrub and the charm of apartments in luxury villages, generating an annual revenue of €83,067. Its global prestige ensures profitability at the top of the market rankings.
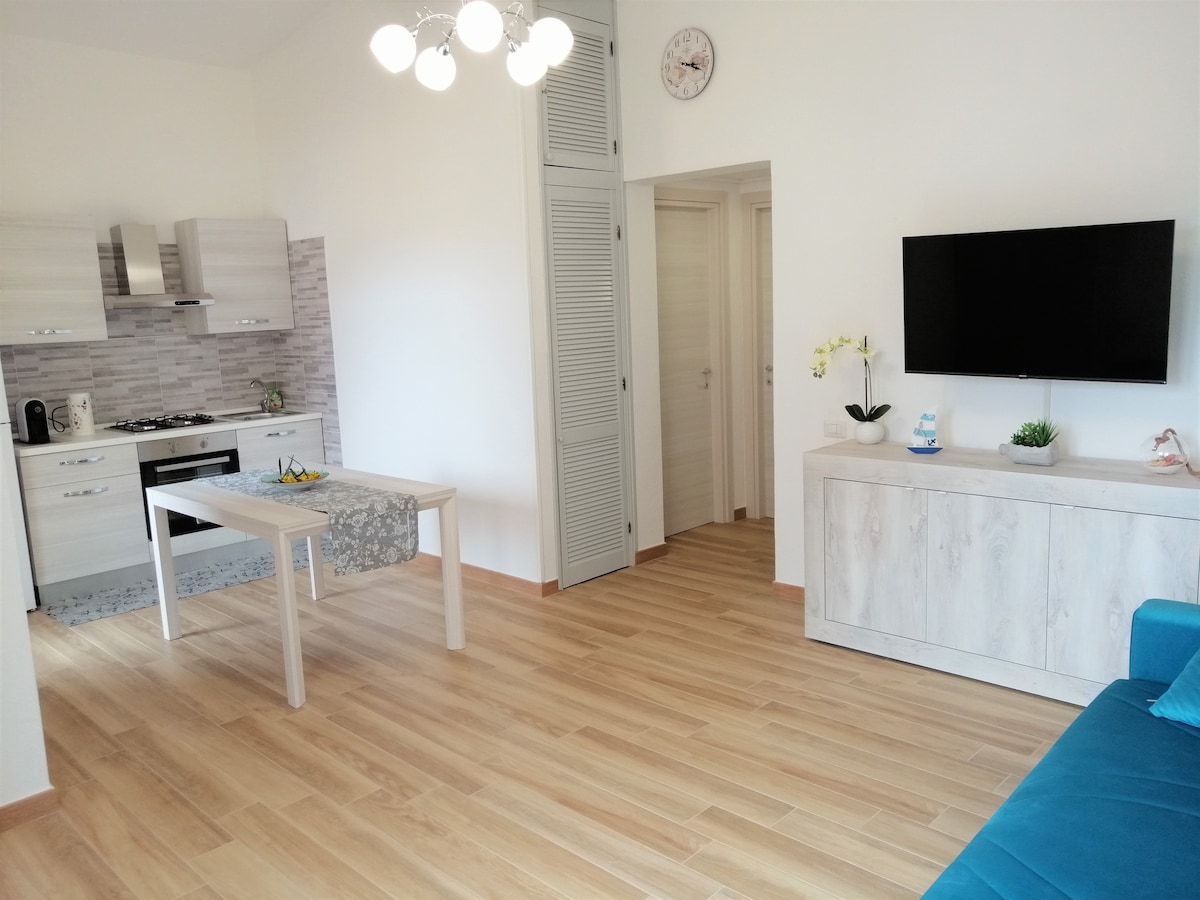
Featured Listings
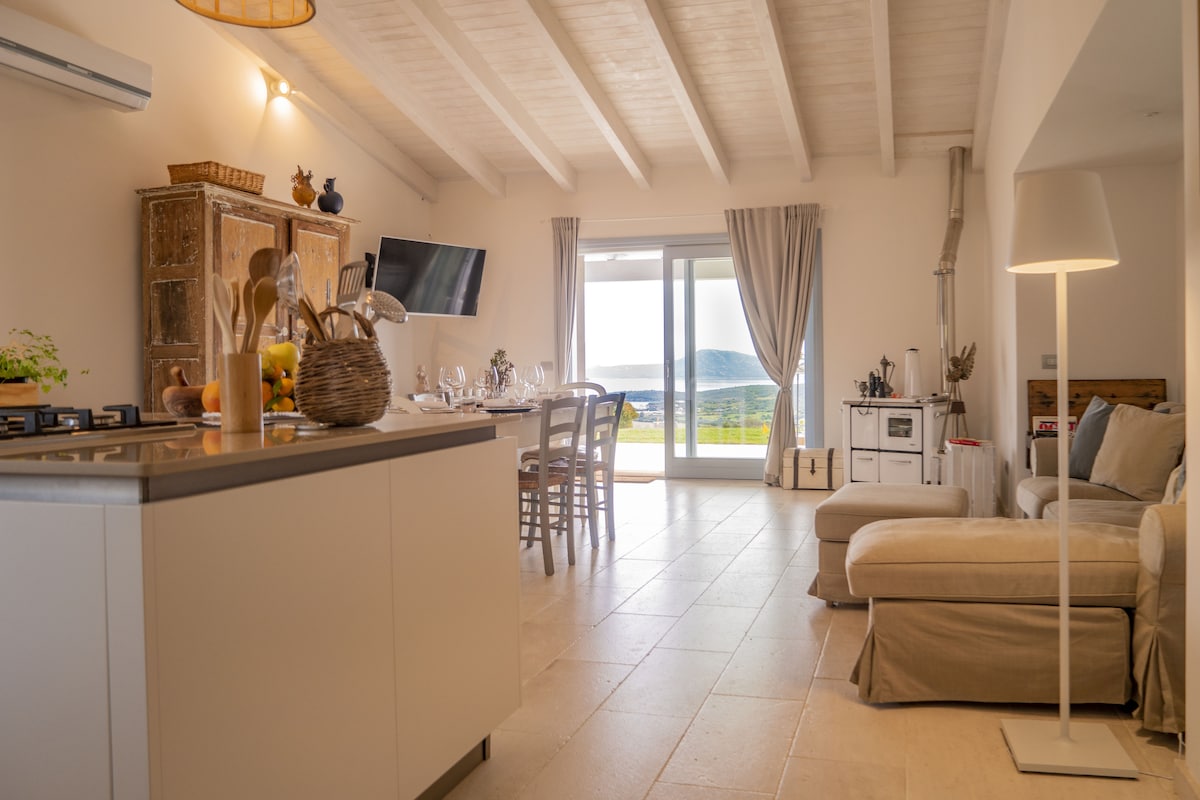
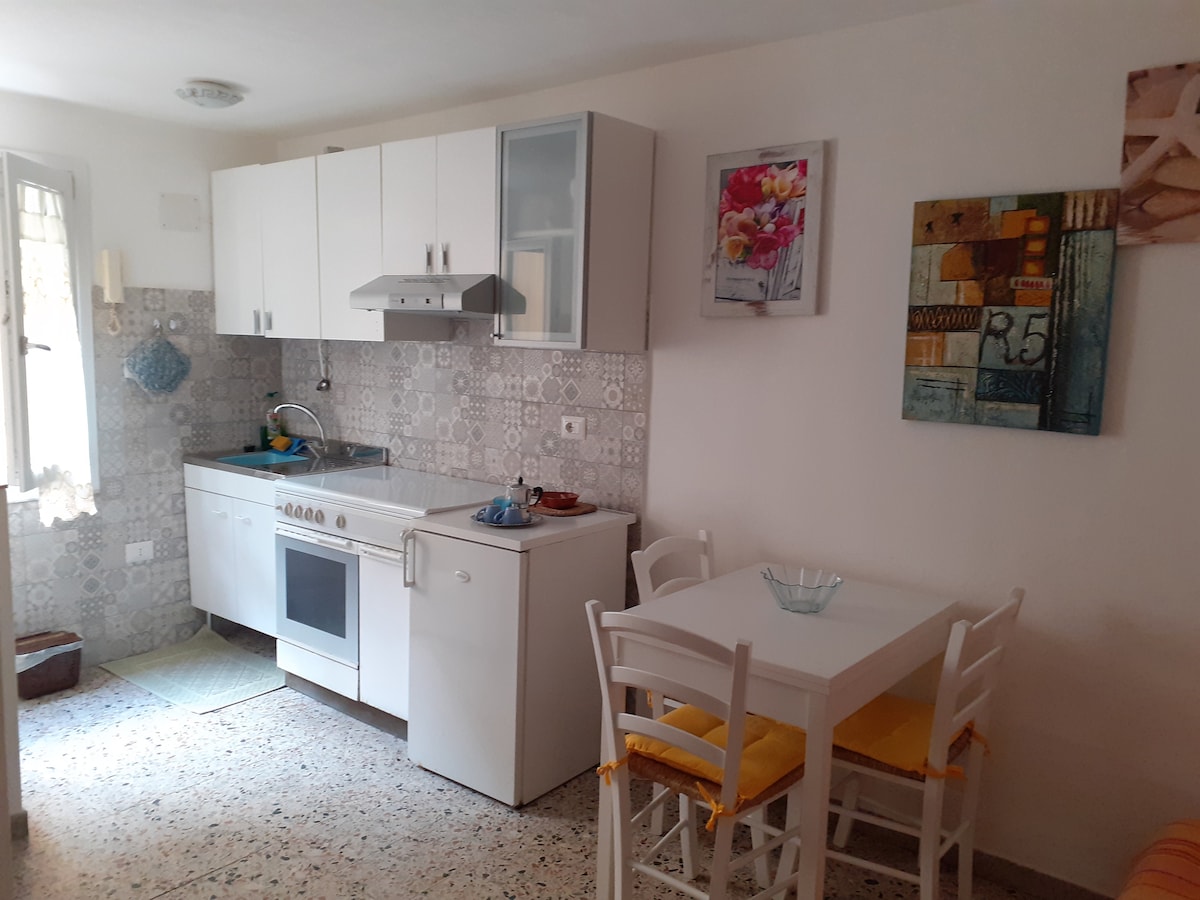
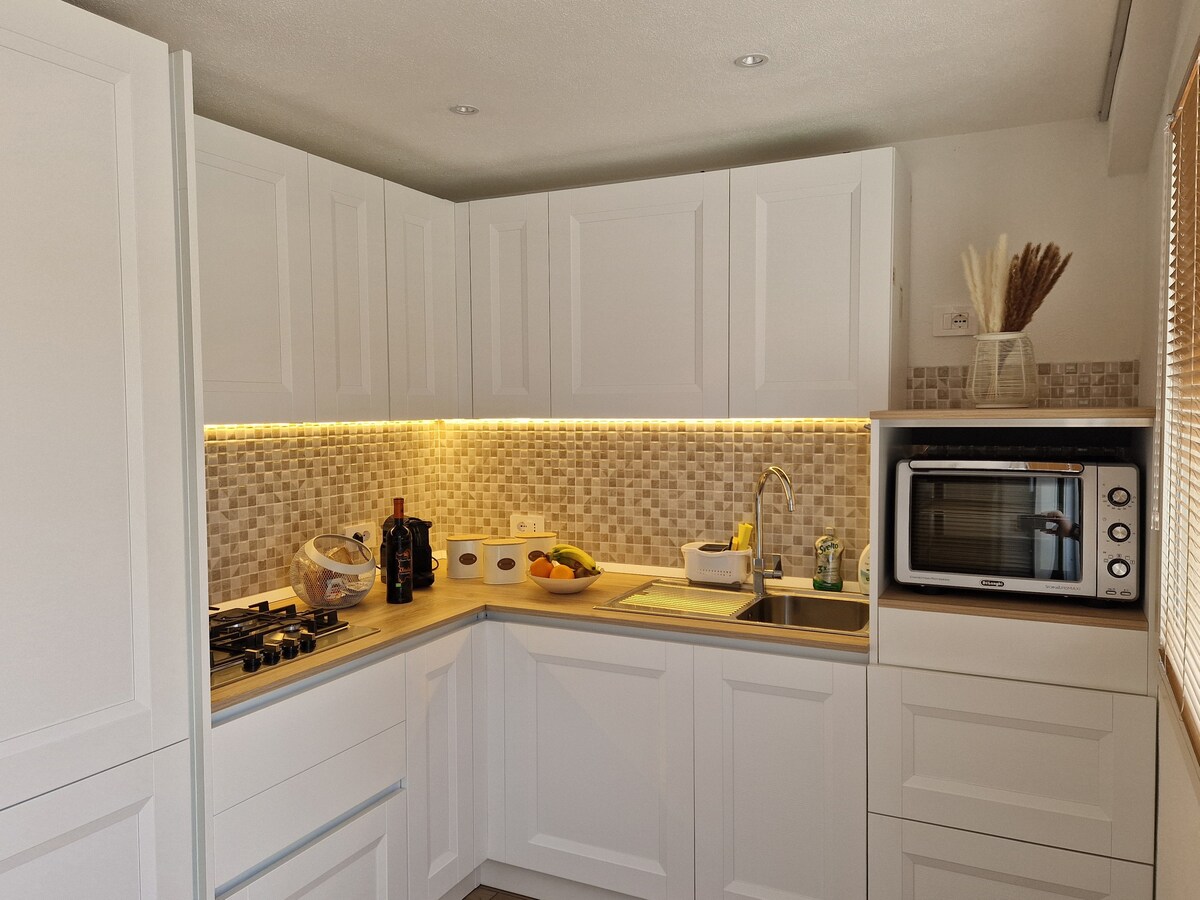
San Teodoro, a jewel of Sardinia’s northeastern coast famous for La Cinta beach and the Maldivian waters of Cala Brandinchi, is a prestigious destination merging wild nature with elegant nightlife. It is a sunny spot attracting international tourism seeking fine white sand beaches and the exclusivity of the Tavolara Marine Park. The Airbnb market is extraordinarily profitable here, featuring an occupancy rate of 64%. Visitors seek exclusive villas with gardens near the sea and the convenience of holiday homes in luxury residential neighborhoods, paying an average daily rate of €261. Its annual revenue of €61,873 positions it as an elite destination for real estate investment.
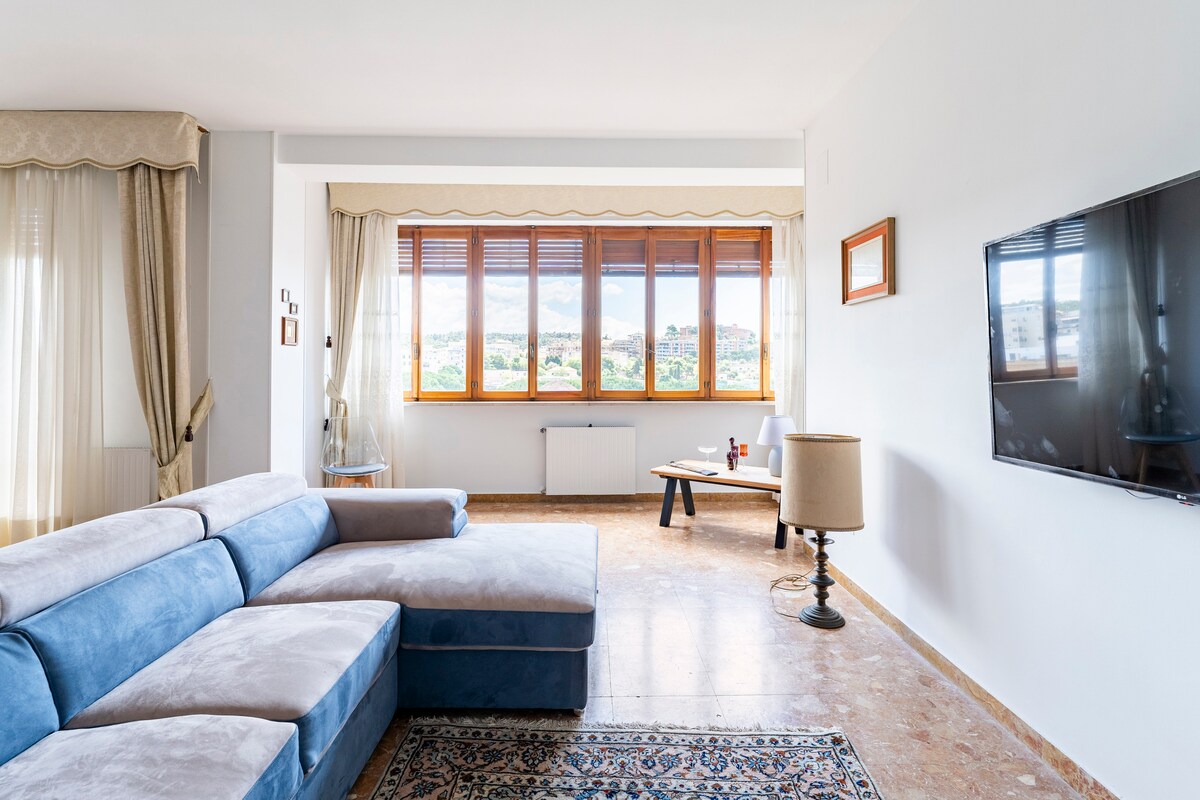
Featured Listings
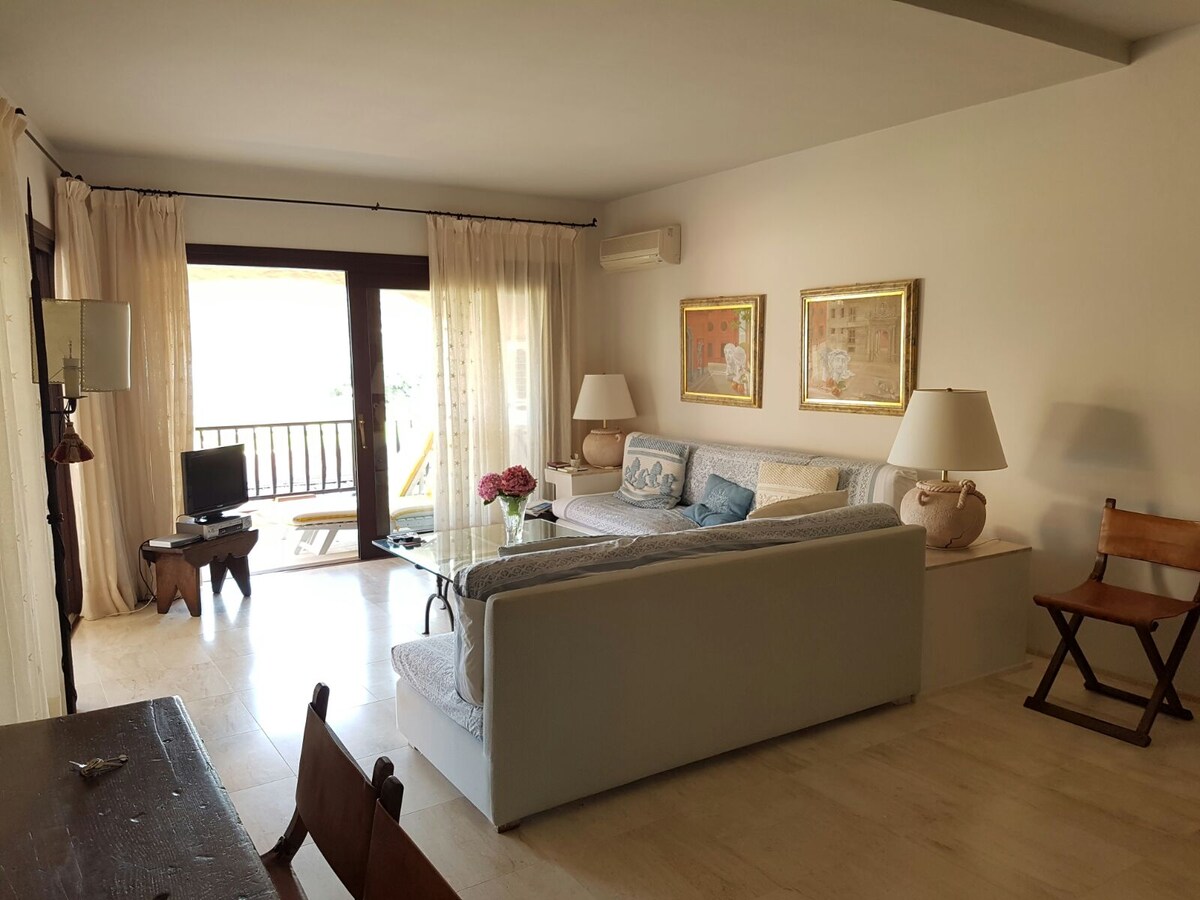
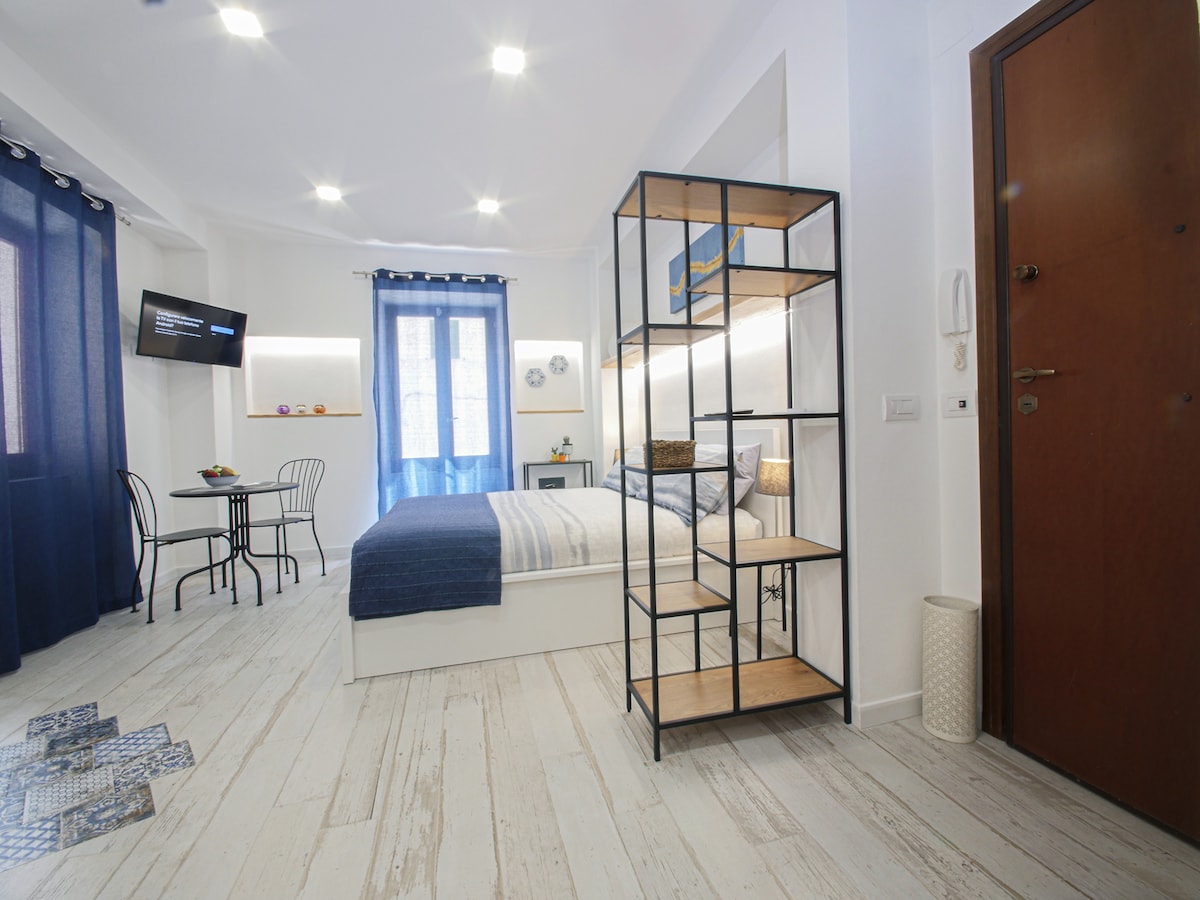
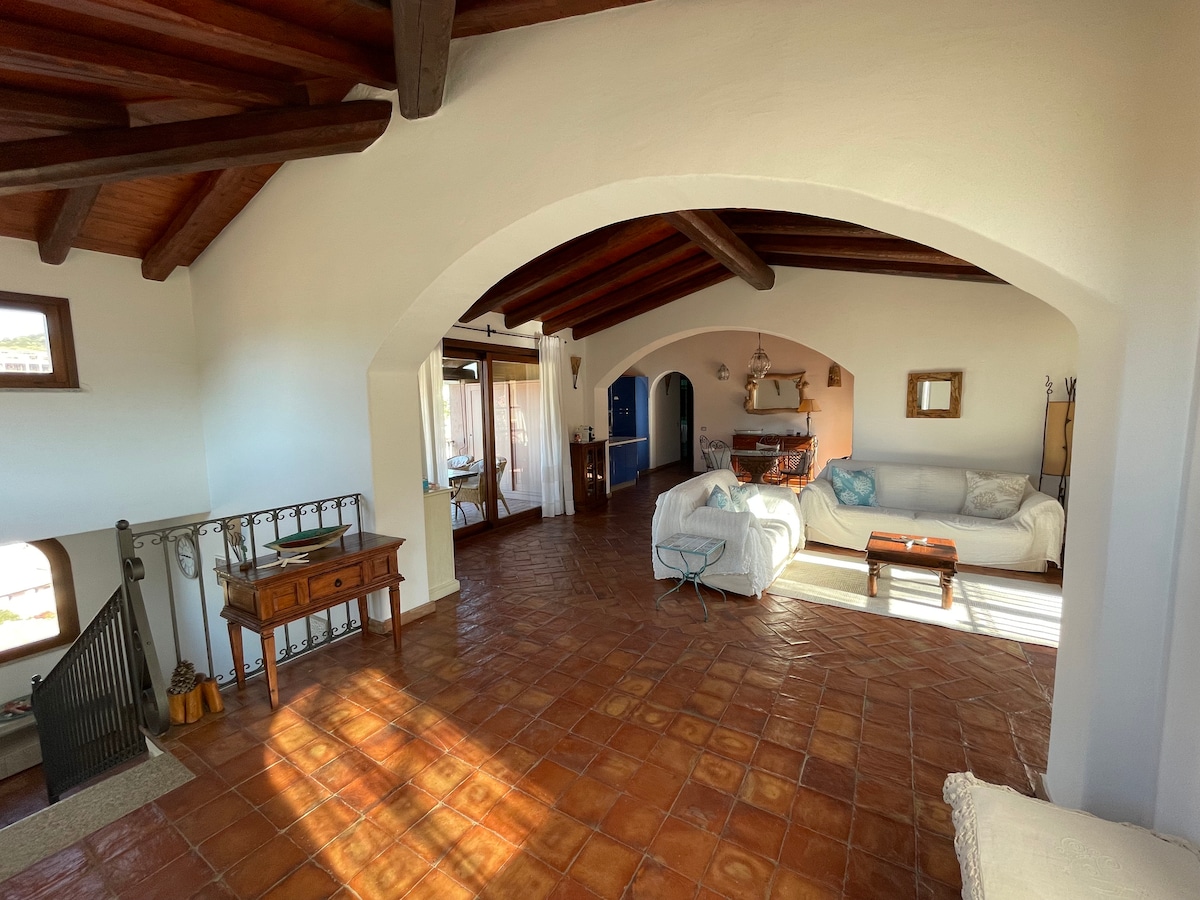
Alghero, known as Sardinia’s ‘Little Barcelona’ with its Spanish walls and Catalan roots, is a city of timeless charm famous for its red coral, Neptune’s Grottoes, and Bombarde beaches. It is a vibrant destination merging seafaring history, crystal-clear waters, and excellent dining, attracting massive international tourism year-round. The Airbnb market is extremely efficient here, featuring an occupancy rate of 61%. Visitors seek the charm of old-town apartments and the modernity of lofts near the harbor and beaches, paying an average daily rate of €161. Its annual revenue of €35,967 confirms the success of investing in this northwestern gem.
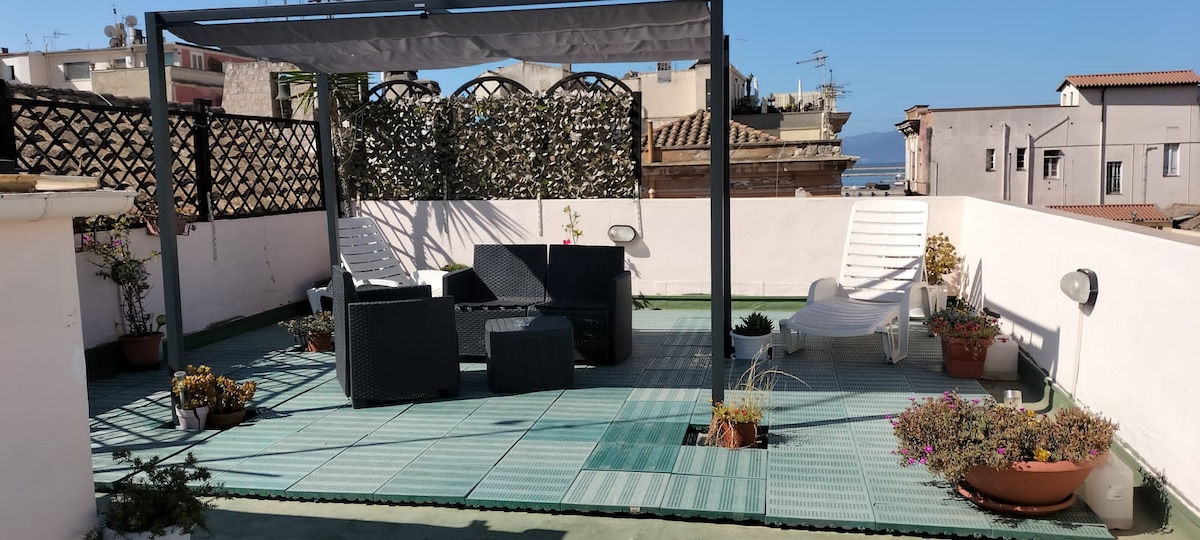
Featured Listings
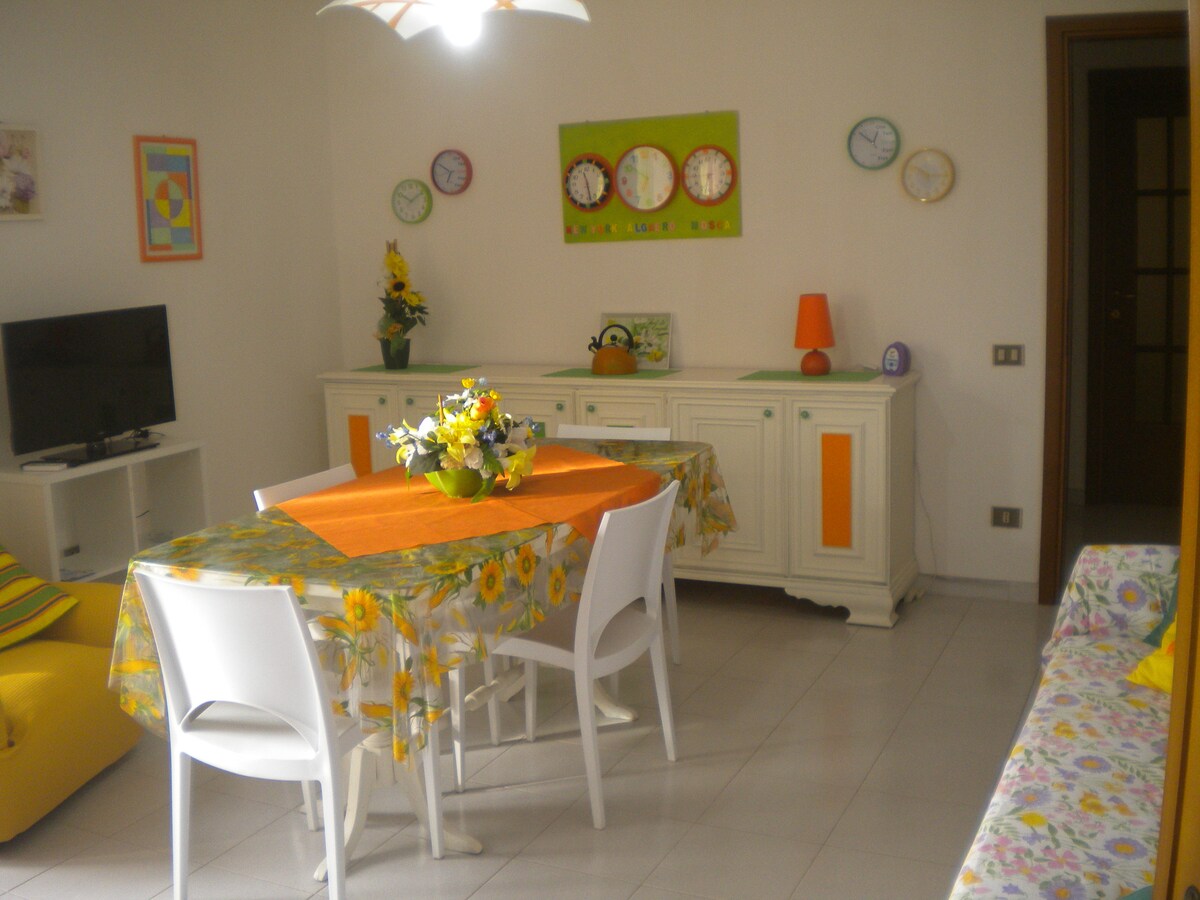
Budoni, located in a wide bay bordered by turquoise waters and lush pine forests, is a charming and prestigious destination in northeastern Sardinia famous for its white sand coves. It is a sunny spot attracting international tourism seeking relaxation, untouched nature, and the authentic hospitality of its hillside villages. The Airbnb market is very powerful here, featuring an occupancy rate of 64%. Visitors seek the exclusivity of sea-view villas and the convenience of holiday homes near the coastline, paying an average daily rate of €206. Its annual revenue of €48,850 confirms Budoni as an excellent choice for those targeting a solid and profitable seaside market.
Featured Listings
Villasimius, the jewel of southern Sardinia located within the Capo Carbonara Marine Protected Area, is a world-class prestigious destination famous for its fine white sand beaches and transparent waters. It is a sunny spot attracting elite international tourism seeking wild nature, sailing, and a refined Mediterranean atmosphere. The Airbnb market is very powerful here, featuring an occupancy rate of 64%. Visitors seek exclusive villas with pools near the coves and the convenience of elegant apartments in the vibrant village, paying an average daily rate of €192. Its annual revenue of €44,957 positions it as a top destination for real estate investment.
Featured Listings
Cagliari, the sunny capital of Sardinia stretching between its medieval castle and the miles-long Poetto beach, is a vibrant city merging millennial history, lagoon nature, and Mediterranean urban energy. Thanks to its harbor and international airport, it attracts diverse tourism interested in culture and marine life year-round. The Airbnb market is extremely efficient here, featuring an occupancy rate of 62%. Visitors seek the charm of apartments in the historic Castello and Stampace districts and the modernity of rentals near the sea, paying an average daily rate of €122. Its consistent year-round appeal ensures strong profitability for property owners throughout the year.
Featured Listings
Pula, a jewel of Sardinia’s southwestern coast famous for the Roman ruins of Nora and the prestige of its beaches bordered by ancient pine forests, is a destination of timeless enchantment. Between ancient history and the exclusivity of luxury resorts, it attracts sophisticated international tourism seeking culture, crystal-clear waters, and privacy. The Airbnb market is extraordinarily profitable here, featuring an occupancy rate of 64%. Visitors seek exclusive villas nestled in greenery and the charm of apartments in the vibrant village, paying an average daily rate of €212. Its annual revenue of €49,733 confirms Pula as an elite destination for real estate investment.
Featured Listings
Muravera, the heart of the Sarrabus region famous for its fragrant citrus groves and the untouched beaches of Costa Rei, offers a natural paradise of rare beauty in southeastern Sardinia. It is a charming destination attracting international tourism seeking relaxation, turquoise sea, and authentic Sardinian hospitality in a wild landscape. The Airbnb market is very powerful here, featuring an occupancy rate of 64%. Visitors seek exclusive sea-view villas and the convenience of holiday homes nestled in Mediterranean scrub, paying an average daily rate of €191. Its annual revenue of €44,983 positions it as a premier destination for seaside profitability.
Featured Listings
Golfo Aranci, nestled between the Capo Figari promontory and emerald waters, is a prestigious destination in northeastern Sardinia famous for its paradisiacal coves and dolphin sightings. It is a sunny spot attracting elite international tourism seeking untouched nature, sailing, and a refined Mediterranean atmosphere. The Airbnb market is extraordinarily efficient here, featuring an occupancy rate of 66%. Visitors seek exclusive beachfront villas and the charm of elegant apartments in the fishing village, paying an average daily rate of €232. Its annual revenue of €56,049 ensures profitability at the top of the Sardinian market rankings.
Featured Listings
Get Live Sardegna, Italy Market Intelligence
Discover detailed Sardegna, Italy Airbnb Analytics and explore real-time market data to make accurate investment decisions.
Explore Real-time Analytics