Airbnb Occupancy Rates in Palermo, Sicilia(June 2026)
- Annual revenue:€22,138 per listing
- Occupancy:61%
- ADR:€100 per night
- Active listings:5,146 (as of June 2026)
Palermo is Sicily’s capital and busiest short-stay hub: Arab-Norman palazzi, Ballarò and Vucciria street food, Mondello beach runs, and PMO airport feeds that keep shoulder seasons from collapsing like pure resort towns. Citywide averages blend centro storico walk-ups, Kalsa and La Cala waterfront stock, and hillside homes toward Monreale or the coast.
Investors who treat Palermo as “cheap Naples with less compliance” often misprice cruise-and-ferry weekends, underestimate L.R. 6/2025 + CIN + IDS workflows, or buy where ZTL access and parking friction erode reviews. The opportunity is scale and airport liquidity on the island—not automatic baroque premiums without operational fit.
Palermo Airbnb Market Map (June 2026)
Palermo Market Performance
Period: June 2025 - May 2026
Is Airbnb a Good Investment in Palermo?
YES — Palermo fits investors who want Sicily’s deepest Airbnb inventory and repeatable port-and-airport demand, provided you complete SUAP communication, regional CIR, national CIN, and Palermo tourist-tax reporting before you scale.
Who should invest
- Operators underwriting Sicily’s largest listing pool who can compete on occupancy and compliant scale rather than chasing Siracusa-style headline revenue on a smaller base.
- Hosts targeting cruise, ferry, and PMO transfer nights with clear parking or tram guidance and honest centro access disclosures.
- Buyers who want west-Sicily road-trip positioning (Cefalù, Trapani, Agrigento day trips) on two- to four-night city breaks.
- Teams comfortable with procedural compliance—SUAP receipt, CIR, CIN, Alloggiati Web, quarterly imposta di soggiorno on the municipal IDS portal—not a national night cap.
Who should skip
- Investors expecting per-listing revenue to match Napoli without modelling Palermo’s lower citywide ADR and review volatility in dense historic fabric.
- Hosts unwilling to file Allegato B / SCIA paths and maintain CIN display before marketing—Sicily enforcement is register-driven, not informal.
- Purchases that assume Mondello beach ADR on centro stock without AC, moisture control, or realistic summer heat management.
- Portfolios that need northern-Italy corporate ADR; compare Milano or Roma before anchoring yield expectations on Palermo alone.
| City | Avg revenue | Occupancy | Listings |
|---|---|---|---|
| Palermo | €22,138 | 61% | 5,146 |
| Catania | €18,501 | 59% | 2,937 |
| Siracusa | €30,627 | 58% | 2,740 |
| Napoli | €25,680 | 60% | 5,957 |
Siracusa (€30,627, 58%) often posts higher averages on fewer listings—especially Ortigia premiums—while Catania (€18,501, 59%) competes on Etna and CTA airport positioning with a smaller pool. Napoli (€25,680, 60%) is the Tyrrhenian benchmark when you are choosing between Campania and Sicily hubs; compliance diverges (Campania CUSR/GEIS vs Sicily’s CIR + IDS stack).
Get Live Palermo Market Intelligence
Discover detailed Palermo Airbnb Analytics and explore real-time market data to make accurate investment decisions.
Explore Real-time Analytics
How Often Will Your Airbnb Be Booked in Palermo?
View Demand Patterns →Occupancy rates directly impact your revenue potential. Understanding demand patterns helps you set realistic expectations and optimize your availability strategy.
The current average occupancy rate in Palermo is 61%, meaning properties are booked for about 221 nights per year. However, occupancy varies significantly based on property quality and management. Here's what you can expect:
Airbnb Occupancy Tiers in Palermo
Premium(Top 10%) | High-performing(Top 25%) | Average(Median) | Low-performing(Bottom 25%) |
|---|---|---|---|
| 88% | 73% | 51% | 25% |
*High desirability & optimized availability | *Good market fit & guest satisfaction | *Standard market performance | *Higher vacancy, optimization needed |
Seasonal Occupancy Patterns in Palermo
August, April
Highest demand and occupancy rates. Perfect for premium pricing strategies and maximizing revenue. Consider longer minimum stays and higher rates.
February, March
Moderate demand with balanced pricing opportunities. Good for attracting budget-conscious travelers while maintaining reasonable occupancy rates.
December, November
Lower demand requires competitive pricing and creative marketing. Focus on local events, extended stay discounts, and targeting specific traveler segments.
How Much Can You Earn with Airbnb in Palermo?
Calculate Earnings →One of the most common questions for potential Airbnb hosts in Palermo is about earning potential. Let's break down the revenue patterns and what you can realistically expect to earn.
Monthly Revenue Trends in Palermo
Best-in-class Airbnb properties (top 10%) in Palermo achieve around €32,084 annually, while strong performers (top 25%) earn at least €20,766. Typical properties generate about €12,544 per year, and entry-level listings (bottom 25%) see earnings near €5,600, often with room for optimization. Keep in mind, these are market averages—your actual earnings can be even higher depending on your property's location, bedrooms, guest capacity, and unique amenities.
Want to see how your listing could perform? Create a free account to unlock personalized analytics and explore exclusive insights in our app!
What Can You Learn from Top-Performing Airbnbs in Palermo?
View Top Performers →Studying successful properties provides valuable insights for your own Airbnb strategy. Here are the top-performing listings in Palermo and what makes them successful.
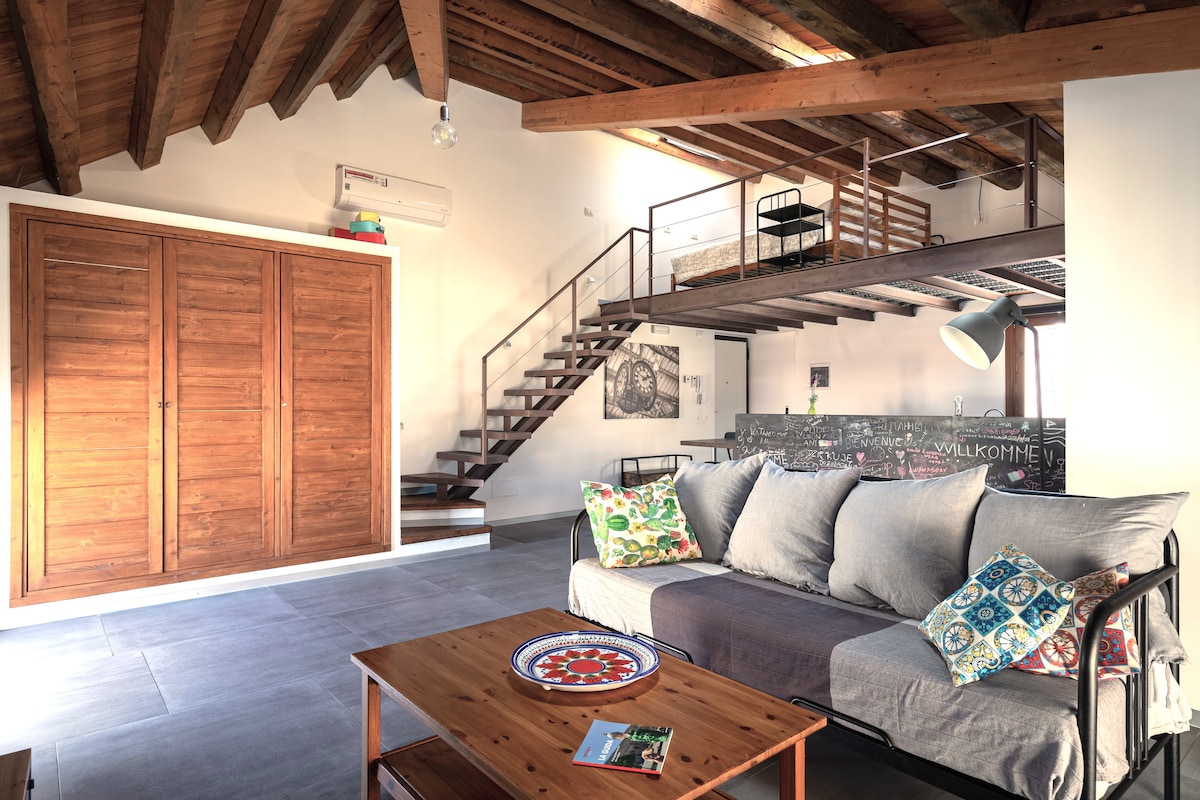
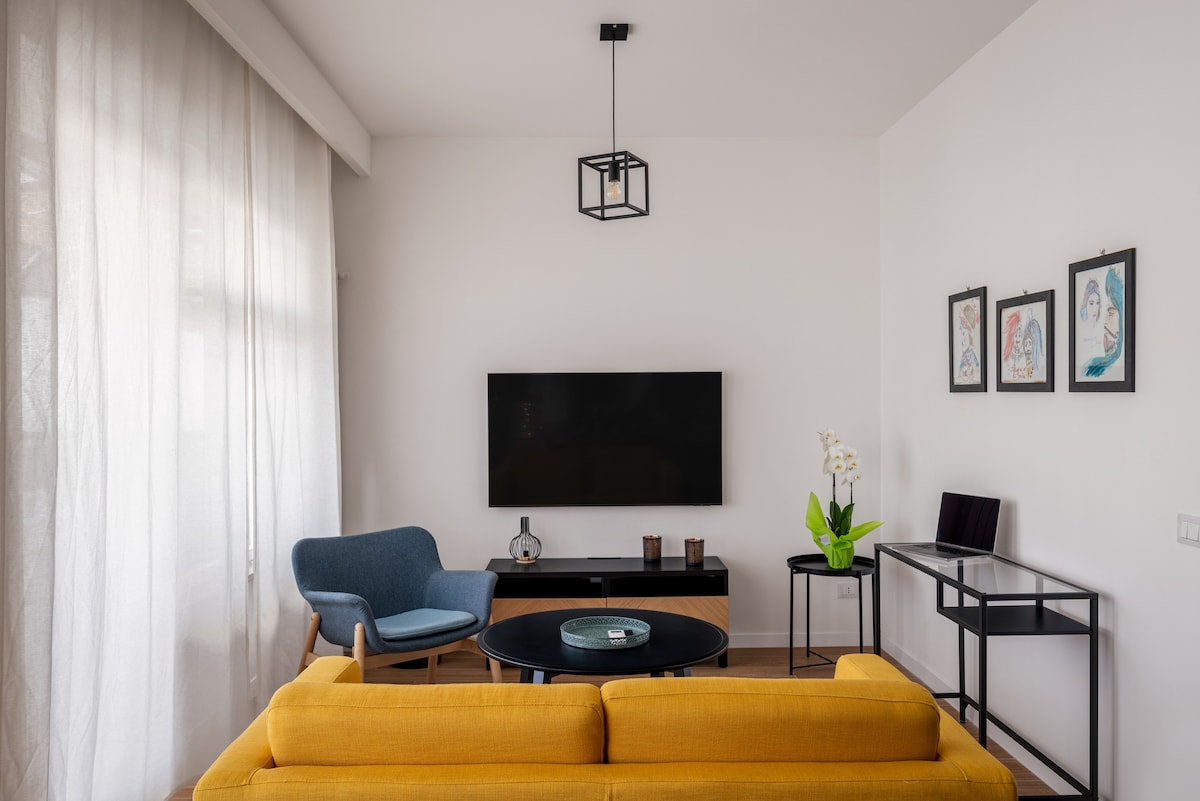
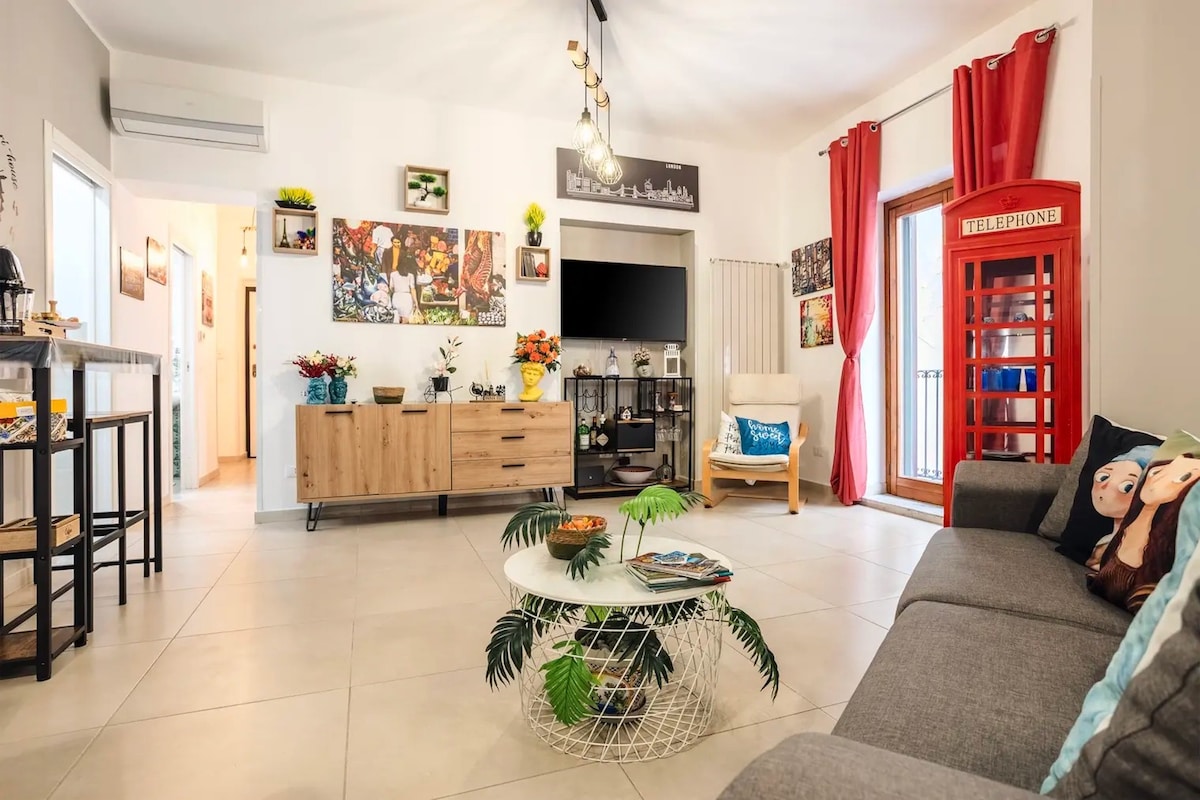
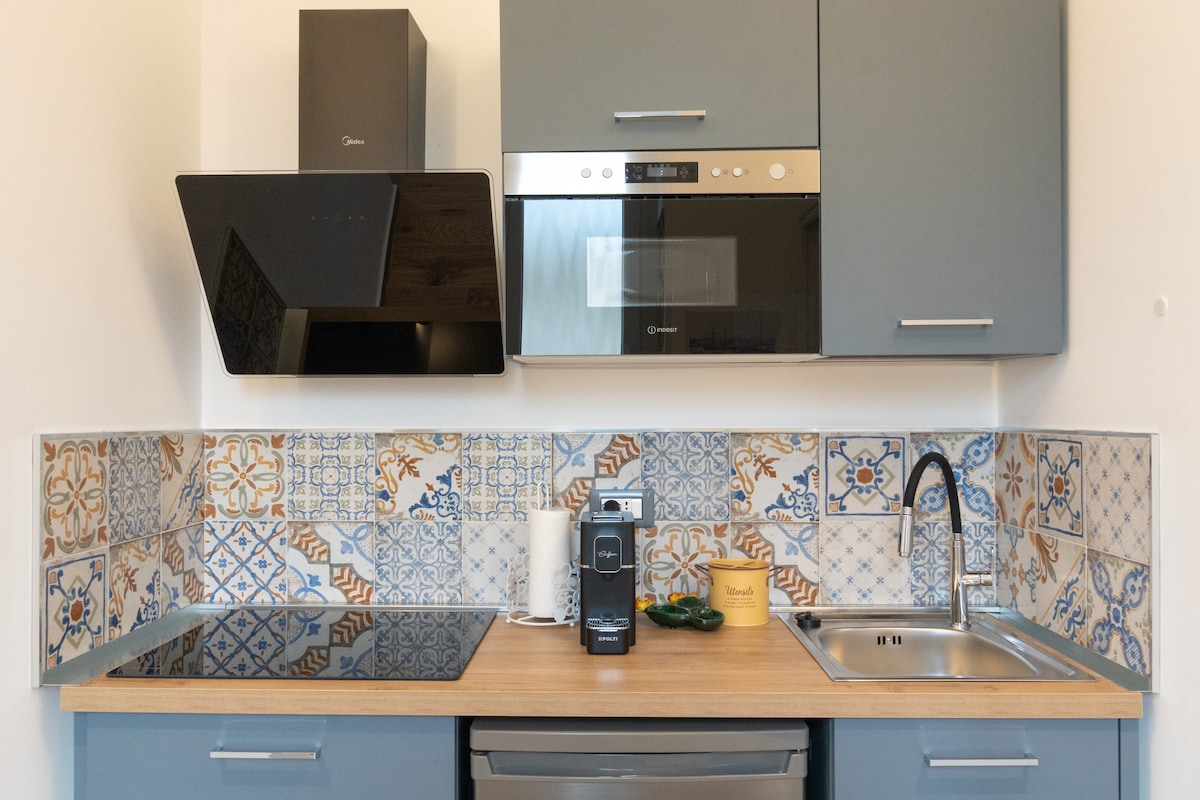
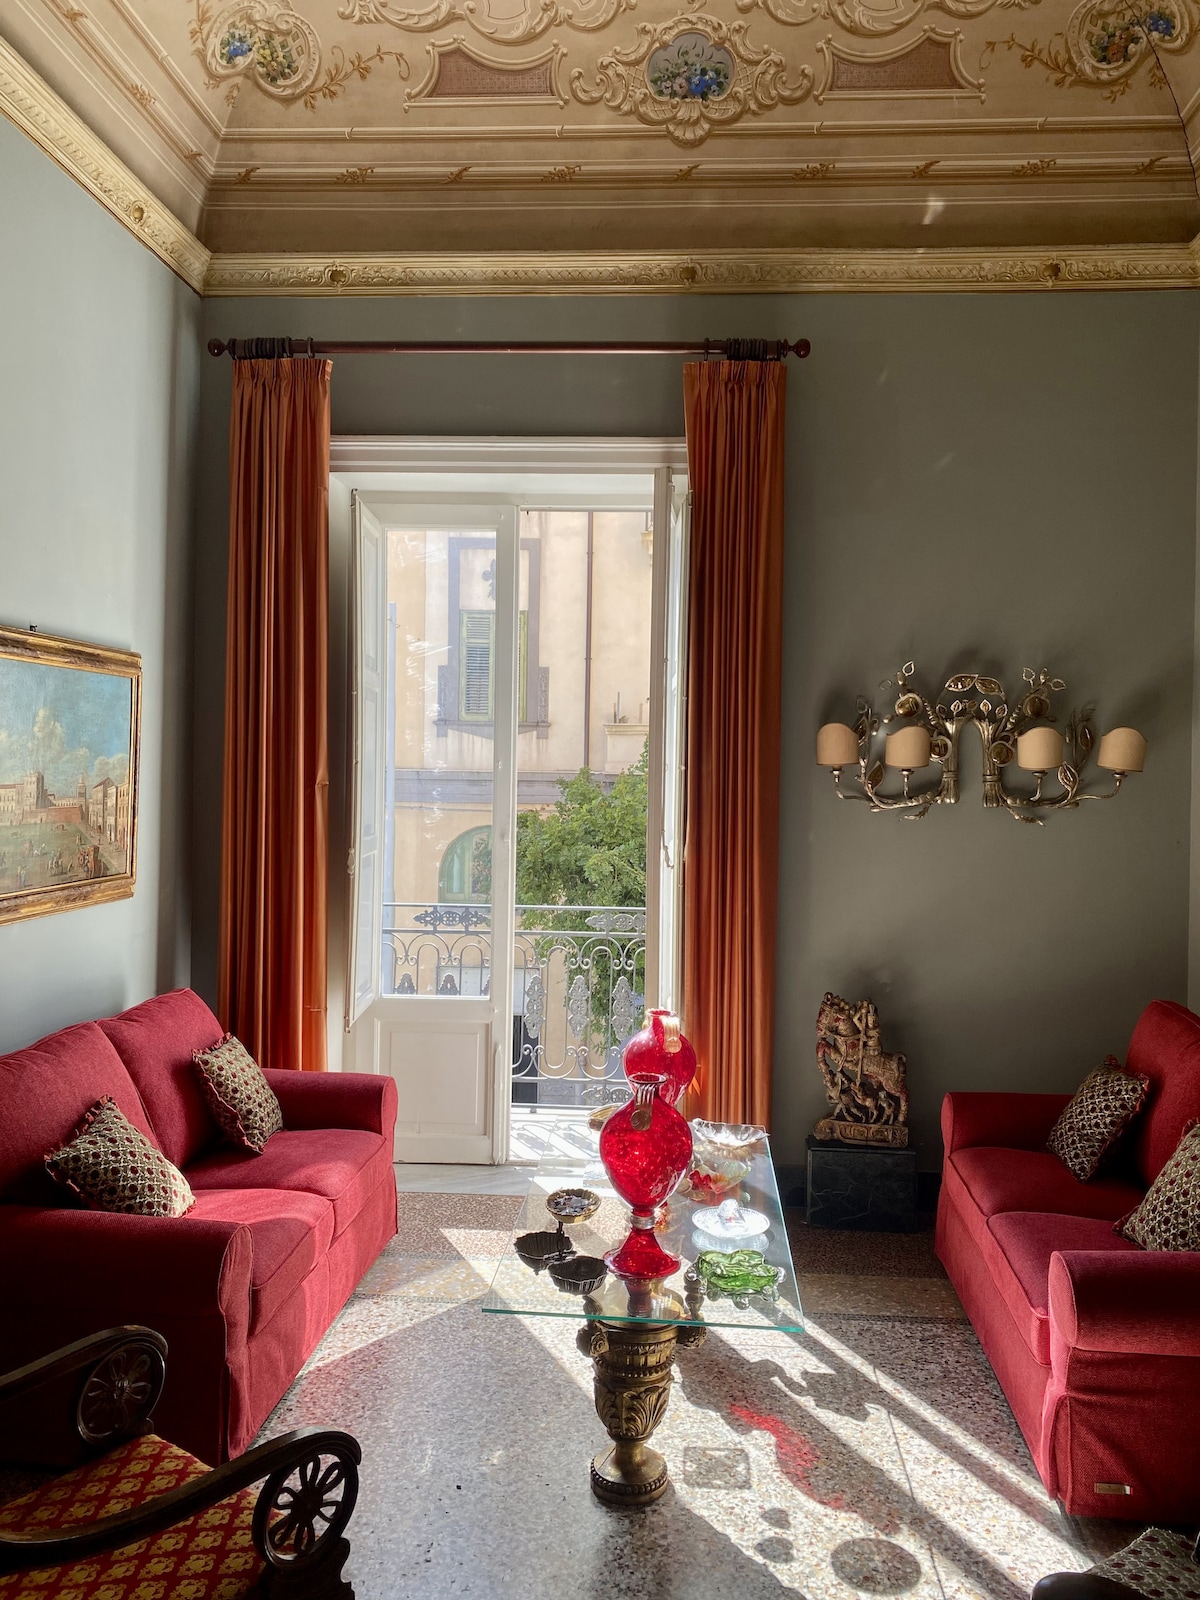
![Popular Airbnb listing: [Palermo Center] - The Domes of the Felicissima in Palermo](https://a0.muscache.com/im/pictures/miso/Hosting-1456660590929425322/original/753cd5b1-cf9b-4264-b6e0-425adef9f18b.jpeg)
Palermo Market Analysis
Cruise, ferry, and airport-stop guests
Turnaround traffic around Porto di Palermo, ferry links, and Falcone–Borsellino (PMO) supports one- to three-night buffers before west-Sicily drives or late arrivals. These guests prioritise luggage-friendly access, reliable Wi‑Fi, and clear ZTL or parking instructions over postcard piazza views alone. Pricing should separate ship-calendar spikes from ordinary autumn city breaks—generic summer markups miss how concentrated port demand can be on specific weeks.
Street-food city breakers and culture weekends
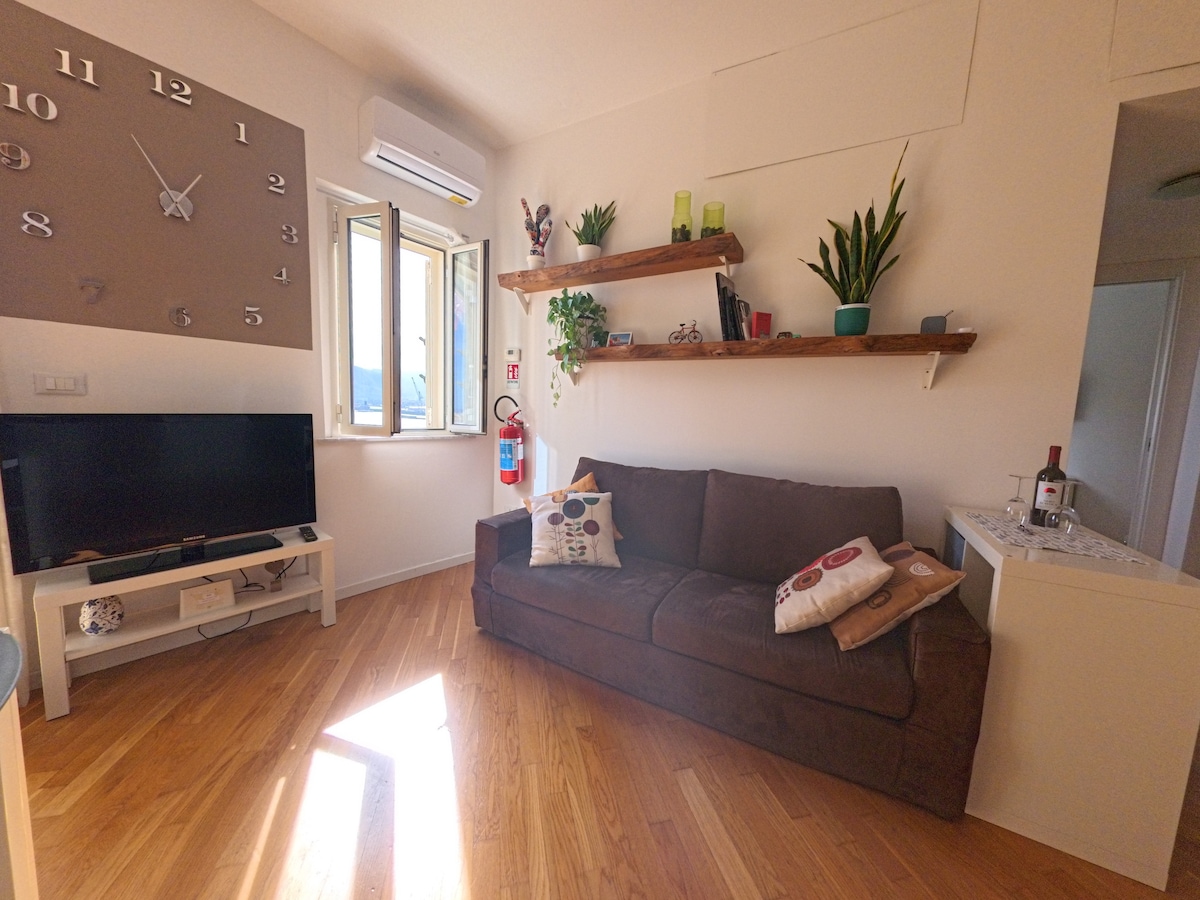
International and Italian guests book for Quattro Canti, Cathedral and Palazzo dei Normanni, markets, and evening passeggiate through Kalsa and La Cala. Stays skew two to four nights—longer when the listing is marketed as a hub for Monreale, Cefalù, or interior archaeology loops. Compact one- and two-bedroom flats with AC, dehumidification, and honest stair disclosures outperform trophy centro walk-ups that hide summer heat or night noise.
West Sicily and coast road-trippers
Families and couples use Palermo as a base for Mondello, Cefalù, Scopello, and Trapani–Erice itineraries rather than as a single-neighbourhood resort. Stock with parking or fast tram links can capture longer shoulder-season stays when guests rent cars; pure centro units win on walkability but must disclose beach transfer time honestly. Compare your calendar with Catania Etna excursions and Siracusa Val di Noto positioning—Palermo’s persona mix is capital-city logistics plus street food, not only Ionian baroque archaeology.
What Are the Airbnb Regulations in Palermo?
Understanding local regulations is crucial for operating a successful Airbnb. Let's examine the compliance landscape and what you need to know about licensing requirements in Palermo.
Current Regulatory Status
73% compliance indicates strict regulatory enforcement in this market.
Comune di Palermo
Start on the municipal imposta di soggiorno pages and register hosts on the IDS portal before scaling. Short-let operators typically need a SUAP receipt for alloggi locati per finalità turistiche—file the regional comunicazione di inizio attività (Allegato B under D.A. 2104/2025) or SCIA when activity is business-like or spans three or more units—via SUAP Impresa in un giorno (Comune G273). Collect imposta di soggiorno from qualifying non-resident guests (municipal rules cap consecutive taxed nights—see the regolamento PDF and locazioni brevi duties PDF); declare and remit on quarterly IDS schedules. Register guest stays on Alloggiati Web within 24 hours of check-in.
National rules (Italy)
Locazione breve contracts are capped at 30 days per stay; Italy does not apply a uniform national annual night limit like France or Spain. CIN is mandatory on BDSR and must appear on every platform listing and at the property entrance, with safety hardware tied to issuance (Ministry BDSR FAQ). From 2026, many private hosts use cedolare secca on at most two apartments before crossing into business taxation (Agenzia delle Entrate — locazioni brevi). Renting three or more units as short-term or tourist lets generally requires SCIA at SUAP and business tax treatment under art. 13-ter, L. 191/2023.
Sicily regional layer
L.R. 6/2025 reorganises tourist accommodation and locazioni turistiche; implementing D.A. 2104/2025 sets minimum safety (gas/CO detection, portable extinguishers) and the Allegato B communication model for non-business hosts (Regione Siciliana decree page, Allegato B PDF). After municipal filing, register CIR on Sicily’s tourism observatory (osservatorio turistico) before requesting CIN. Non-entrepreneurial operators may run up to four units under current regional guidance—confirm on Assessorato Turismo pages before expanding.
Further reading: Normattiva — L. 191/2023 (CIN), Comune SUAP transparency — control procedures, and UO imposta di soggiorno contacts.
How Competitive is the Airbnb Market in Palermo?
Analyze Competition →Understanding market competition is crucial for any potential Airbnb host. Let's examine the supply dynamics and what they mean for your investment strategy. The Palermo Airbnb market currently features 5,146 active listings with an average occupancy rate of 61%. This represents a highly competitive market environment where strong demand supports premium pricing.
Airbnb Listings: Change Over Time
Strategic Entry into Palermo Airbnb Market
Competitive Positioning
- Target premium segment with high-quality amenities
- Emphasize unique features and exceptional service
- Focus on value-for-money positioning
Market Opportunities
- Strong demand supports premium pricing strategies
- Stable market provides predictable investment returns
- Established market with proven demand patterns
What Should You Charge for Your Airbnb in Palermo?
Smart Pricing Tools →Pricing is one of the most critical decisions for Airbnb success. Let's analyze the current pricing landscape and help you understand what rates you can realistically charge.
The current average daily rate in Palermo is €100 per night. However, pricing varies significantly based on property quality and location. Here's what different property tiers typically charge:
Airbnb Pricing Tiers in Palermo
Premium(Top 10%) | High-performing(Top 25%) | Average(Median) | Budget(Bottom 25%) |
|---|---|---|---|
| €150per night | €101per night | €71per night | €34per night |
*Top locations, big properties, premium amenities | *Good property management, highly rated | *Standard market performance | *Basic properties, less desirable locations |
Is It Profitable to Start an Airbnb in Palermo?
Investment Analysis →Understanding the profitability potential is crucial for any Airbnb investment decision. Let's analyze the revenue performance and profit margins in the Palermo market to help you make informed financial decisions.