Best Airbnb Markets in Piemonte, Italy
Maximizing your returns in Piemonte, Italy depends on choosing the right location with proven demand. We have carefully reviewed the top 10 markets to help you spot emerging trends and high-performing zones for your Airbnb portfolio.
While this data gives you a solid market-wide perspective, successful investing requires property-specific due diligence. For the most accurate filters, occupancy heatmaps, and revenue breakdowns, use GuestFavorites.
Piemonte Airbnb Market Map (June 2026)
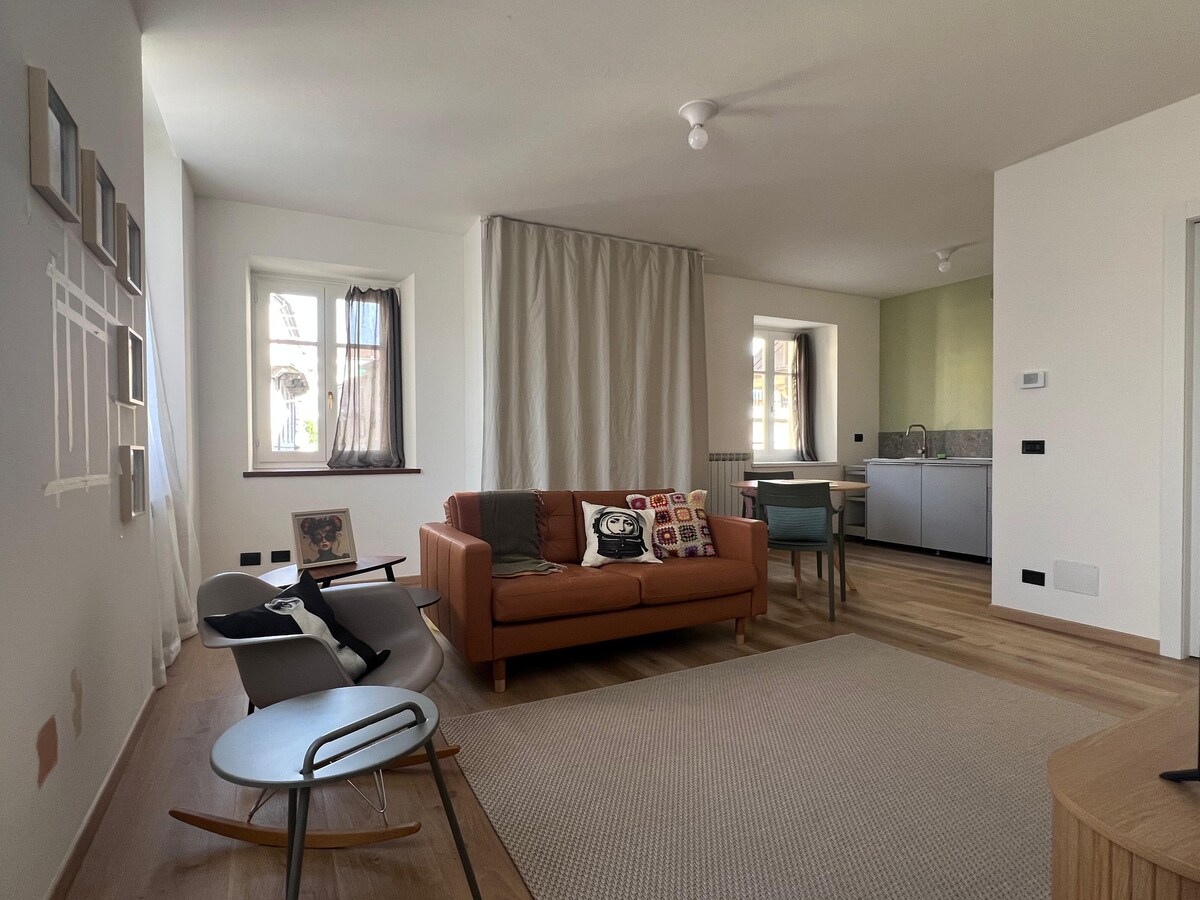
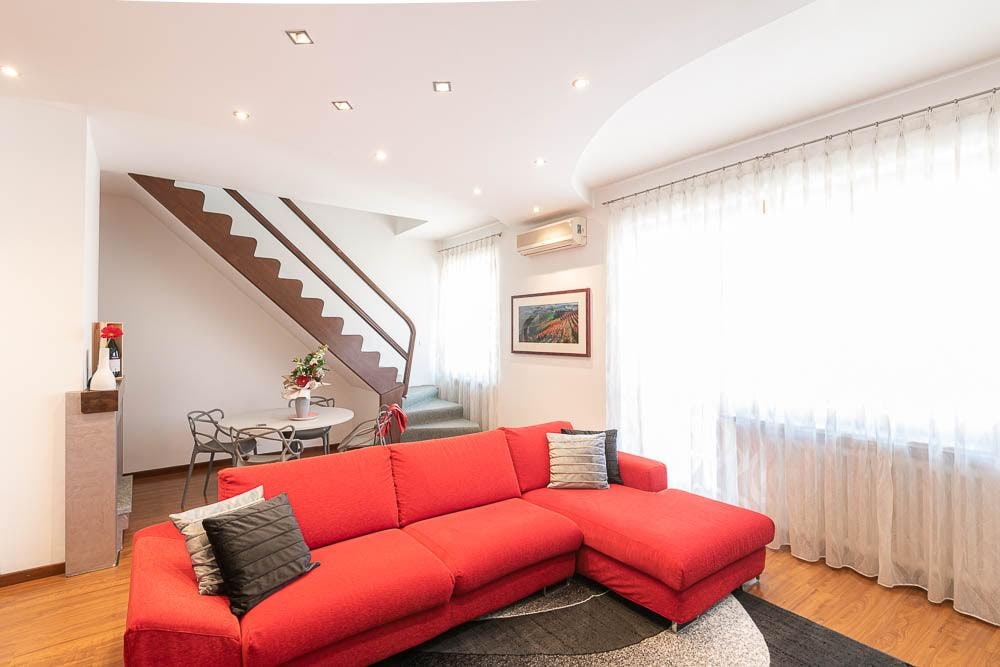
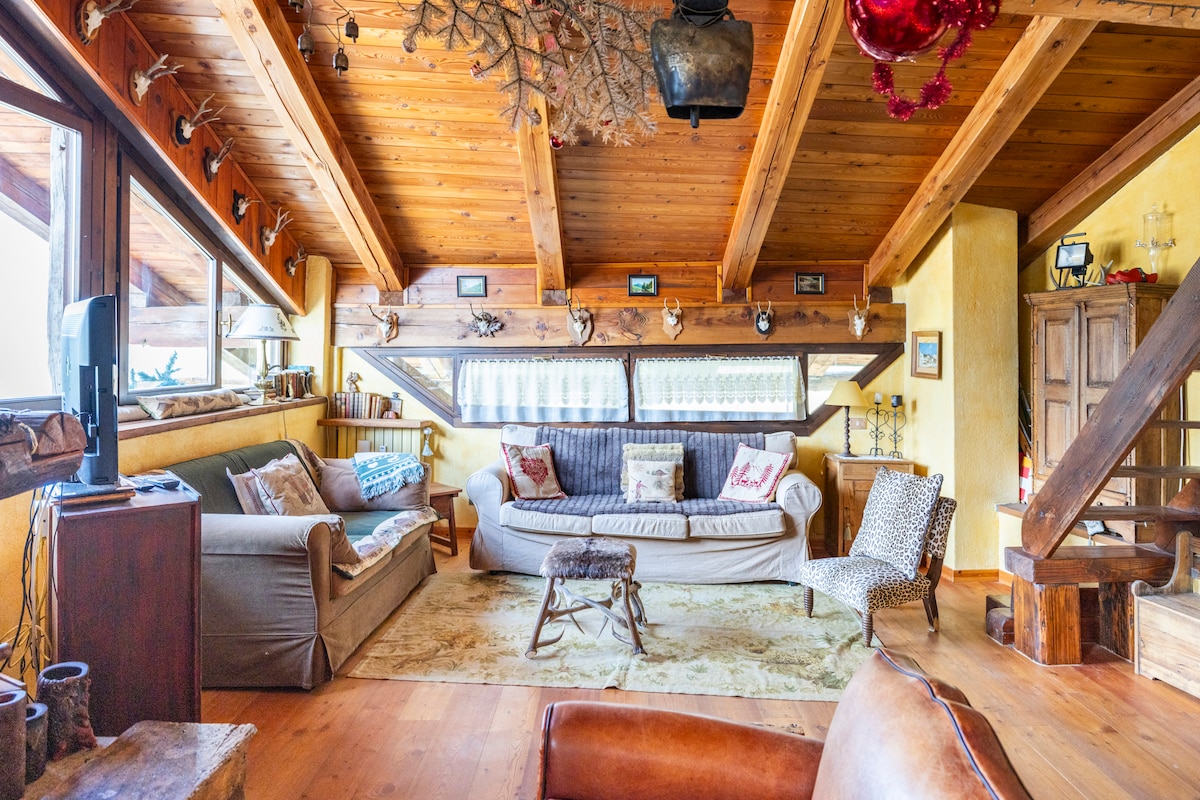
Turin, Italy’s first capital, is a stately and avant-garde city famous for its Savoy heritage, historic cafes, and the Egyptian Museum. It is a premier cultural and industrial hub attracting a mix of business and art tourism year-round. The Airbnb market is very solid here, featuring an occupancy rate of 59%. Visitors seek the charm of apartments in historic downtown palaces or modernity in emerging districts like San Salvario, generating an annual revenue of €20,865. Its cultural energy and major international events ensure consistent profitability.
Featured Listings
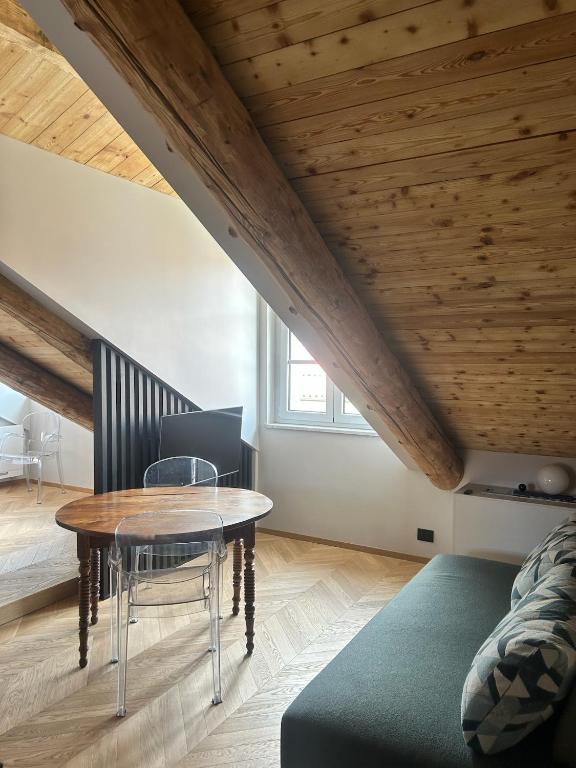
![Successful Airbnb property: [Turin, Center] Residence Cloud 9 + Garage in Torino](https://a0.muscache.com/im/pictures/airflow/Hosting-1094316987049582879/original/f62092db-0441-4e88-bc4e-e6ea5470b60a.jpg)
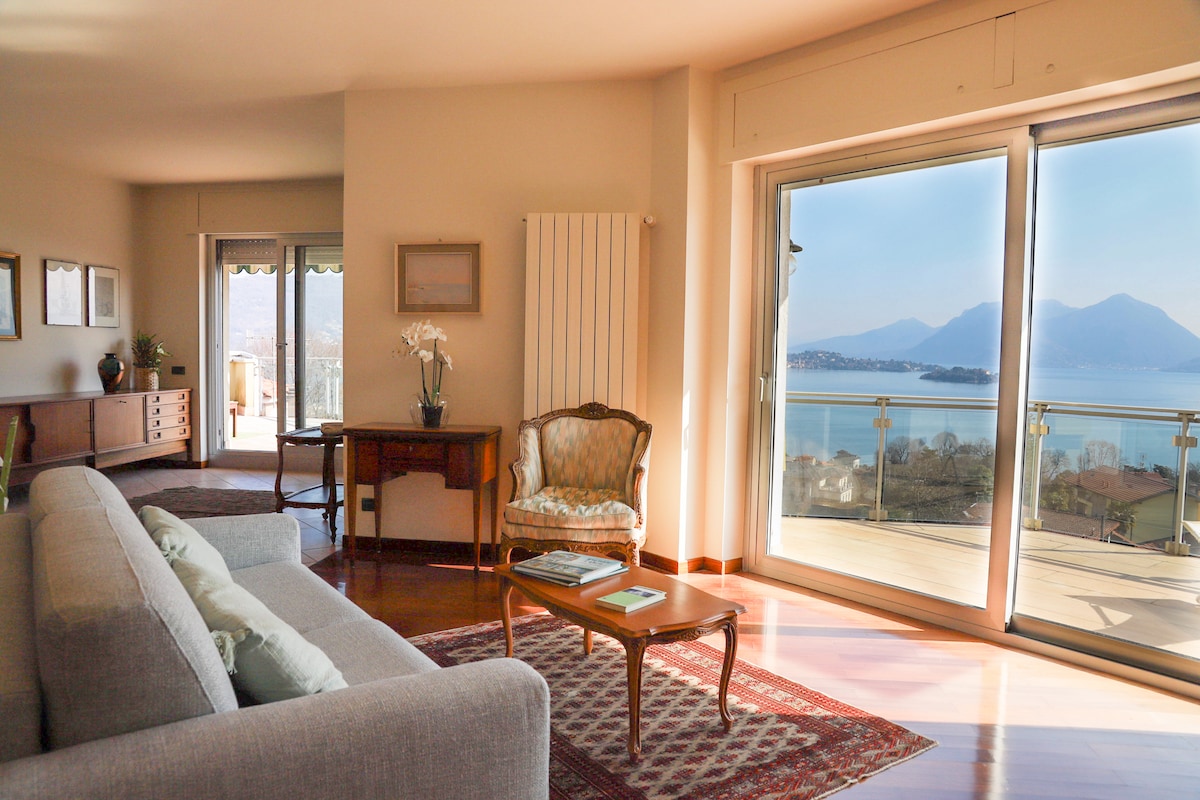
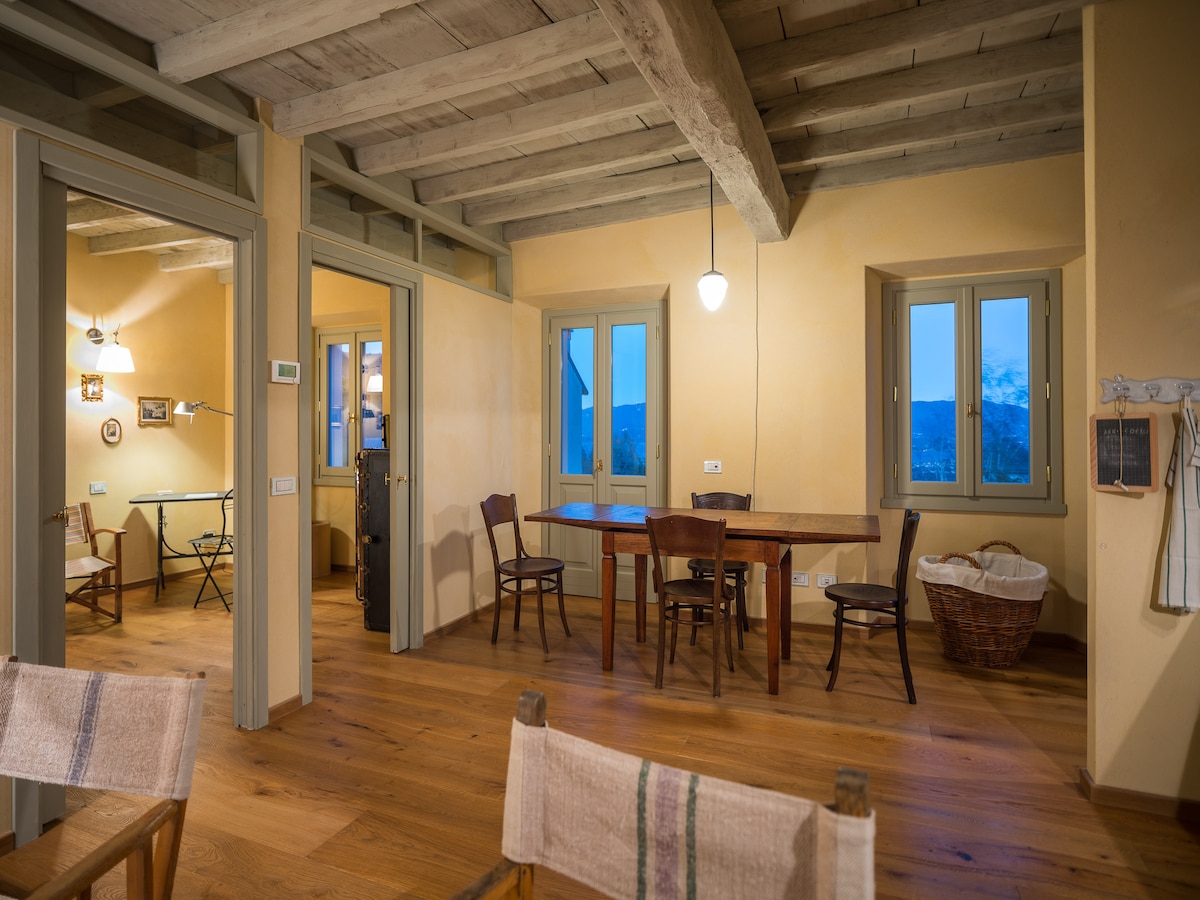
Stresa, the ‘Queen of Lake Maggiore’, is an internationally prestigious destination famous for the Borromean Islands and its luxurious Art Nouveau villas. It is an elite market attracting an international clientele seeking elegance and breathtaking panoramas. The rental market is highly profitable here, featuring an average daily rate of €177. Visitors seek high-end apartments with lake views or historic residences, generating an exceptional annual revenue of €37,322. Its reputation for absolute exclusivity and unique natural setting ensure high-level demand and a safe investment in the luxury sector.
Featured Listings

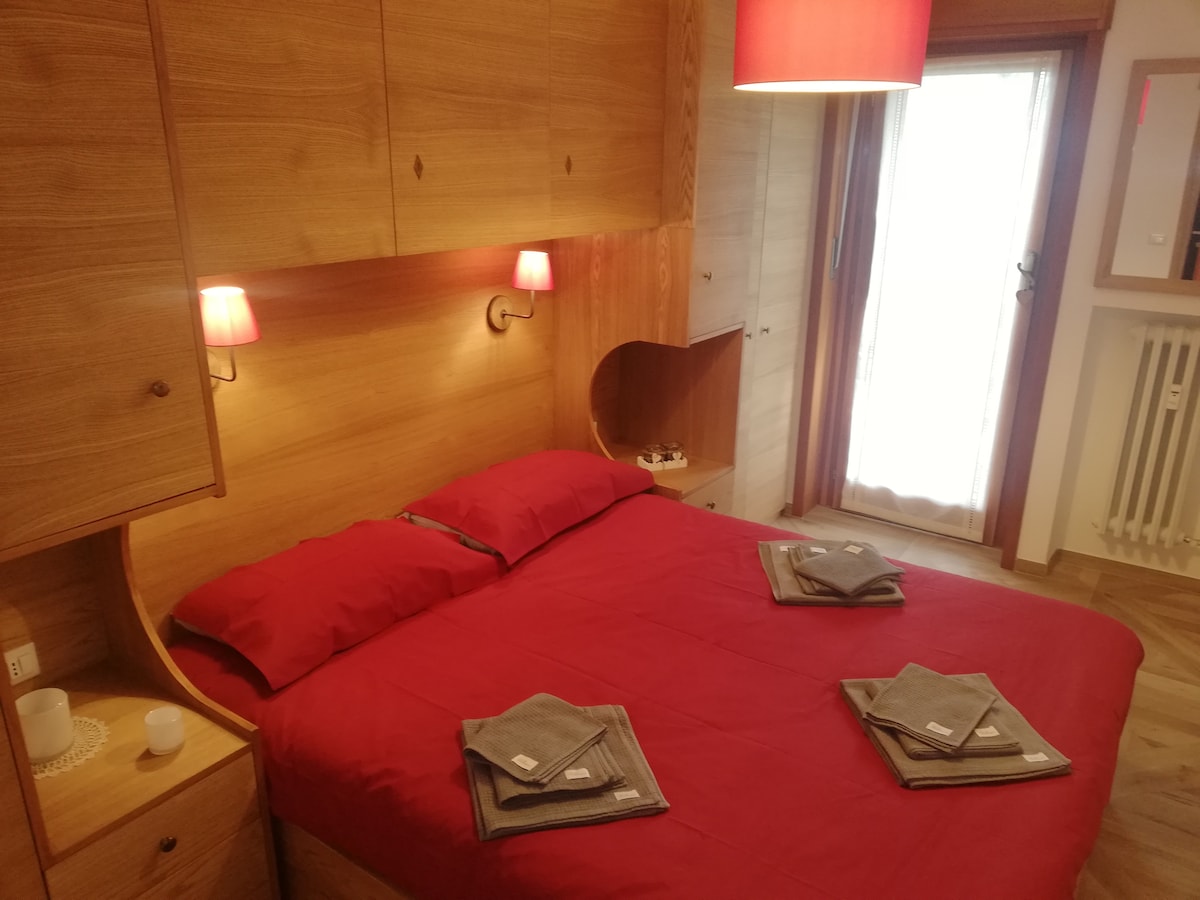
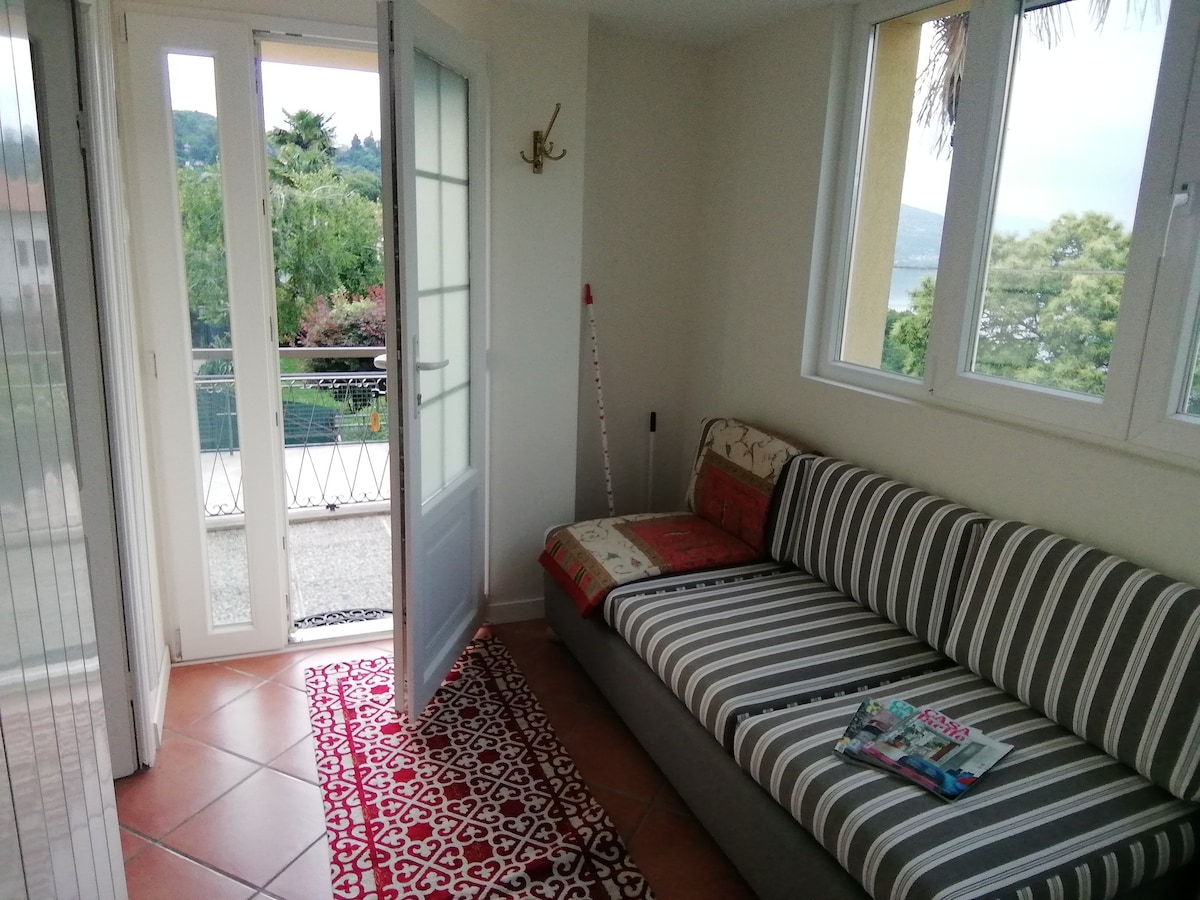
Verbania, known as the ‘Garden on the Lake’, offers an atmosphere of peace and unique beauty thanks to the famous gardens of Villa Taranto and spectacular Alpine views. It is a destination merging nature, culture, and relaxation, attracting travelers seeking authenticity and lakeside landscapes. The rental market is solid here, featuring an occupancy rate of 55%. Visitors appreciate apartments with lake-view balconies and holiday homes in historic districts, generating an annual revenue of €26,068. Its tranquility and green spaces make it a benchmark for family relaxation and high-quality international tourism.
Featured Listings
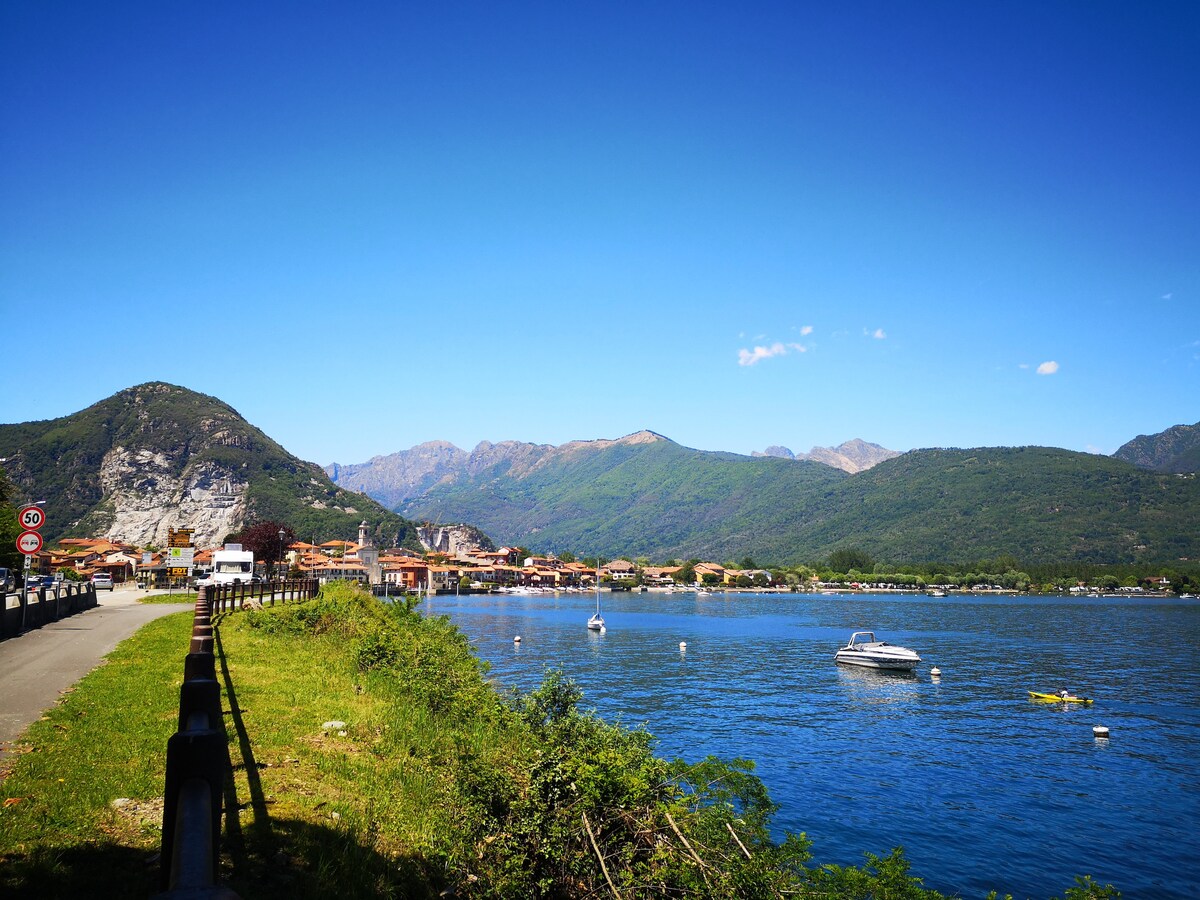
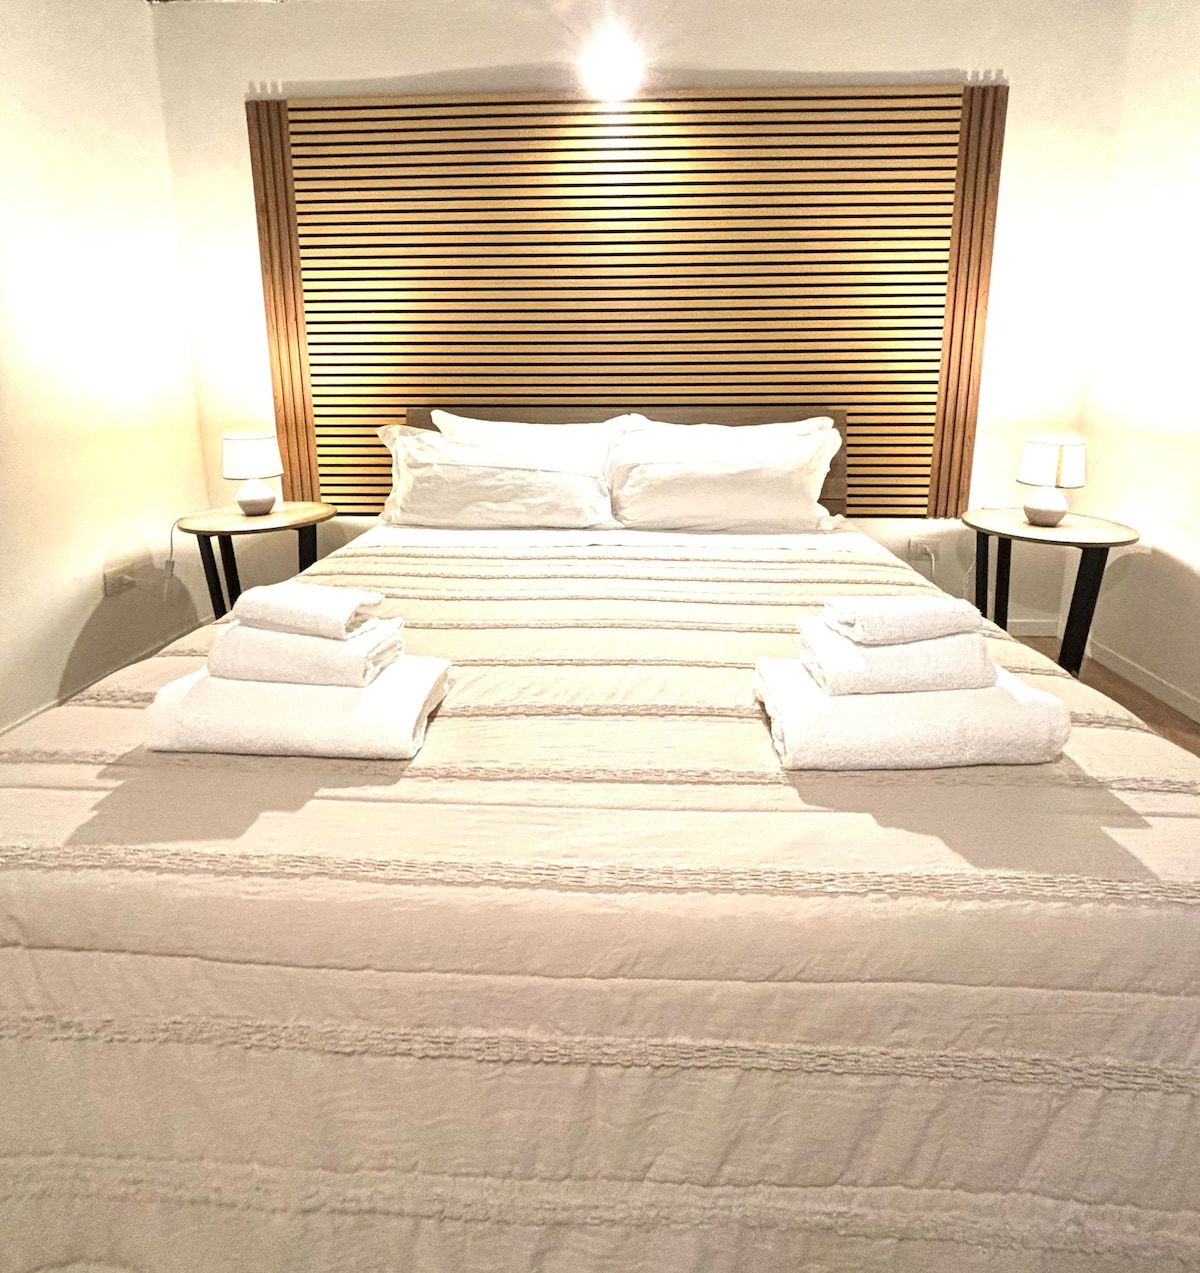
Baveno, located on the Piedmont shore of Lake Maggiore, is a town of enchanting beauty famous for its pink marble and elegant 19th-century villas. It is a refined destination offering privileged access to the Borromean Islands and spectacular panoramas. The Airbnb market is very solid here, featuring an occupancy rate of 54%. Visitors appreciate the charm of historic apartments and the convenience of lake-view holiday homes, generating an annual revenue of €32,318. Its serene atmosphere and strategic location make it a highly coveted destination for relaxation and cultural stays.
Featured Listings
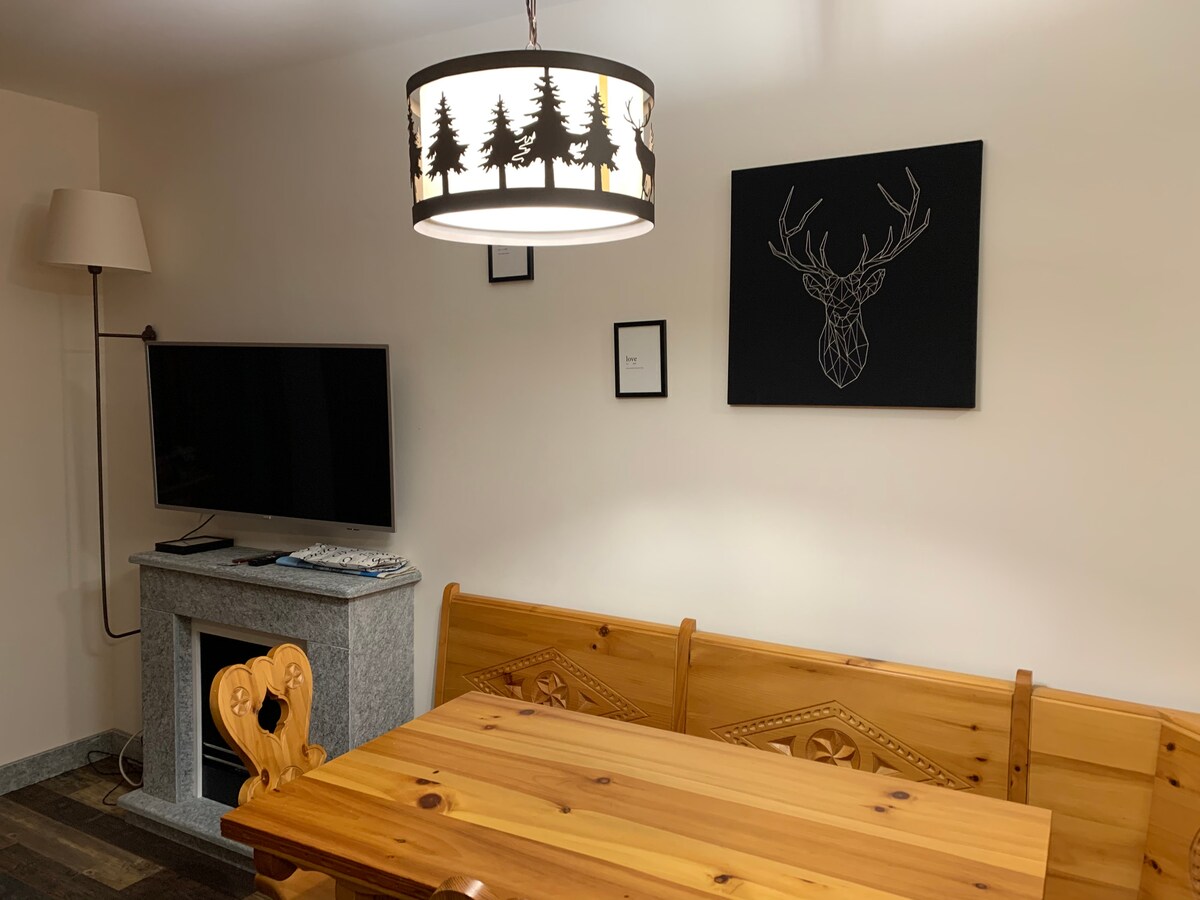
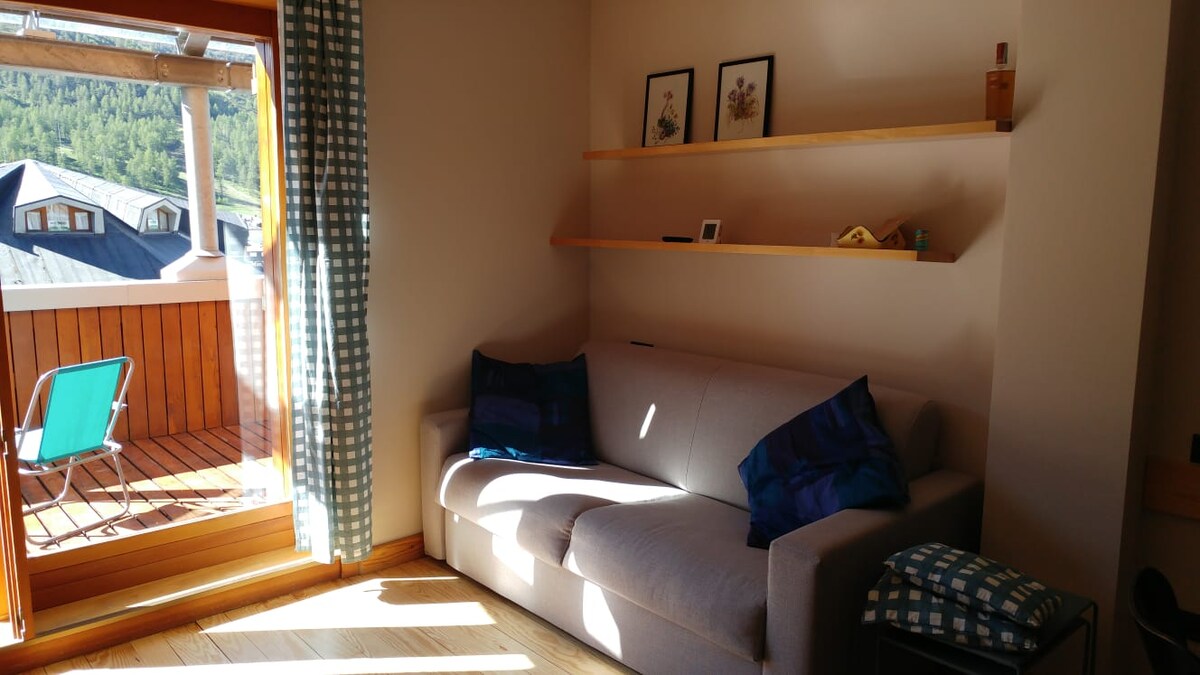
Sestriere, located in the heart of the Vialattea, is Italy’s highest ski resort and an icon of international alpine tourism. It is a dynamic market experiencing exceptional peaks in winter for snow sports and attracting hiking and mountain biking enthusiasts in summer. The Airbnb market is high-performing here, featuring an average daily rate of €171. Visitors seek the convenience of slope-side apartments and the style of modern chalets, generating an annual revenue of €31,514. Its Olympic heritage and top-tier infrastructure ensure steady demand and high profitability during key seasons.
Featured Listings
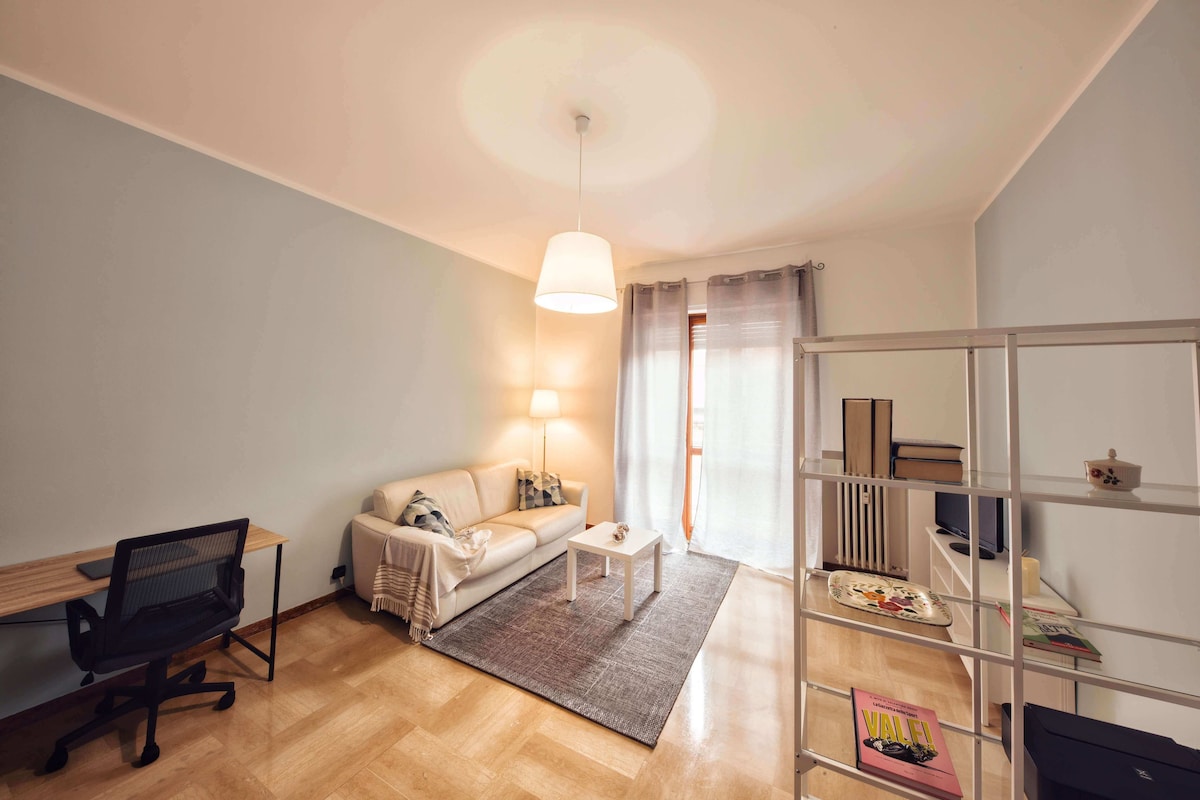
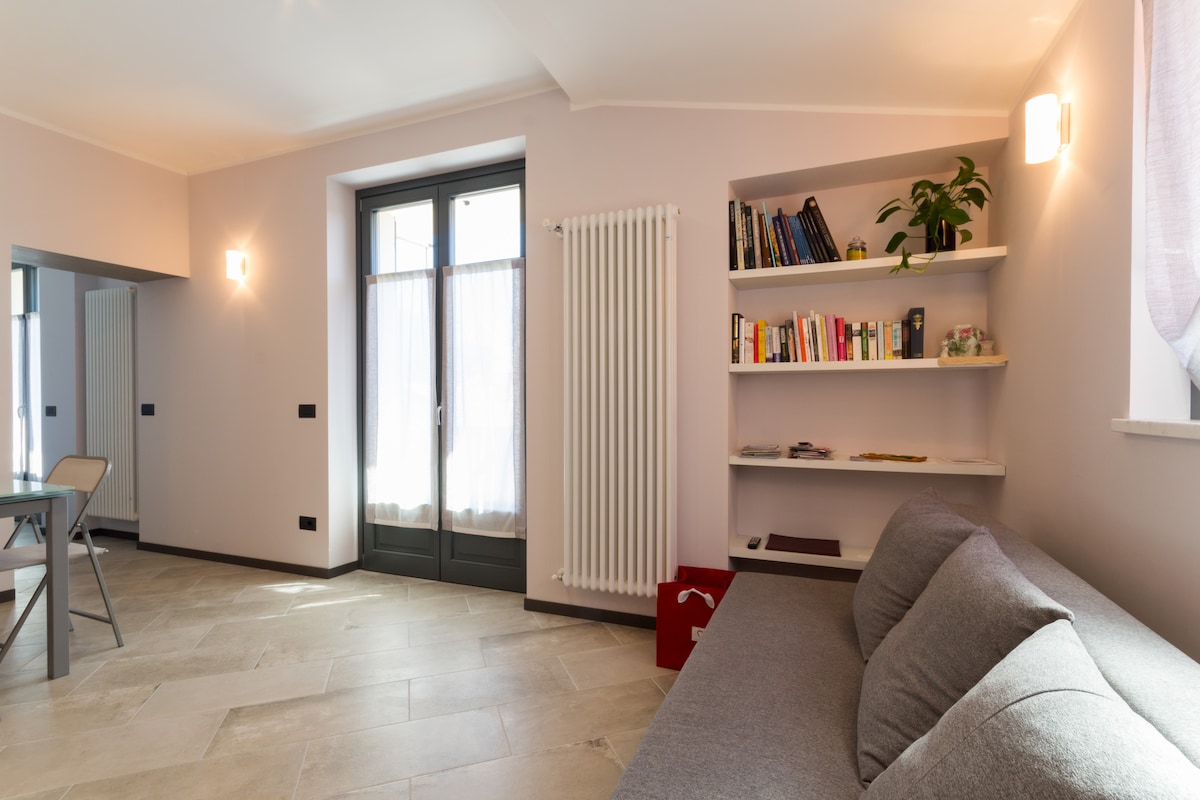
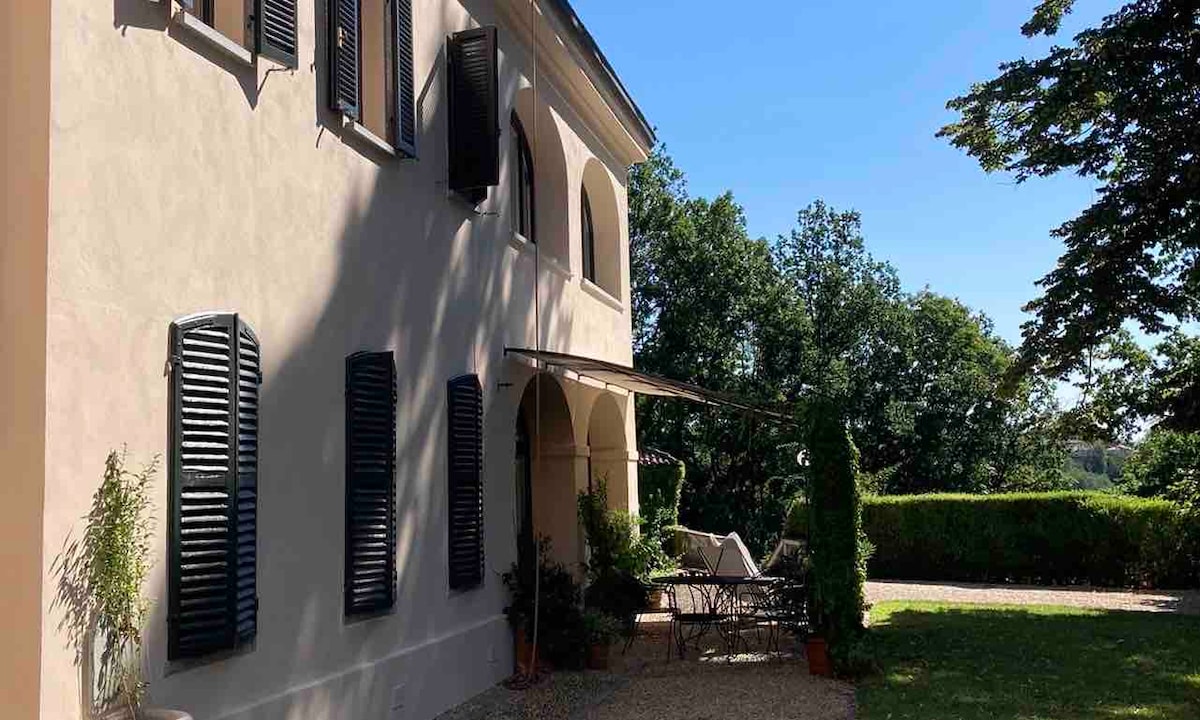
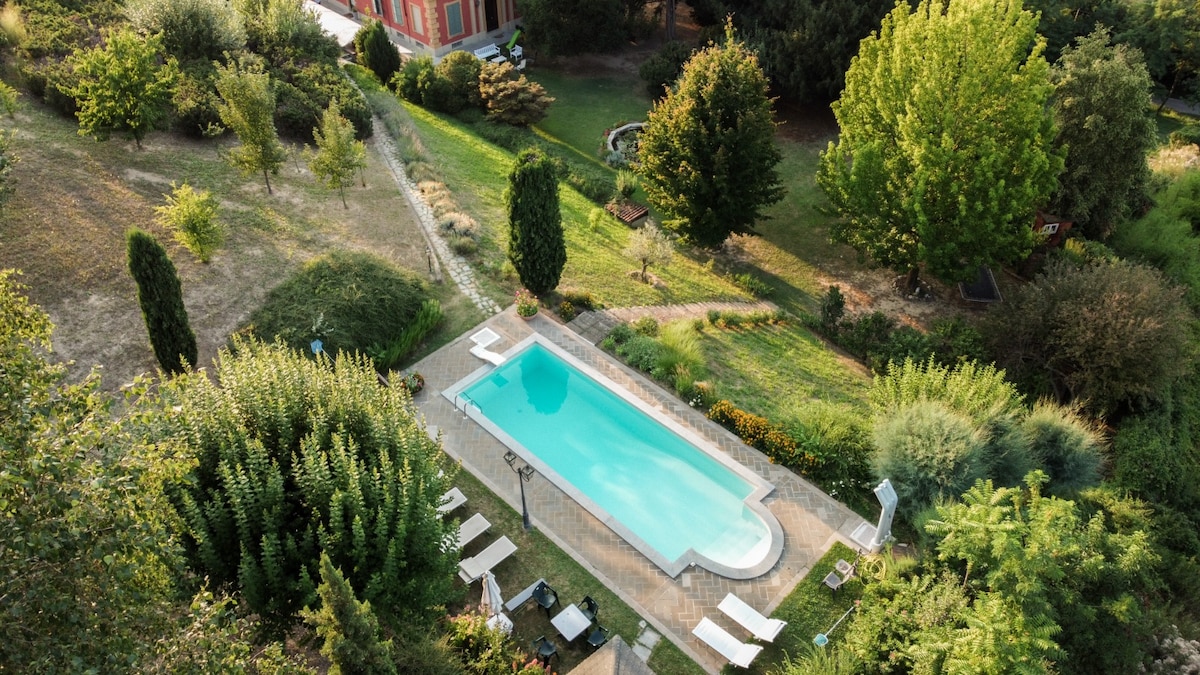
Alba, the capital of the Langhe region and the White Truffle, is a gastronomic and cultural gem and a UNESCO World Heritage site. It is a cult destination for lovers of wine and the ‘good life’, attracting sophisticated international tourism year-round. The Airbnb market is very active here, featuring an average daily rate of €152. Visitors seek the charm of restored old-town apartments or the peace of countryside homes among the vineyards, generating an annual revenue of €25,389. Its global prestige and major events like the Truffle Fair ensure steady demand and high profitability.
Featured Listings
Sauze d'Oulx, known as the ‘Balcony of the Alps’, is a vibrant and scenic ski resort in the Vialattea area, famous for its tree-lined runs and lively nightlife. It is highly popular with British and international tourists seeking fun and snow sports. The Airbnb market is dynamic here, featuring an average daily rate of €152. Visitors seek functional apartments near the lifts and character chalets in the old village, generating an annual revenue of €29,973. Its winning mix of skiing, sun, and conviviality ensures steady rental demand and solid profitability.
Featured Listings
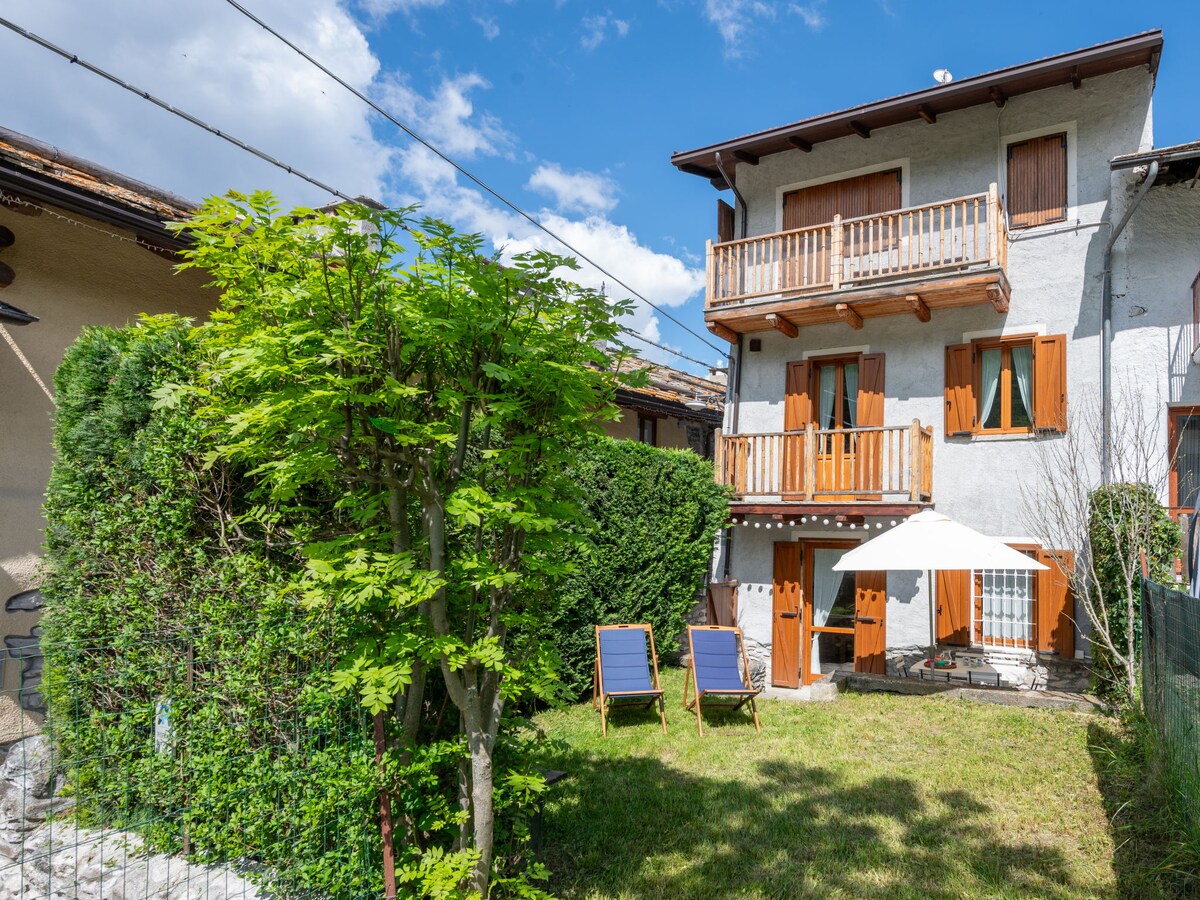

Bardonecchia, a jewel of the Susa Valley on the French border, is a historic alpine resort merging winter sports, summer nature, and a vibrant mountain life. It is an ideal destination for families and athletes, thanks to its sunny ski area and numerous hiking trails. The rental market is dynamic here, featuring an average daily rate of €146. Visitors seek cozy mountain chalets and apartments in the pedestrian center, generating an annual revenue of €25,935. Its excellent rail accessibility and the charm of its mountain basin ensure steady rental demand and secure profitability.
Featured Listings
Arona, located at the southern end of Lake Maggiore, is a vibrant town dominated by the colossal statue of San Carlone and rich in history and culture. It is a major commercial and tourist center attracting travelers for its lakeside promenade and charming alleys. The Airbnb market is solid here, featuring an occupancy rate of 51%. Visitors appreciate central apartments and modern homes with panoramic glimpses, generating an annual revenue of €24,544. Its economic energy and proximity to Milan make it a stable and profitable destination for rental investment.
Featured Listings
Asti, the city of a hundred towers and famous sparkling wine, is a premier historic and gastronomic center in the heart of Monferrato. Famous for its millennial Palio race and medieval architecture, it attracts cultural and gourmet tourism fascinated by Piedmontese traditions. The Airbnb market is very active here, featuring an occupancy rate of 48%. Visitors seek the character of old-town apartments or the convenience of rentals near wine cellars, generating an annual revenue of €17,377. Its global appeal linked to wine and history ensures steady demand and consistent profitability.
Featured Listings
Get Live Piemonte, Italy Market Intelligence
Discover detailed Piemonte, Italy Airbnb Analytics and explore real-time market data to make accurate investment decisions.
Explore Real-time Analytics