Airbnb Occupancy Rates in Siracusa, Sicilia(June 2026)
Is Siracusa still a short-term rental buy in June 2026? Citywide data shows €30,627 in average annual revenue per listing, 58% occupancy, €144 per night, and 2,740 active Airbnb listings—figures that often trail Palermo and Napoli on headline revenue but can beat pure beach towns on shoulder-season stability when the unit is on Ortigia or wired for Val di Noto road trips.
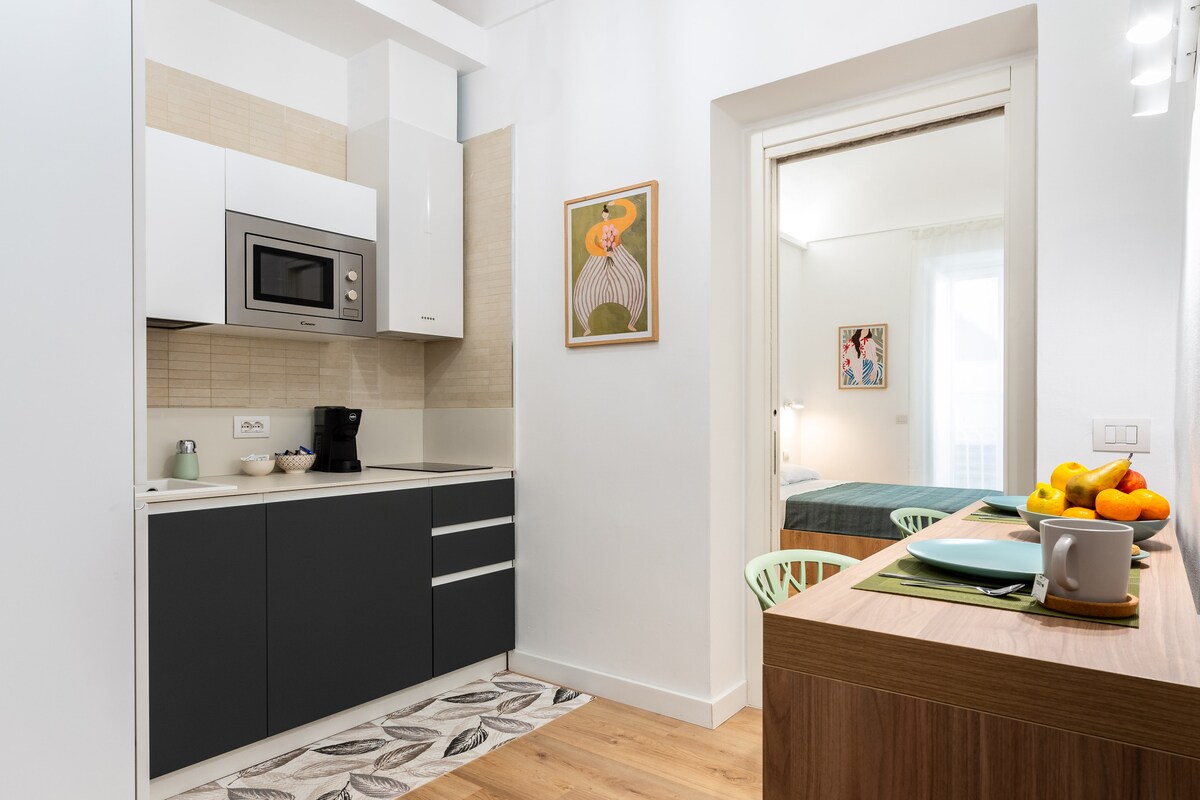
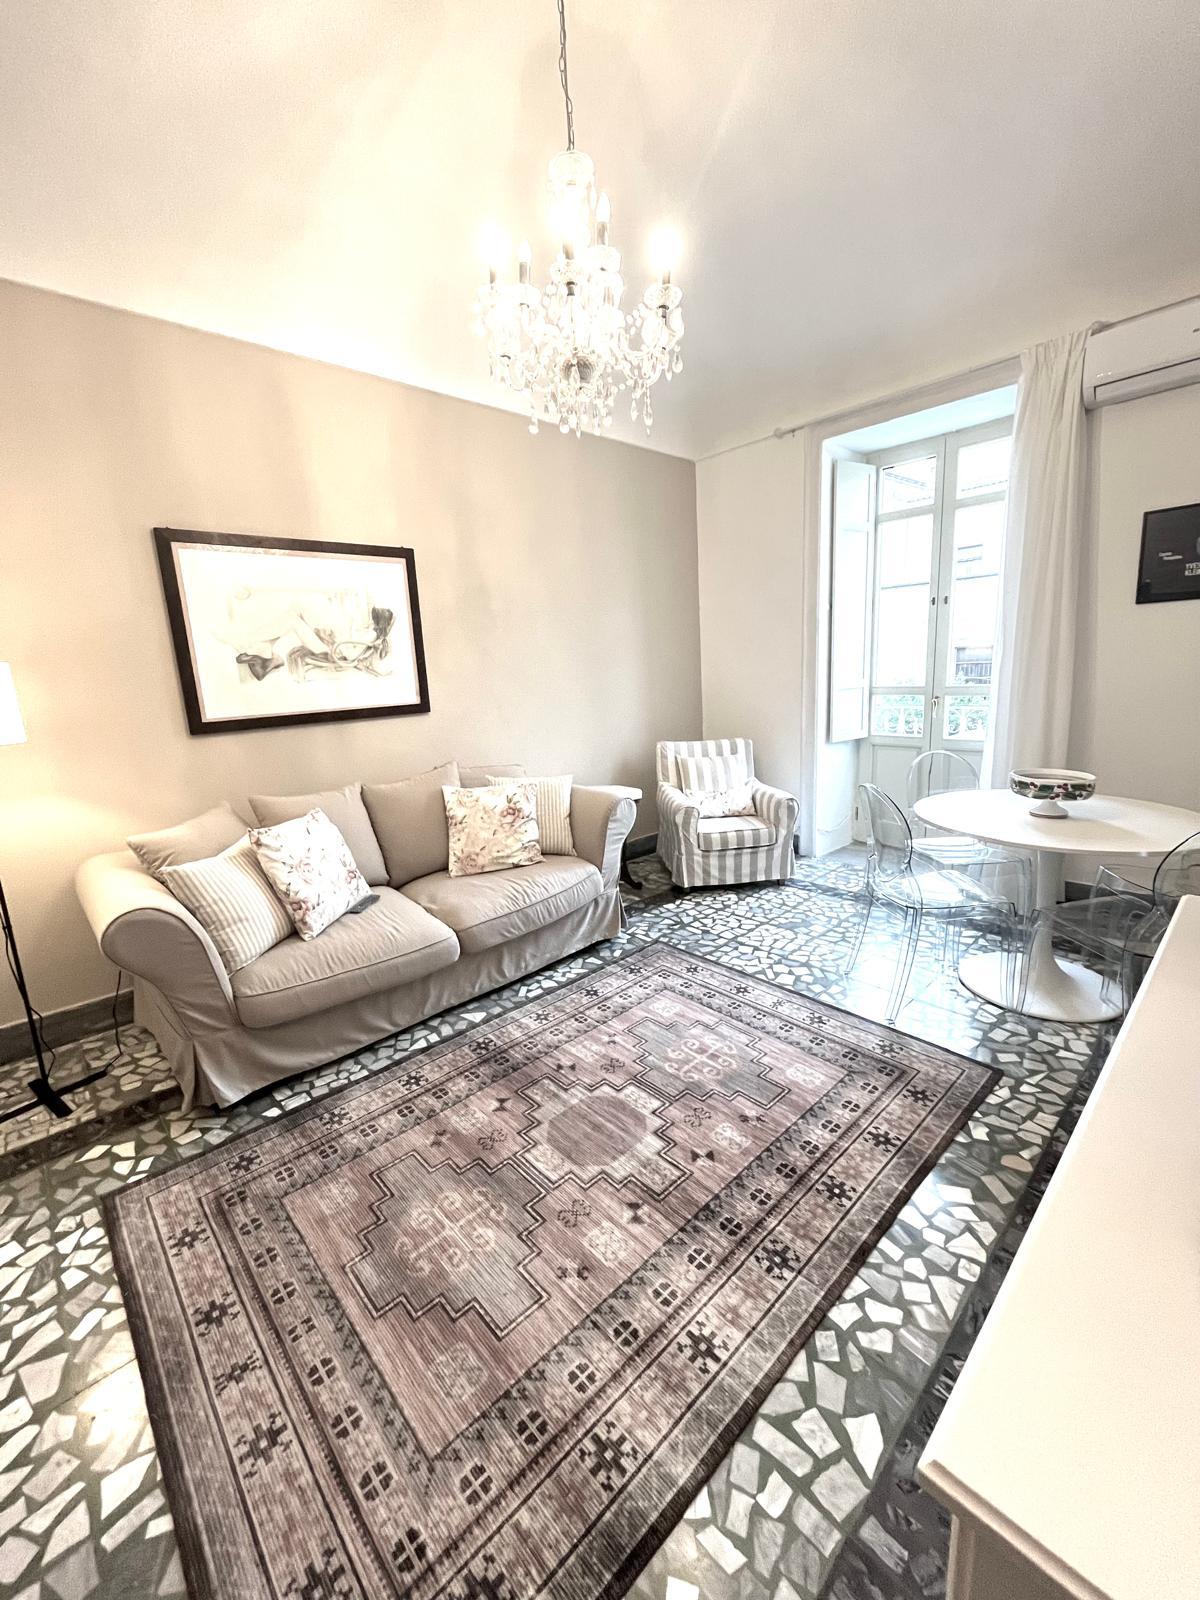
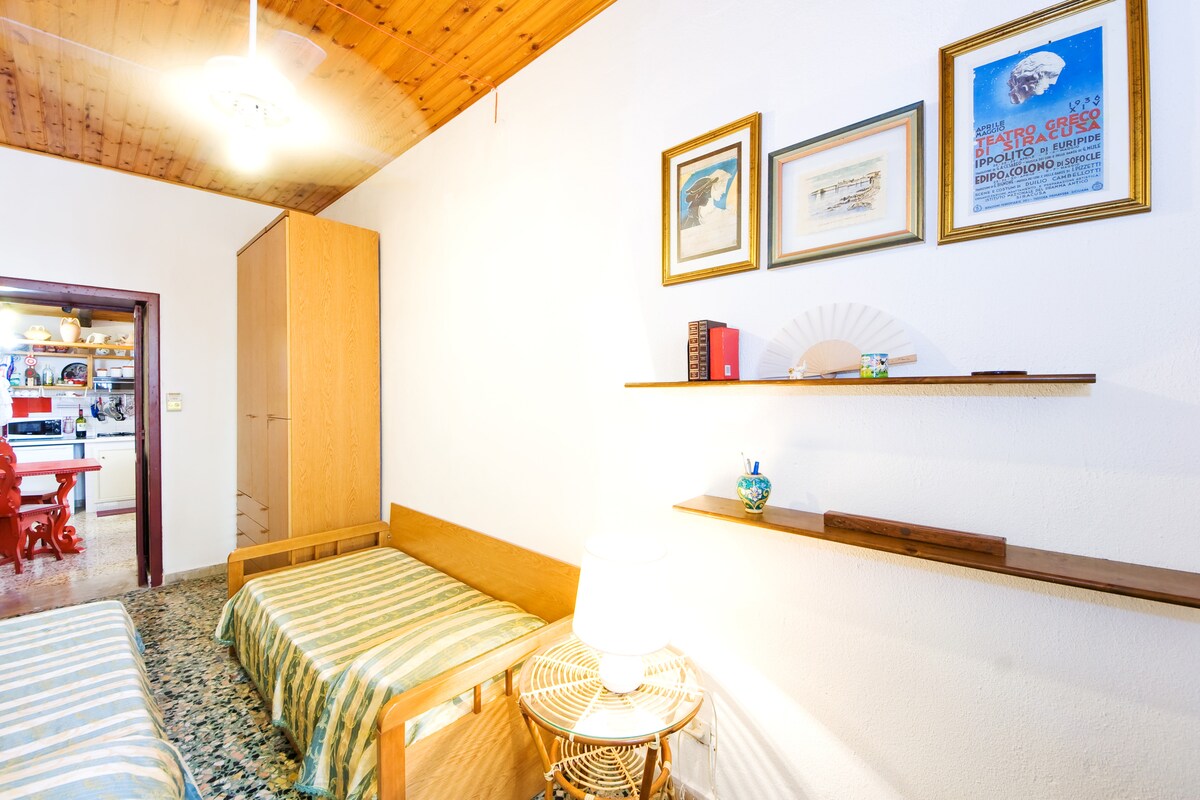
Siracusa is southeastern Sicily’s UNESCO baroque and Greek archaeology capital: island lanes, Neapolis and Arethusa, slow-food harbours, and a feeder market for Noto, Marzamemi, and the Iblei wine country. Guests book for culture-first city breaks and longer warm-season stays—not only August beach weeks. Operators who price Siracusa like a discount Taormina without modelling CIR/CIN compliance, Ortigia access, and east-coast seasonality often misread when ADR actually lifts.
Siracusa Airbnb Market Map (June 2026)
Siracusa Market Performance
Period: June 2025 - May 2026
Is Airbnb a Good Investment in Siracusa?
YES — Siracusa suits investors who want UNESCO-listed demand and Val di Noto spillover at lower acquisition stress than northern Italy, provided you complete Sicily’s CIR path, national CIN, and Siracusa tourist-tax reporting before scaling.
| City | Avg revenue | Occupancy | What the rules imply |
|---|---|---|---|
| Siracusa | €30,627 | 58% | CIA/Allegato B at Comune → CIR on regional portal → CIN on BDSR; collect imposta di soggiorno (4%, cap €5/night, 7 nights max) via municipal Tourist Tax |
| Palermo | €22,138 | 61% | Same Sicily LR 6/2025 stack; larger inventory and airport hub—compliance steps mirror Siracusa |
| Catania | €18,501 | 59% | Same regional CIR + national CIN; Etna/airport positioning—not a lighter rulebook |
| Napoli | €25,680 | 60% | Campania CUSR + SUAP and GEIS tourist tax—different region from Sicily’s Turist@t/CIR workflow |
Trade-offs to model:Palermo (€22,138, 61%) and Catania (€18,501, 59%) usually post higher citywide revenue on deeper inventories; Siracusa trades scale for Ortigia premiums, Val di Noto positioning, and a guest mix skewed to archaeology and slow-food weekends. Napoli (€25,680, 60%) competes for southern-Italy yield with Amalfi spillover but runs Campania registration, not Sicily’s CIR portal—relevant if you are choosing between Tyrrhenian and Ionian hubs. Winning here means honest Ortigia logistics, shoulder-season pricing, and documented CIR/CIN/tourist-tax workflows, not assuming Sicilian baroque automatically equals Taormina ADR.
Get Live Siracusa Market Intelligence
Discover detailed Siracusa Airbnb Analytics and explore real-time market data to make accurate investment decisions.
Explore Real-time Analytics
How Often Will Your Airbnb Be Booked in Siracusa?
View Demand Patterns →Occupancy rates directly impact your revenue potential. Understanding demand patterns helps you set realistic expectations and optimize your availability strategy.
The current average occupancy rate in Siracusa is 58%, meaning properties are booked for about 213 nights per year. However, occupancy varies significantly based on property quality and management. Here's what you can expect:
Airbnb Occupancy Tiers in Siracusa
Premium(Top 10%) | High-performing(Top 25%) | Average(Median) | Low-performing(Bottom 25%) |
|---|---|---|---|
| 87% | 67% | 42% | 17% |
*High desirability & optimized availability | *Good market fit & guest satisfaction | *Standard market performance | *Higher vacancy, optimization needed |
Seasonal Occupancy Patterns in Siracusa
July, May
Highest demand and occupancy rates. Perfect for premium pricing strategies and maximizing revenue. Consider longer minimum stays and higher rates.
March, February
Moderate demand with balanced pricing opportunities. Good for attracting budget-conscious travelers while maintaining reasonable occupancy rates.
December, November
Lower demand requires competitive pricing and creative marketing. Focus on local events, extended stay discounts, and targeting specific traveler segments.
How Much Can You Earn with Airbnb in Siracusa?
Calculate Earnings →One of the most common questions for potential Airbnb hosts in Siracusa is about earning potential. Let's break down the revenue patterns and what you can realistically expect to earn.
Monthly Revenue Trends in Siracusa
Best-in-class Airbnb properties (top 10%) in Siracusa achieve around €43,117 annually, while strong performers (top 25%) earn at least €23,249. Typical properties generate about €12,055 per year, and entry-level listings (bottom 25%) see earnings near €4,611, often with room for optimization. Keep in mind, these are market averages—your actual earnings can be even higher depending on your property's location, bedrooms, guest capacity, and unique amenities.
Want to see how your listing could perform? Create a free account to unlock personalized analytics and explore exclusive insights in our app!
What Can You Learn from Top-Performing Airbnbs in Siracusa?
View Top Performers →Studying successful properties provides valuable insights for your own Airbnb strategy. Here are the top-performing listings in Siracusa and what makes them successful.
Siracusa Market Analysis
Siracusa’s short-term rental market in one pass
Demand clusters on Ortigia—the island centro with Greek ruins, baroque façades, and harbour restaurants—and on mainland districts guests use for parking, larger apartments, or quicker access toward Catania Airport. International city-breakers stay two to four nights for Neapolis, the Paolo Orsi museum corridor, and evening passeggiate; Italian families and couples extend into Noto, Modica, and Marzamemi day trips, stretching average length of stay versus pure transit markets. Cruise and coach groups add spikes when ships call; university and healthcare traffic can support mid-week nights away from peak beach calendars. Citywide 58% occupancy and €144 ADR blend premium island stock with mainland value plays—underwriting should separate micro-markets, not one “Siracusa average.”
When bookings and rates move on the Ionian coast
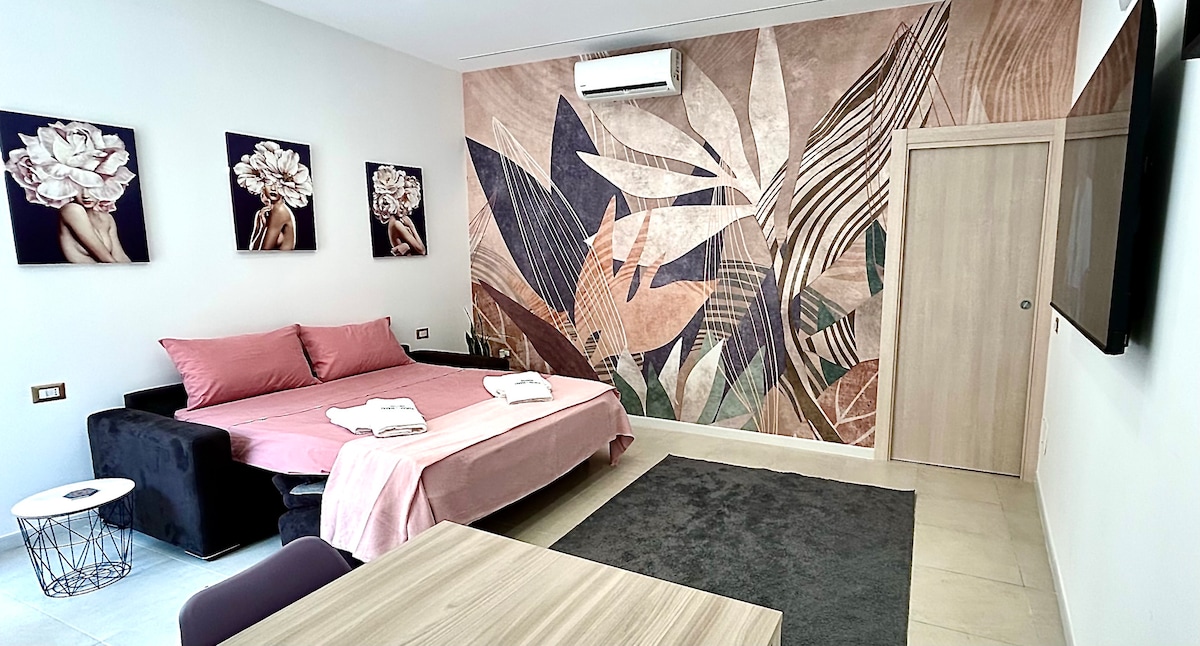
Spring and early autumn often deliver the best mix of occupancy and rate before peak August heat—ideal for Ortigia walks and Val di Noto drives without July premiums. July–August lifts sea-facing and air-conditioned stock; mainland units without clear beach positioning can discount if guests prioritise Ortigia nights only. Carnival, classical-performance season, and long Italian weekends can reprice specific weeks more than a flat summer markup. Compare your calendar with Catania event volatility and Palermo cruise/port spikes—Siracusa’s curve is culture- and road-trip-weighted rather than megacity business travel.
Investor checklist before you buy or list
- Confirm condominium rules and whether the address is Ortigia (access, ZTL, luggage) versus mainland (parking, noise).
- File Comune di Siracusa start-of-activity steps (CIA or SCIA if business-like) via SUAP / Impresa in un giorno and submit Allegato B documentation under Sicily’s current locazioni-turistiche framework.
- Obtain CIR on the regional tourism observatory portal, then request and display CIN on BDSR on every listing and at the property entrance.
- Register for imposta di soggiorno: collect from qualifying non-resident guests (4% of the stay price, €5/night cap, up to seven consecutive nights under the municipal rules in force from June 2024), declare monthly, and remit via the Comune Tourist Tax portal.
- Set up Alloggiati Web and plan ISTAT flows if required for your classification.
- Budget for AC, dehumidification, and clear check-in—older fabric on Ortigia rewards honest stair and noise disclosures.
- Benchmark revenue against Palermo, Catania, and Napoli using live placeholders—not legacy “cheap Sicily” assumptions.
What Are the Airbnb Regulations in Siracusa?
Understanding local regulations is crucial for operating a successful Airbnb. Let's examine the compliance landscape and what you need to know about licensing requirements in Siracusa.
Current Regulatory Status
76% compliance indicates strict regulatory enforcement in this market.
Short-term letting in Siracusa sits under national CIN rules, Regione Siciliana registration (CIR via the regional tourism observatory after municipal start-of-activity filing), and Comune di Siracusa enforcement on tourist tax and guest reporting. Italy does not impose a nationwide 120- or 180-day cap; each contract is limited to 30 days per stay. From 2026, many private hosts use cedolare secca on at most two apartments before crossing into business taxation (Agenzia delle Entrate — locazioni brevi).
| Host profile | Main filing | What it means in practice |
|---|---|---|
| Private / non-business locazione turistica | CIA + Allegato B at Comune, then CIR | Up to four units in Sicily for non-entrepreneurial locazioni turistiche under current regional guidance—confirm on Regione Siciliana tourism pages |
| Business-like or habitual letting | SCIA via SUAP | Higher municipal scrutiny; same CIN display obligations once registered |
After municipal filing, register the unit for CIR on Sicily’s tourism observatory platform (Turist@t / regional BDSR integration), then obtain CIN on BDSR (Ministry FAQ). Display CIN on every platform listing and at the entrance. Register guest stays on Alloggiati Web within 24 hours of check-in.
Imposta di soggiorno: From 1 June 2024, Siracusa extended the tax to locazioni brevi—hosts collect from qualifying non-resident guests, declare monthly, and remit by the 16th of the following month via the municipal Tourist Tax system (regolamento update, Modello 21 guidance). Municipal reception for lodging procedures: Ufficio Attività Ricettive.
Regional references: L.R. Sicilia 6/2025 and implementing measures (including D.A. 2104/2025 on locazioni turistiche), plus national D.L. 145/2023 art. 13-ter on CIN transparency (Normattiva).
How Competitive is the Airbnb Market in Siracusa?
Analyze Competition →Understanding market competition is crucial for any potential Airbnb host. Let's examine the supply dynamics and what they mean for your investment strategy. The Siracusa Airbnb market currently features 2,740 active listings with an average occupancy rate of 58%. This represents a highly competitive market environment where balanced supply and demand create opportunities for strategic positioning.
Airbnb Listings: Change Over Time
Strategic Entry into Siracusa Airbnb Market
Competitive Positioning
- Focus on mid-market with competitive pricing
- Emphasize unique features and exceptional service
- Target mid-range market segment
Market Opportunities
- Strong demand supports premium pricing strategies
- Stable market provides predictable investment returns
- Established market with proven demand patterns
What Should You Charge for Your Airbnb in Siracusa?
Smart Pricing Tools →Pricing is one of the most critical decisions for Airbnb success. Let's analyze the current pricing landscape and help you understand what rates you can realistically charge.
The current average daily rate in Siracusa is €144 per night. However, pricing varies significantly based on property quality and location. Here's what different property tiers typically charge:
Airbnb Pricing Tiers in Siracusa
Premium(Top 10%) | High-performing(Top 25%) | Average(Median) | Budget(Bottom 25%) |
|---|---|---|---|
| €216per night | €126per night | €76per night | €36per night |
*Top locations, big properties, premium amenities | *Good property management, highly rated | *Standard market performance | *Basic properties, less desirable locations |
Is It Profitable to Start an Airbnb in Siracusa?
Investment Analysis →Understanding the profitability potential is crucial for any Airbnb investment decision. Let's analyze the revenue performance and profit margins in the Siracusa market to help you make informed financial decisions.