Best Airbnb Markets in
Sud Sardegna, Sardegna
Maximizing your returns in Sud Sardegna, Sardegna depends on choosing the right location with proven demand. We have carefully reviewed the top 9 markets to help you spot emerging trends and high-performing zones for your Airbnb portfolio.
While this data gives you a solid market-wide perspective, successful investing requires property-specific due diligence. For the most accurate filters, occupancy heatmaps, and revenue breakdowns, use GuestFavorites.
Sud Sardegna Airbnb Market Map (February 2026)
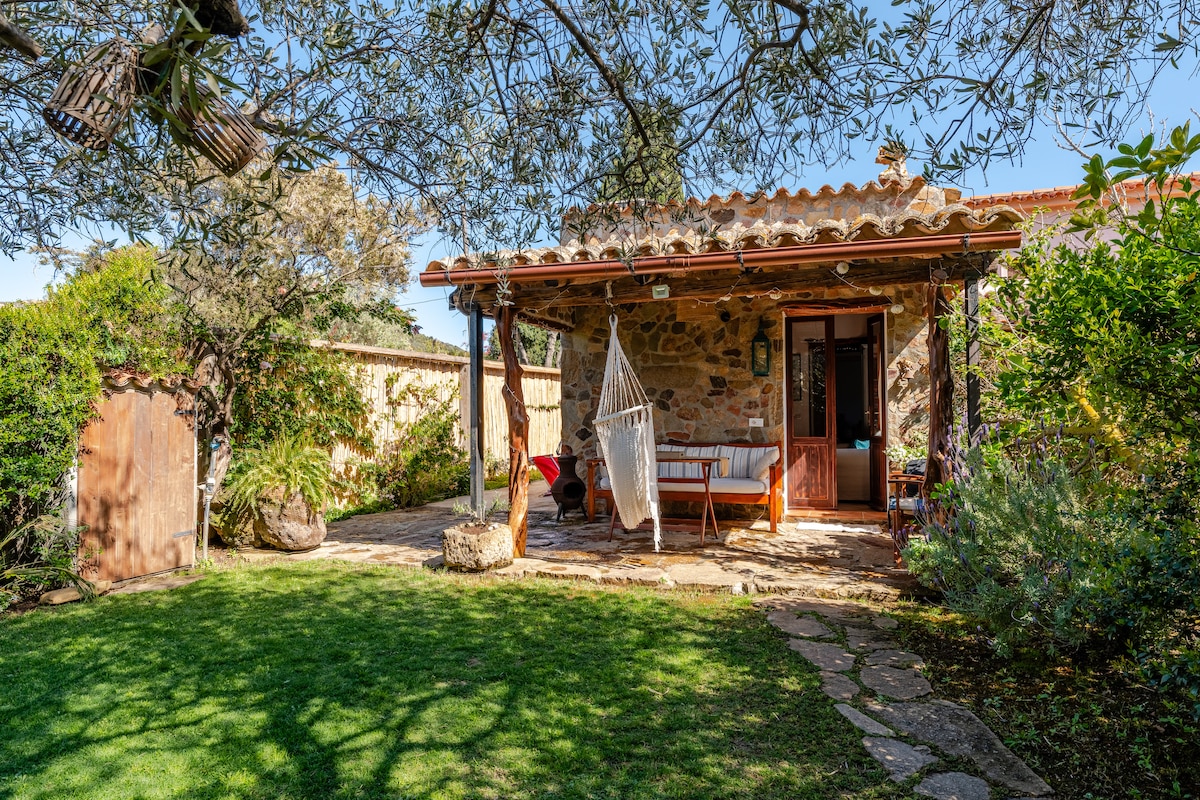
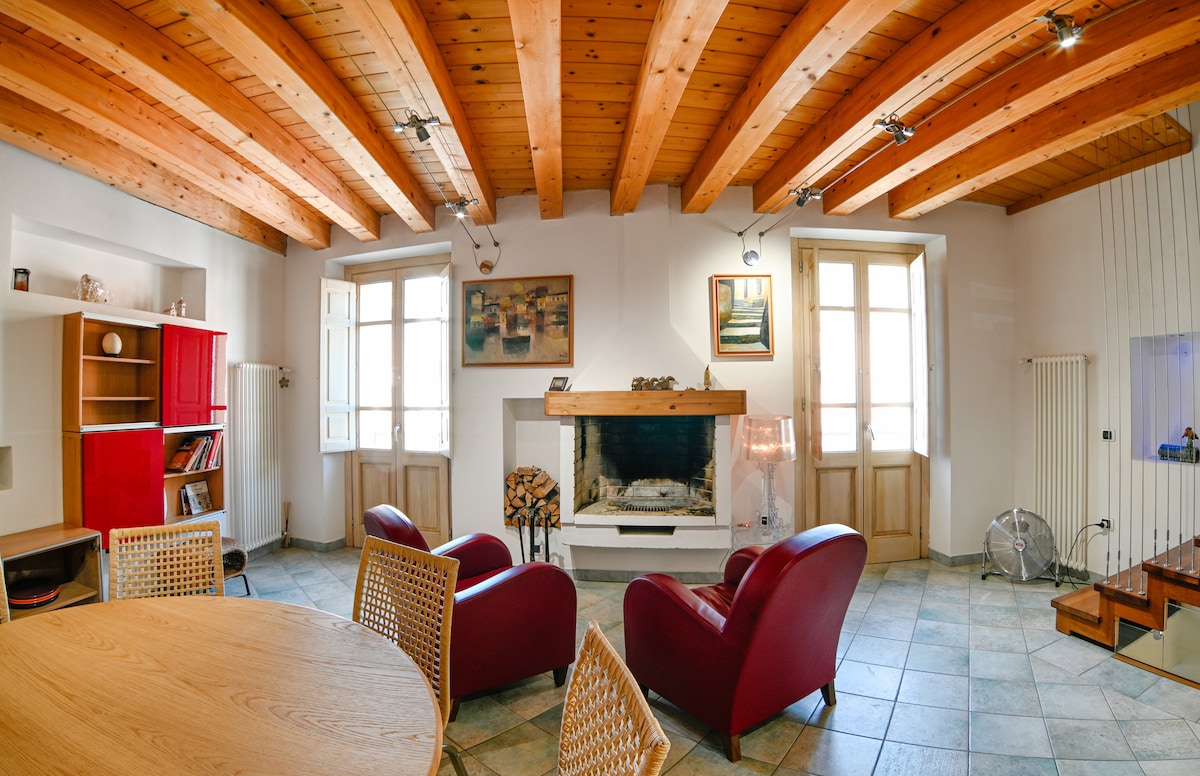
Villasimius, the jewel of southern Sardinia located within the Capo Carbonara Marine Protected Area, is a world-class prestigious destination famous for its fine white sand beaches and transparent waters. It is a sunny spot attracting elite international tourism seeking wild nature, sailing, and a refined Mediterranean atmosphere. The Airbnb market is very powerful here, featuring an occupancy rate of 63%. Visitors seek exclusive villas with pools near the coves and the convenience of elegant apartments in the vibrant village, paying an average daily rate of €197. Its annual revenue of €45,765 positions it as a top destination for real estate investment.
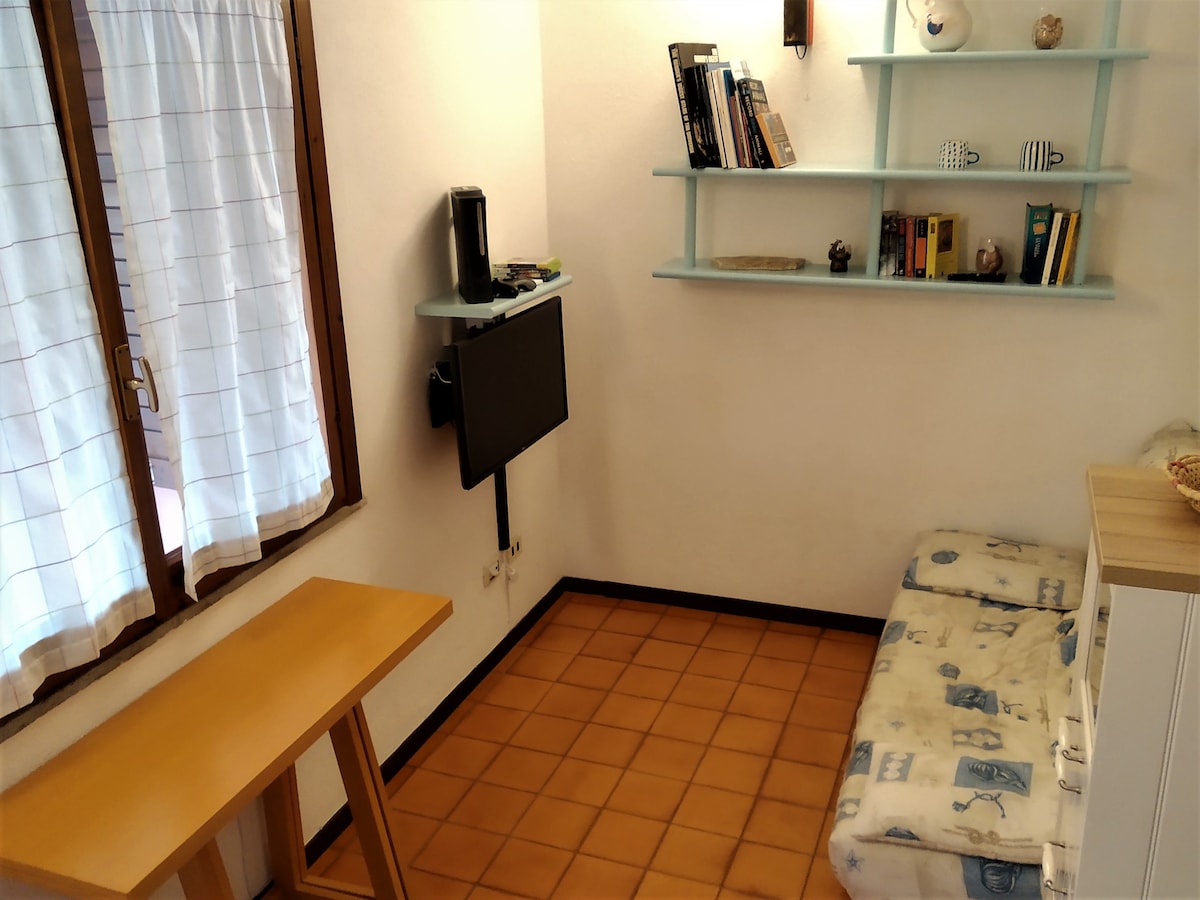
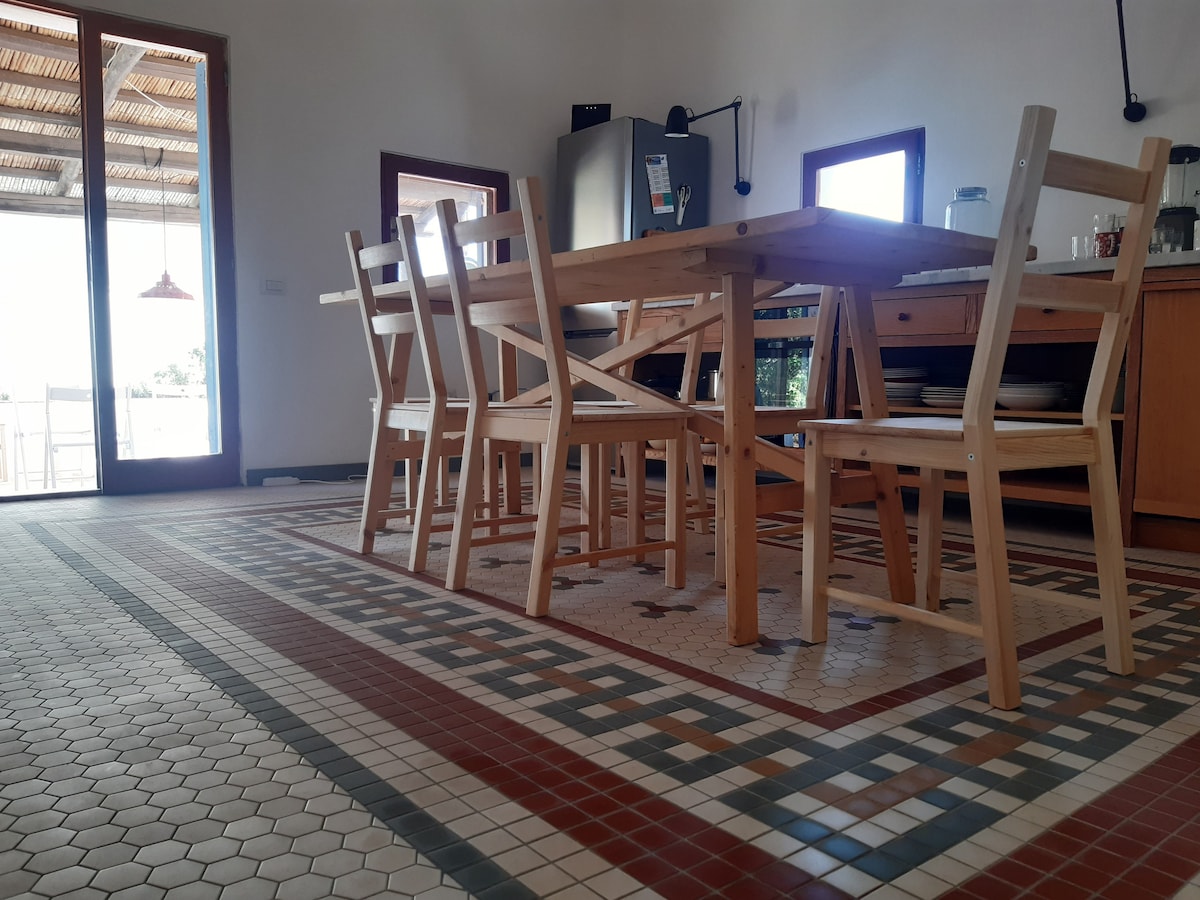
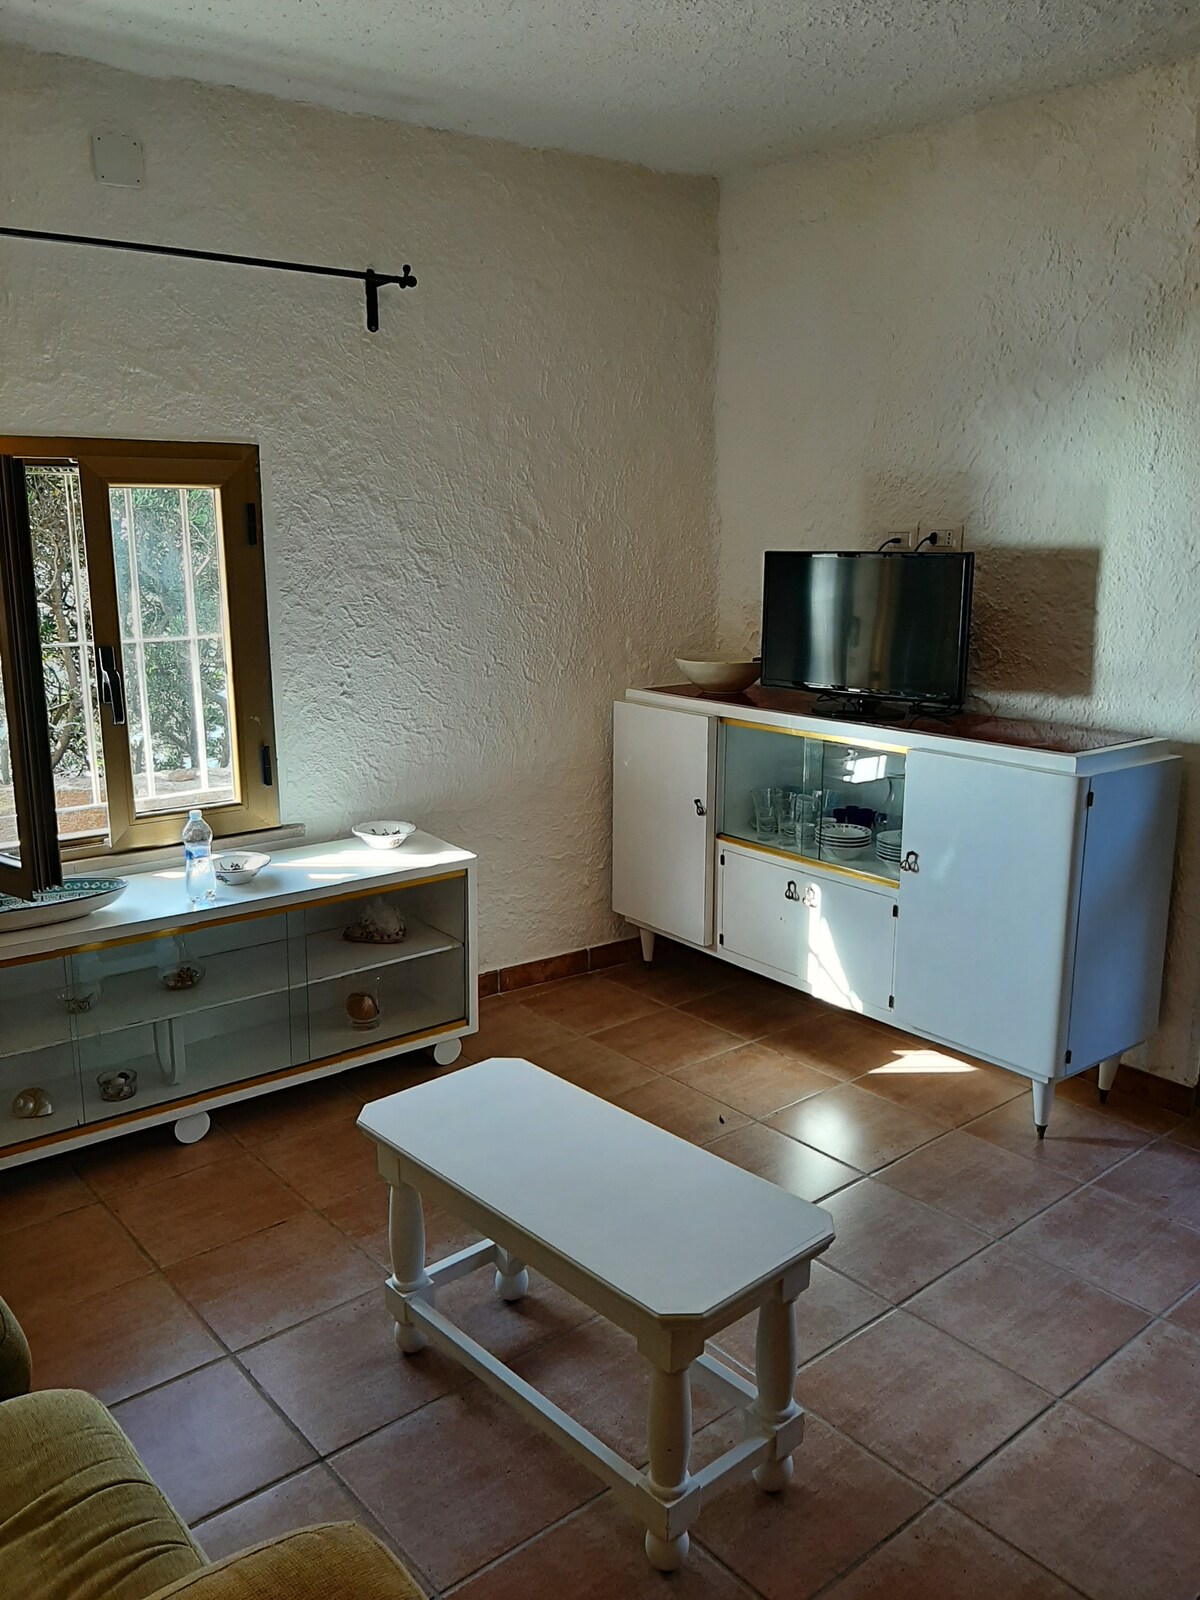
Featured Listings

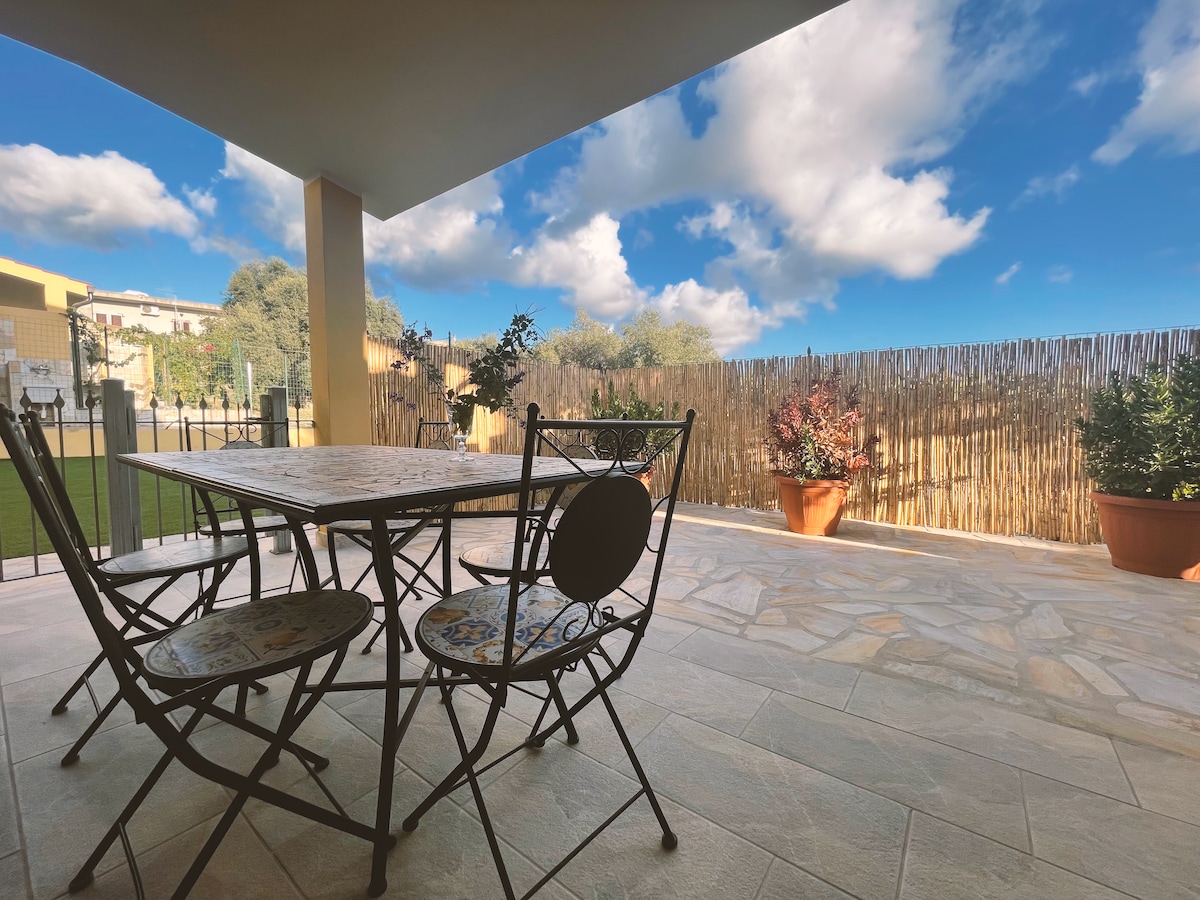
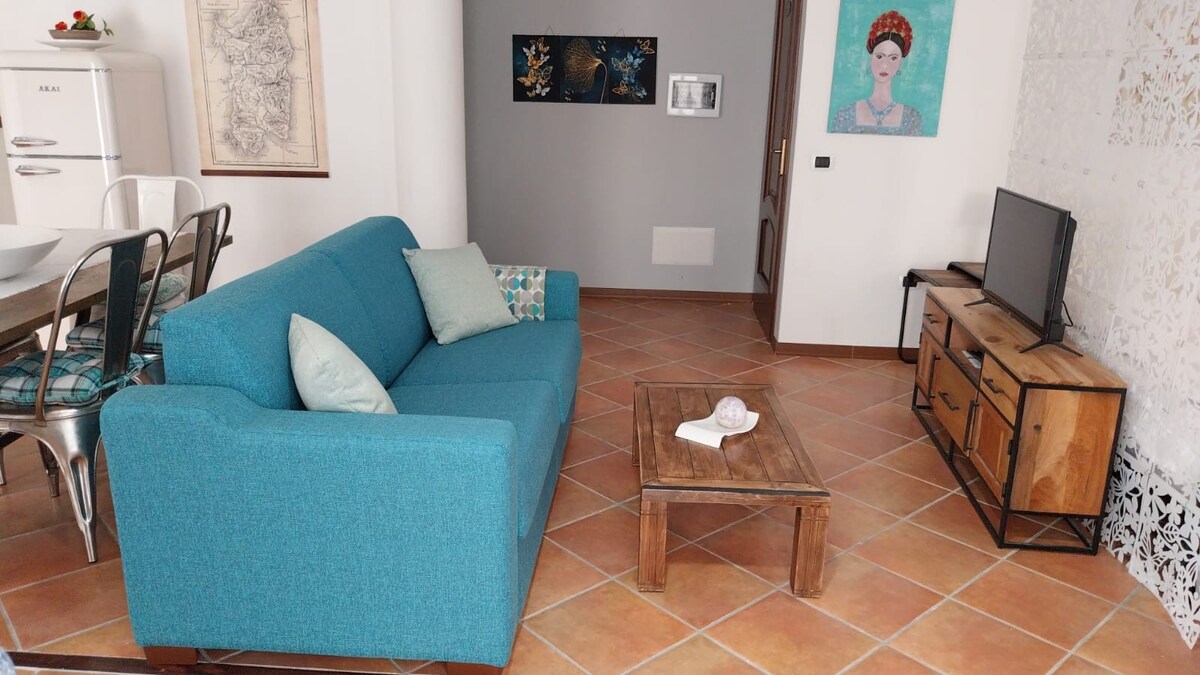
Muravera, the heart of the Sarrabus region famous for its fragrant citrus groves and the untouched beaches of Costa Rei, offers a natural paradise of rare beauty in southeastern Sardinia. It is a charming destination attracting international tourism seeking relaxation, turquoise sea, and authentic Sardinian hospitality in a wild landscape. The Airbnb market is very powerful here, featuring an occupancy rate of 65%. Visitors seek exclusive sea-view villas and the convenience of holiday homes nestled in Mediterranean scrub, paying an average daily rate of €191. Its annual revenue of €45,785 positions it as a premier destination for seaside profitability.
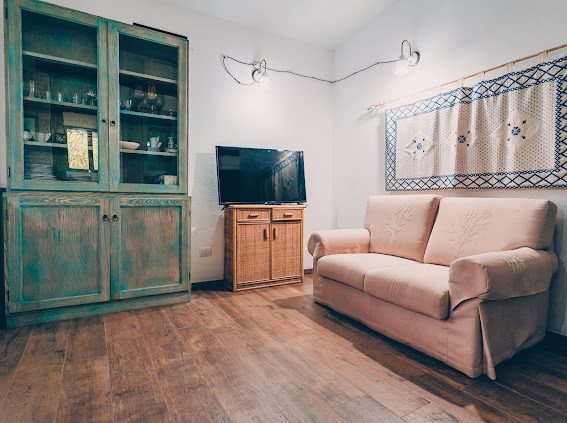
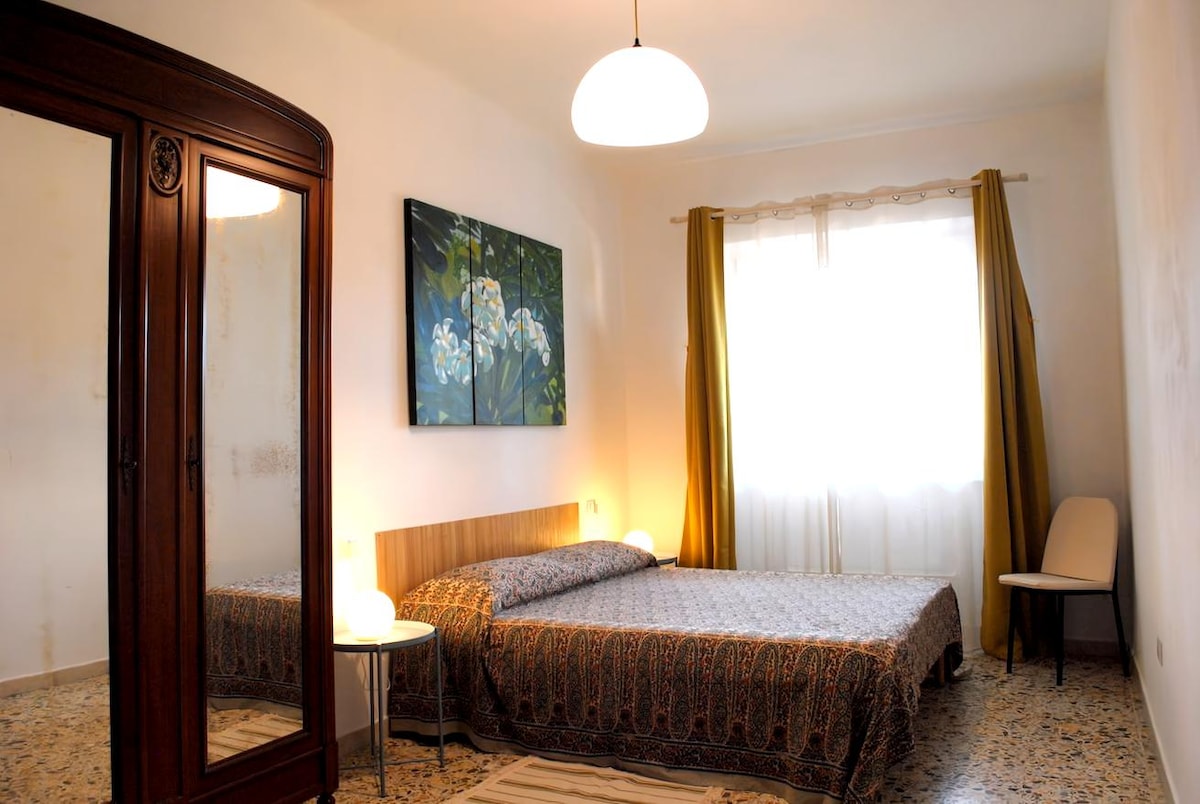
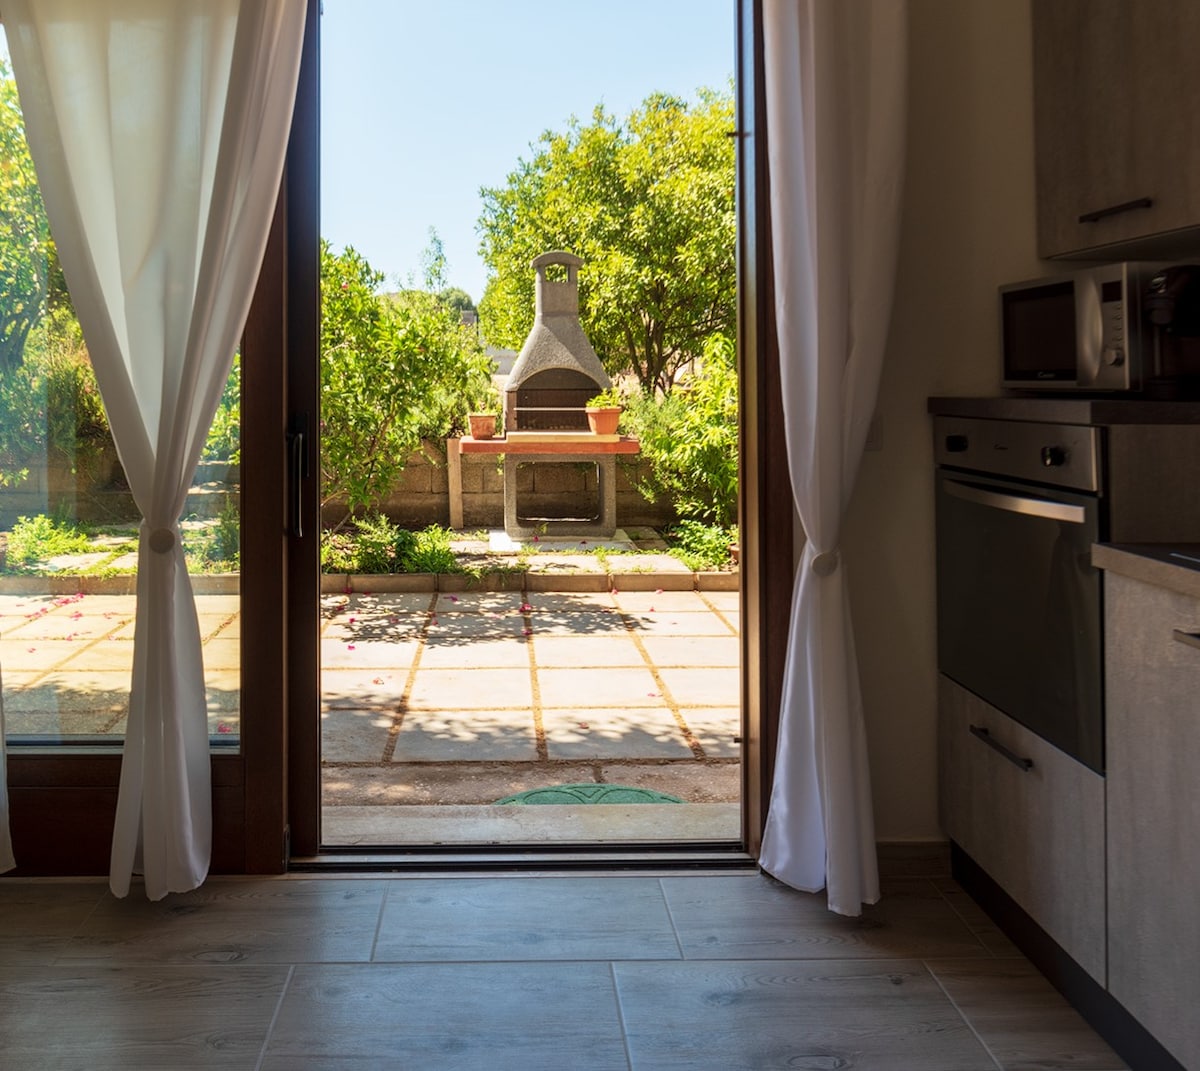
Featured Listings

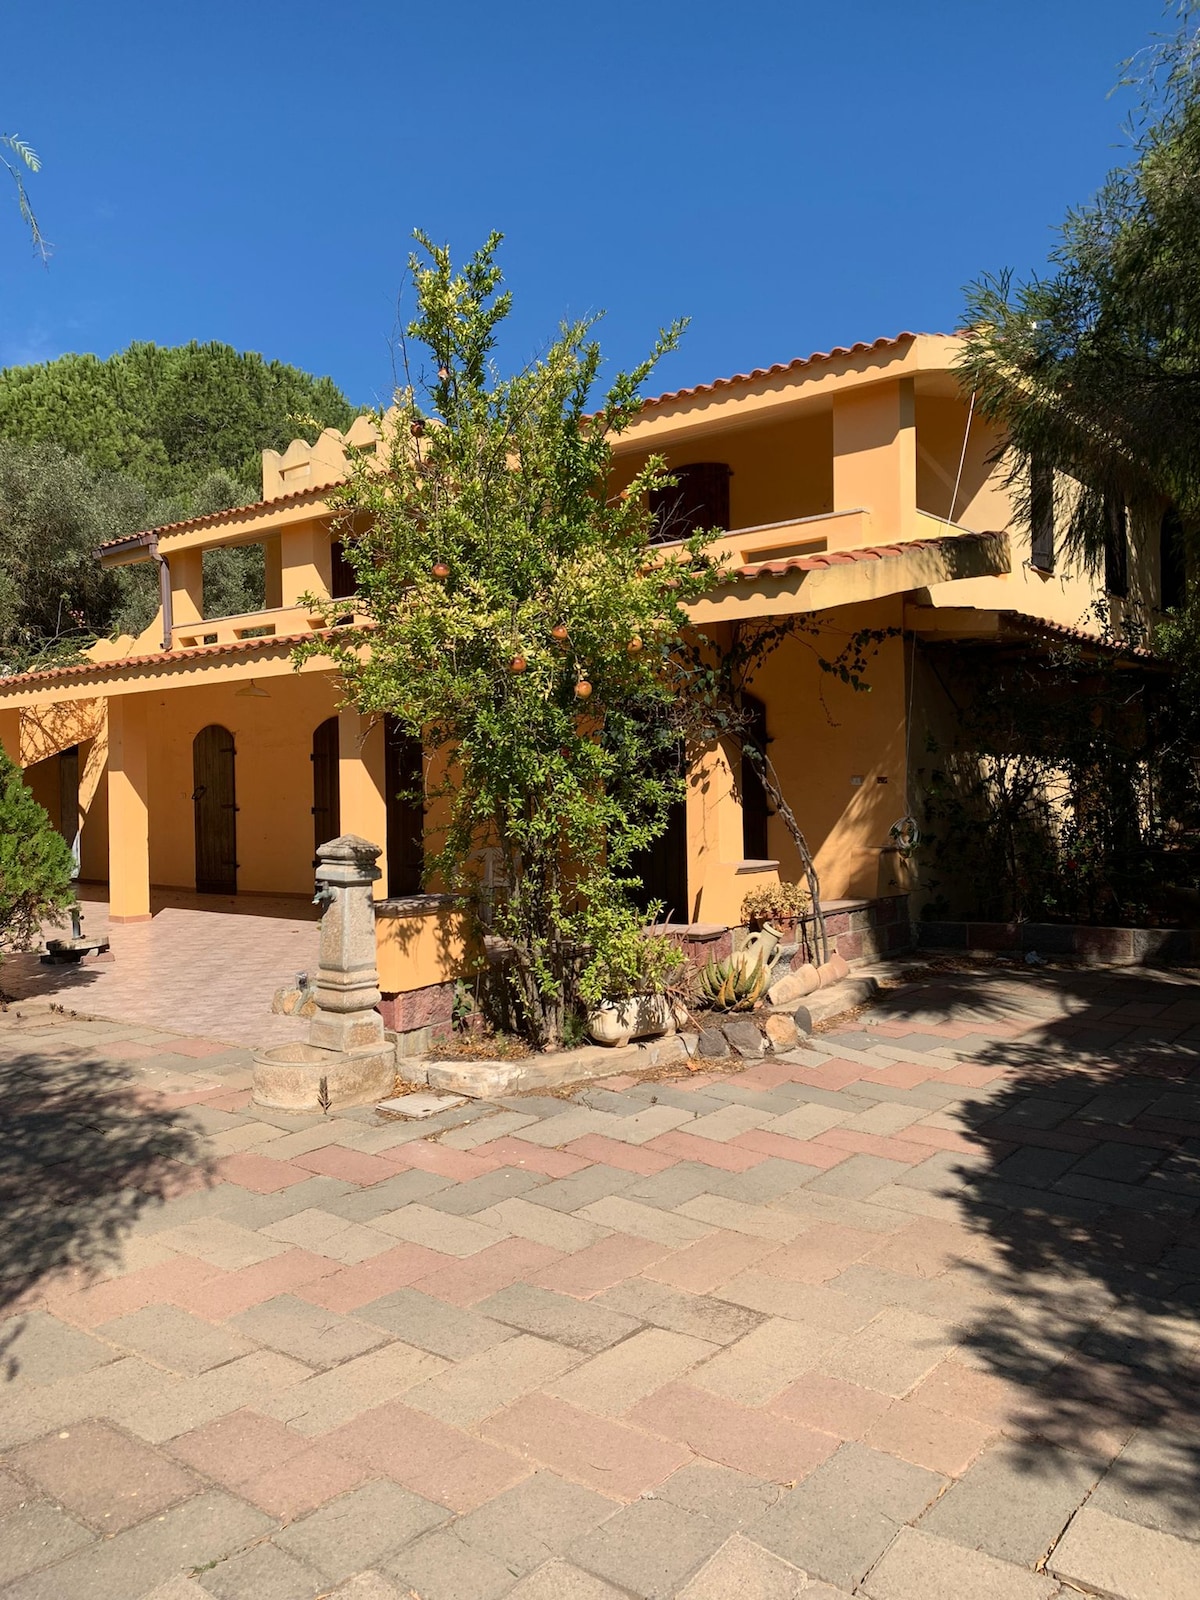
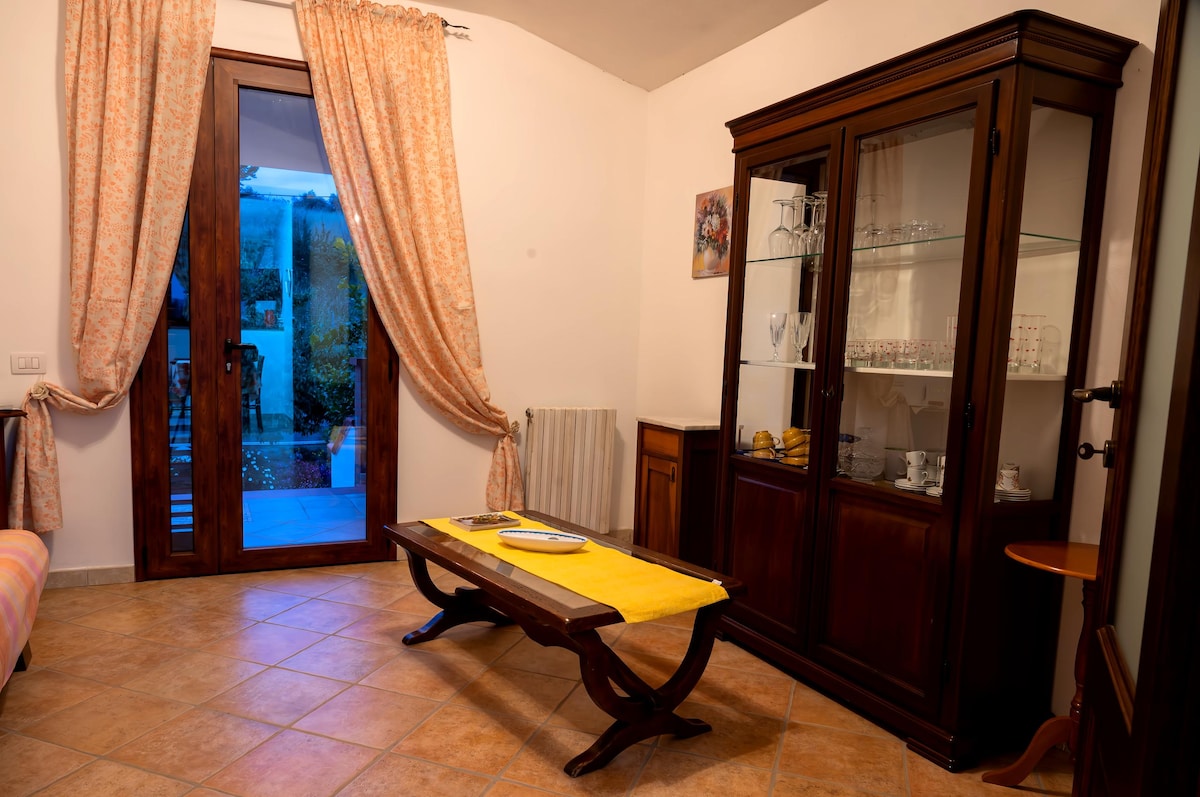
Castiadas, a jewel of Southeast Sardinia set between the ‘Sette Fratelli’ mountains and the paradisiacal beaches of Costa Rei, offers a natural scenery of rare elegance. It is a prestigious destination attracting an elite international clientele seeking brilliant white sand, turquoise waters, and exclusive tranquility. The Airbnb market here is extraordinarily profitable, featuring an average daily rate of €278. Visitors seek the quality of independent villas with pools and the charm of residences immersed in the Mediterranean scrub, generating a notable annual revenue of €64,655. Its pristine beauty and status as an elite destination ensure some of the highest profitability in Sardinia.
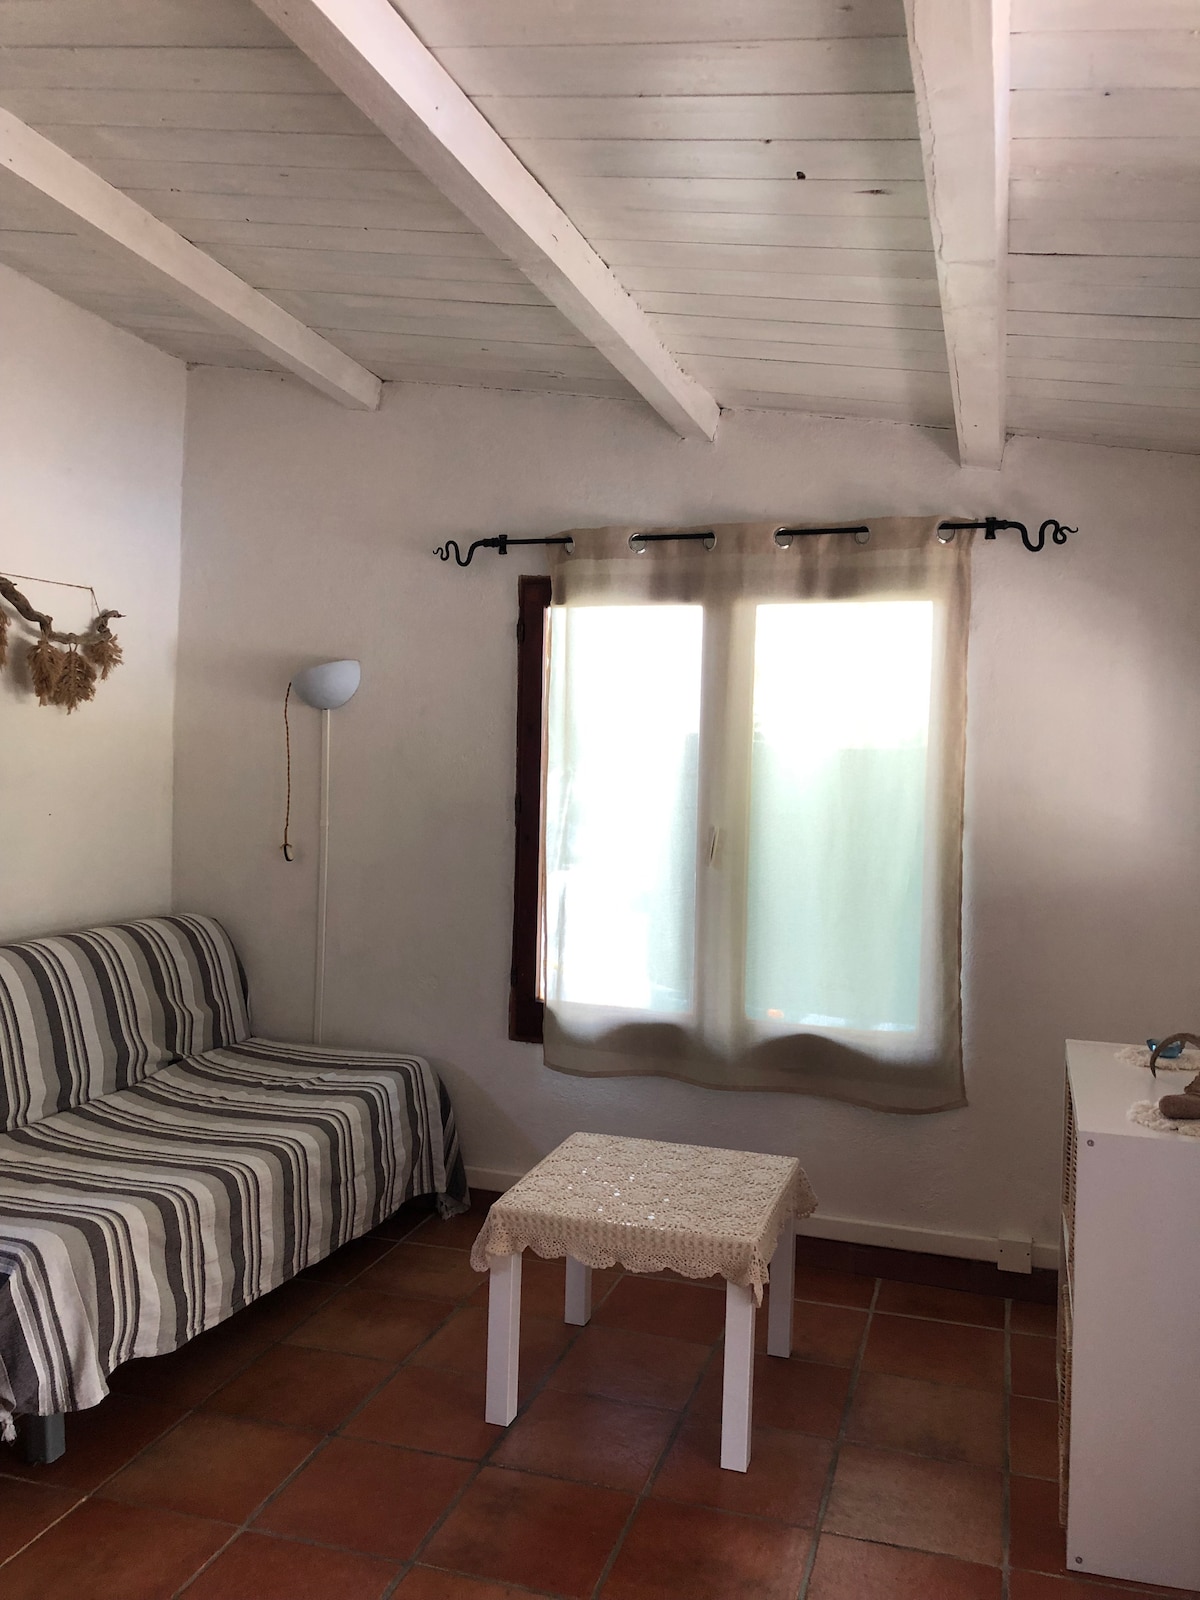
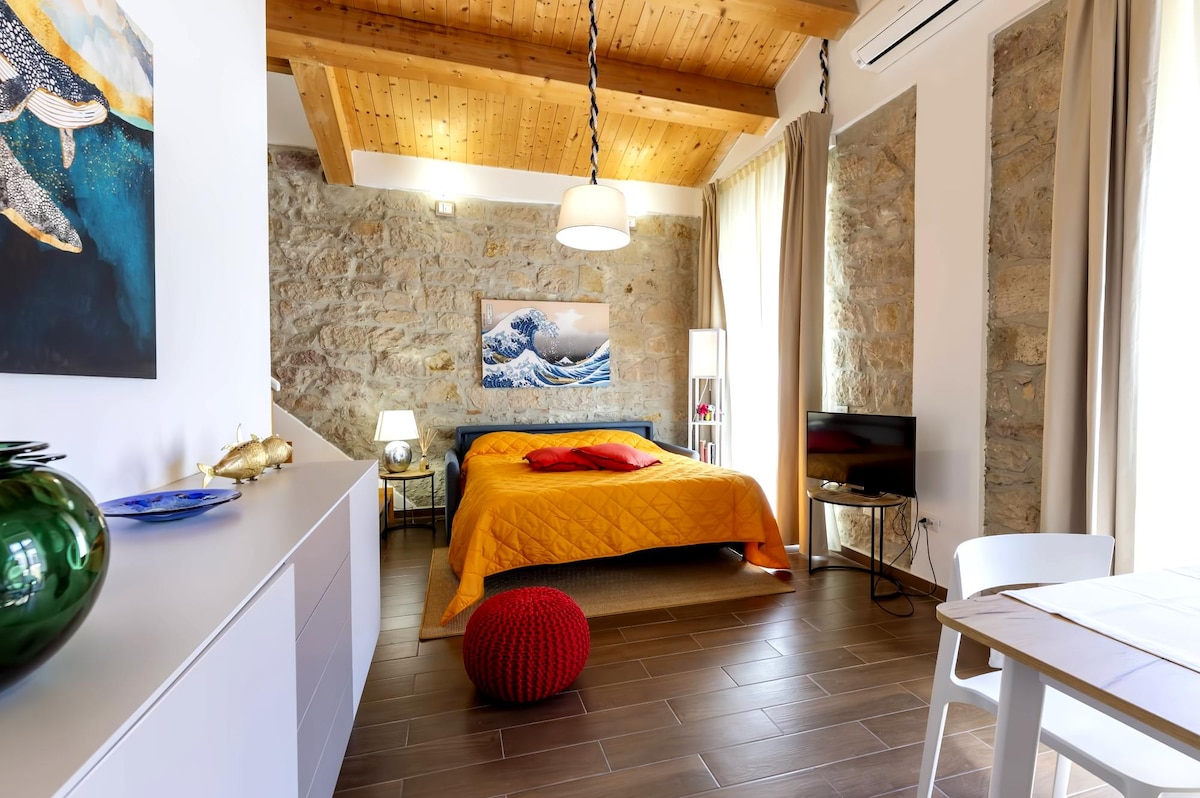
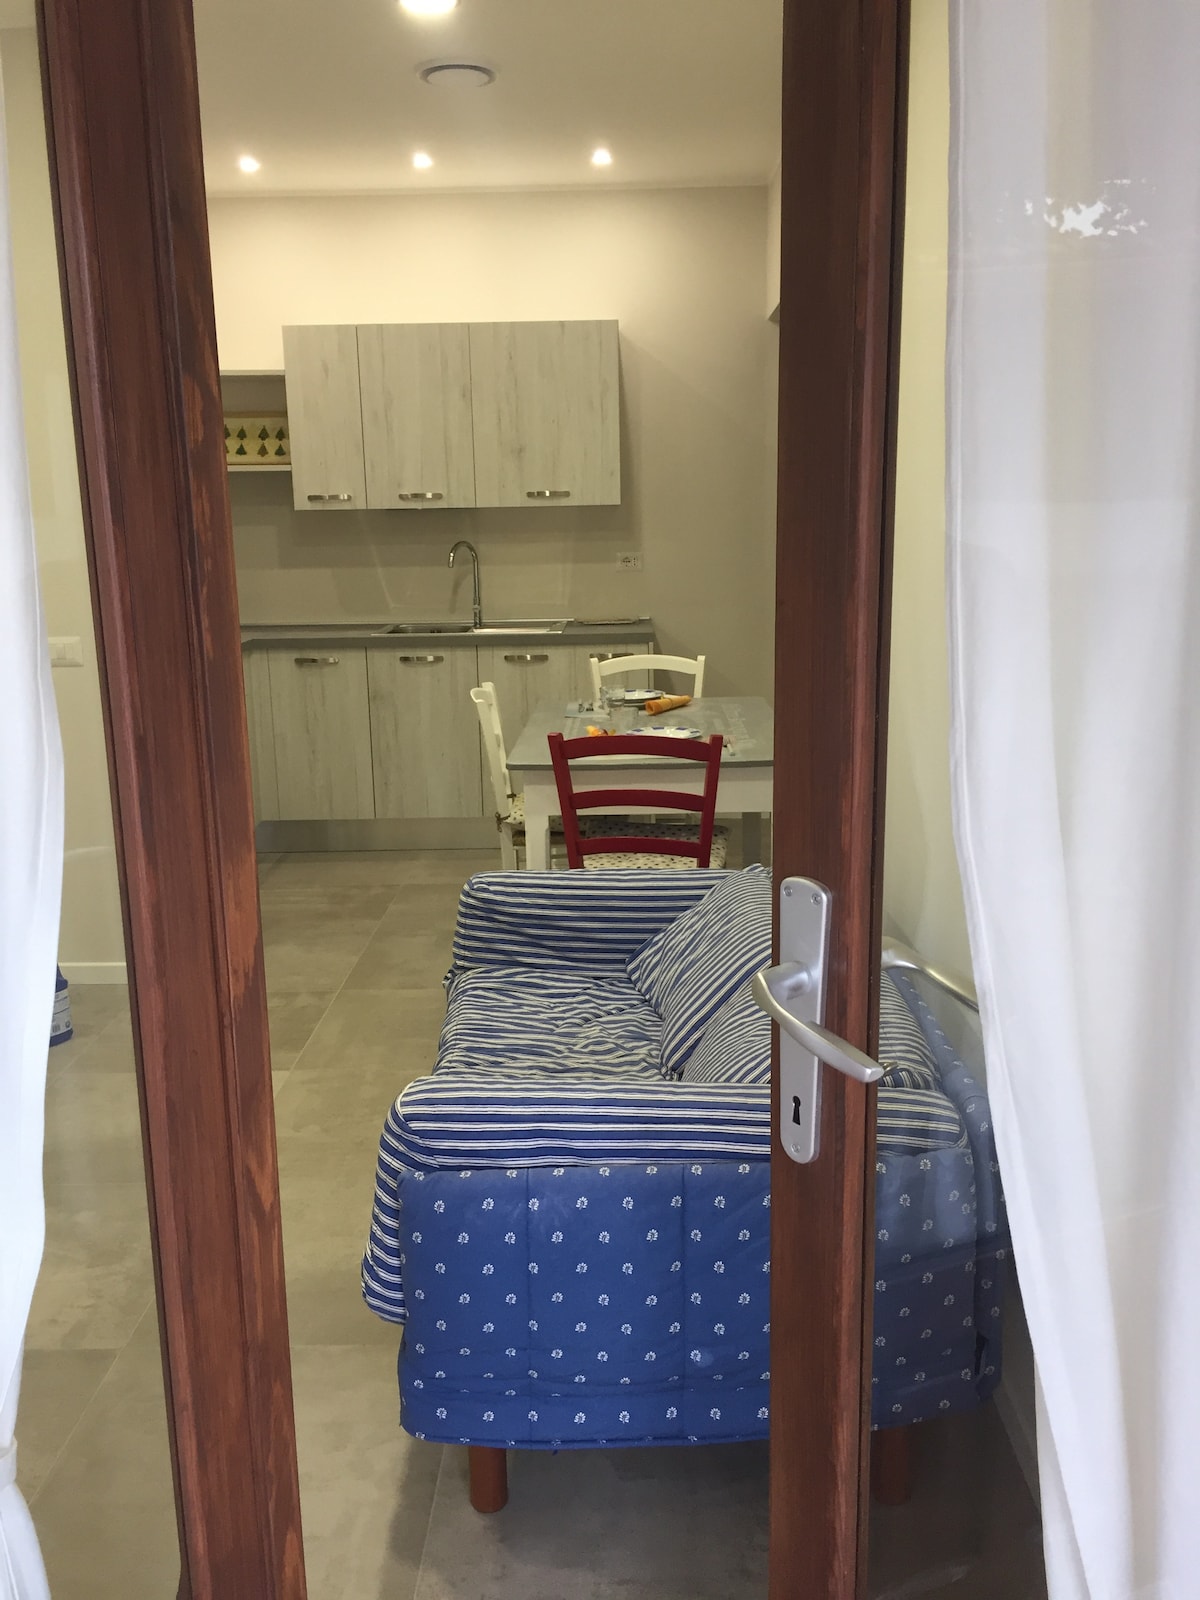
Featured Listings

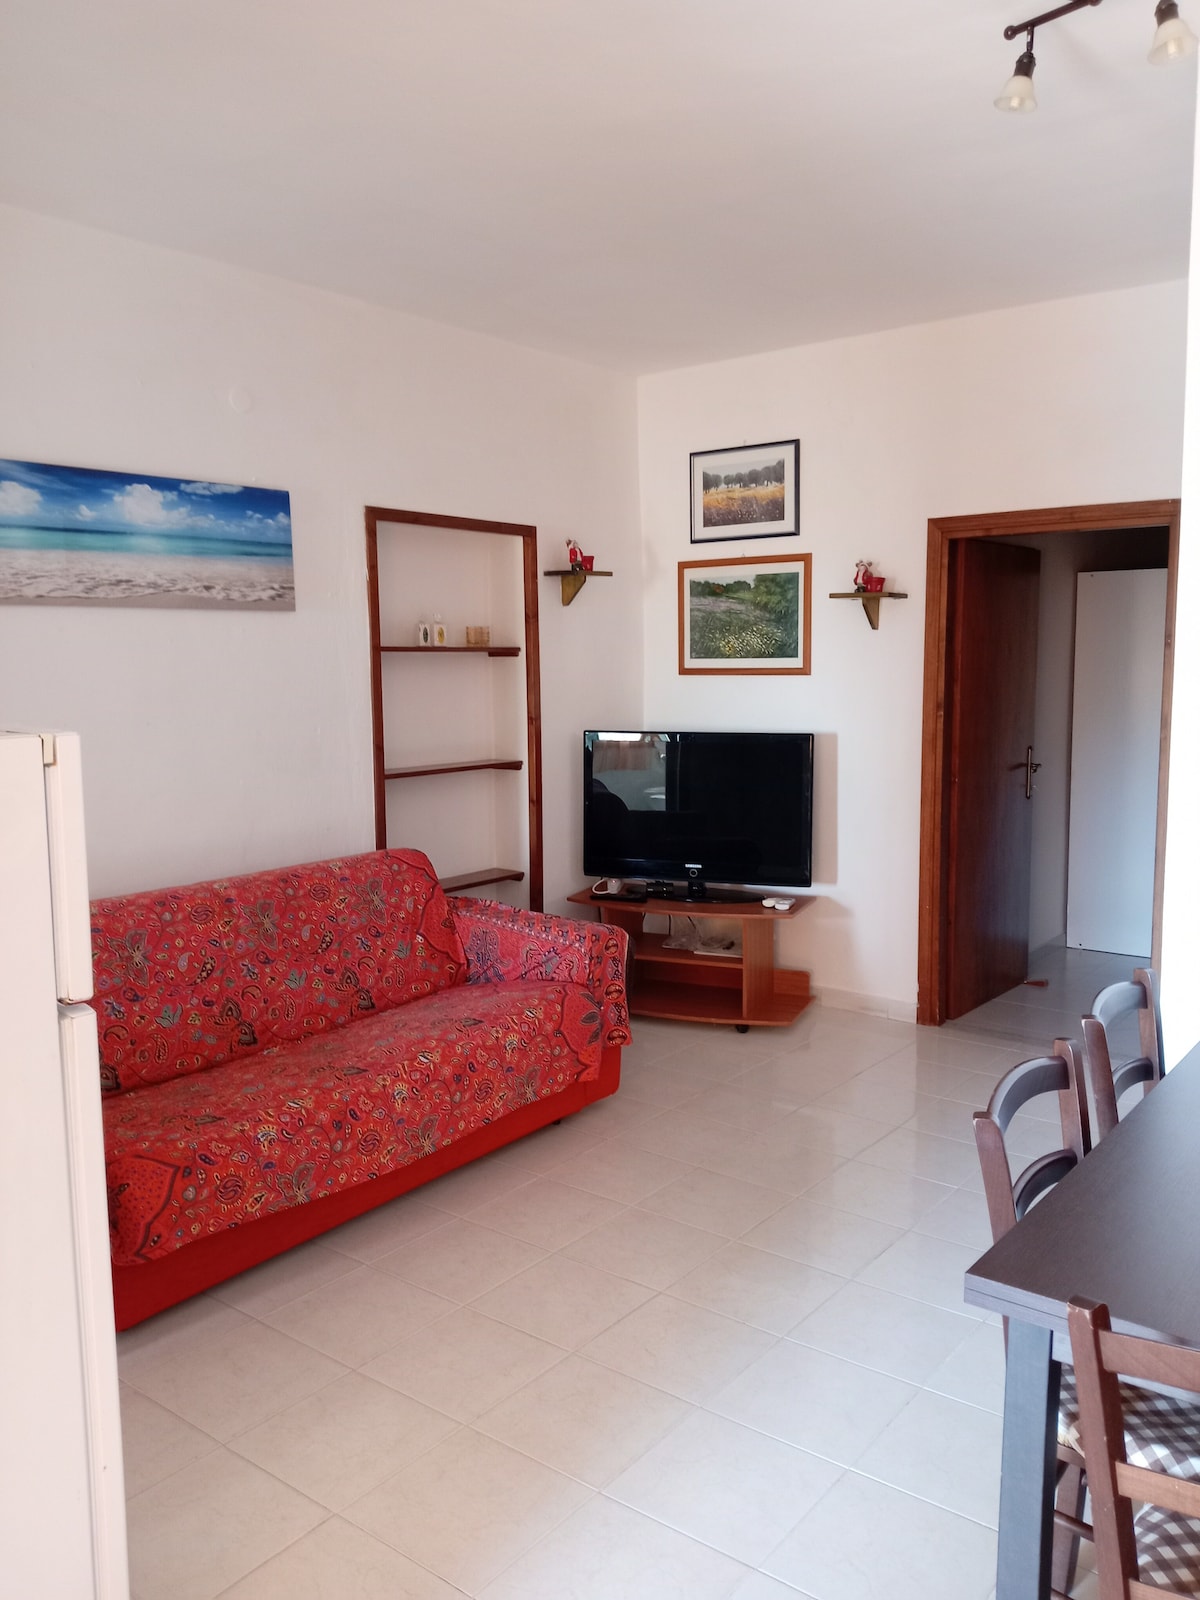
Domus de Maria, an authentic village famous for its Chia dunes and the crystalline waters of Southern Sardinia, offers a breathtaking natural setting among golden beaches and flamingo-inhabited lagoons. It is a top-tier destination attracting international tourism seeking relaxation, wild nature, and spectacular coastal panoramas. The Airbnb market here is high-performing, featuring an occupancy rate of 64%. Visitors appreciate the quality of villas immersed in greenery and the functionality of holiday homes near the sea, taking advantage of an average daily rate of €196. Its primordial beauty and strategic location ensure solid profitability.
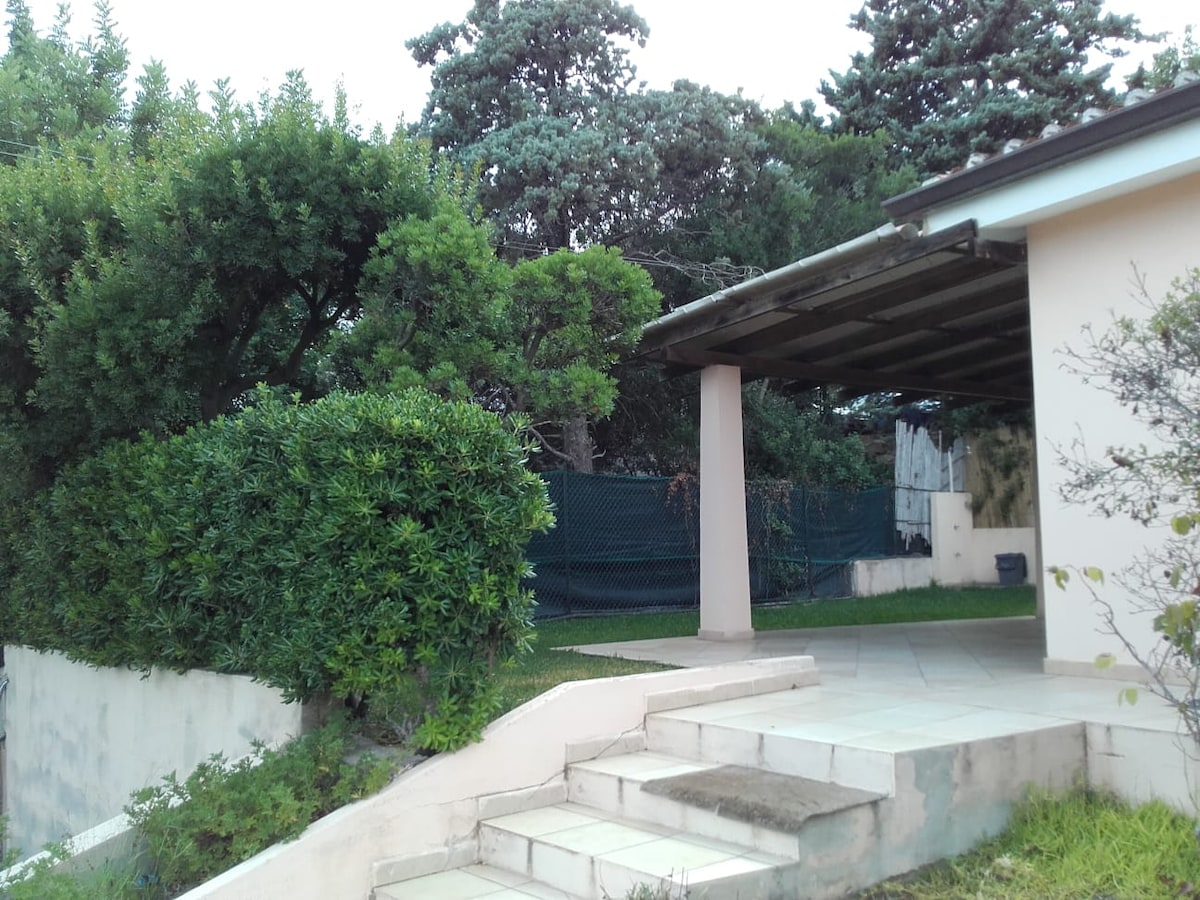
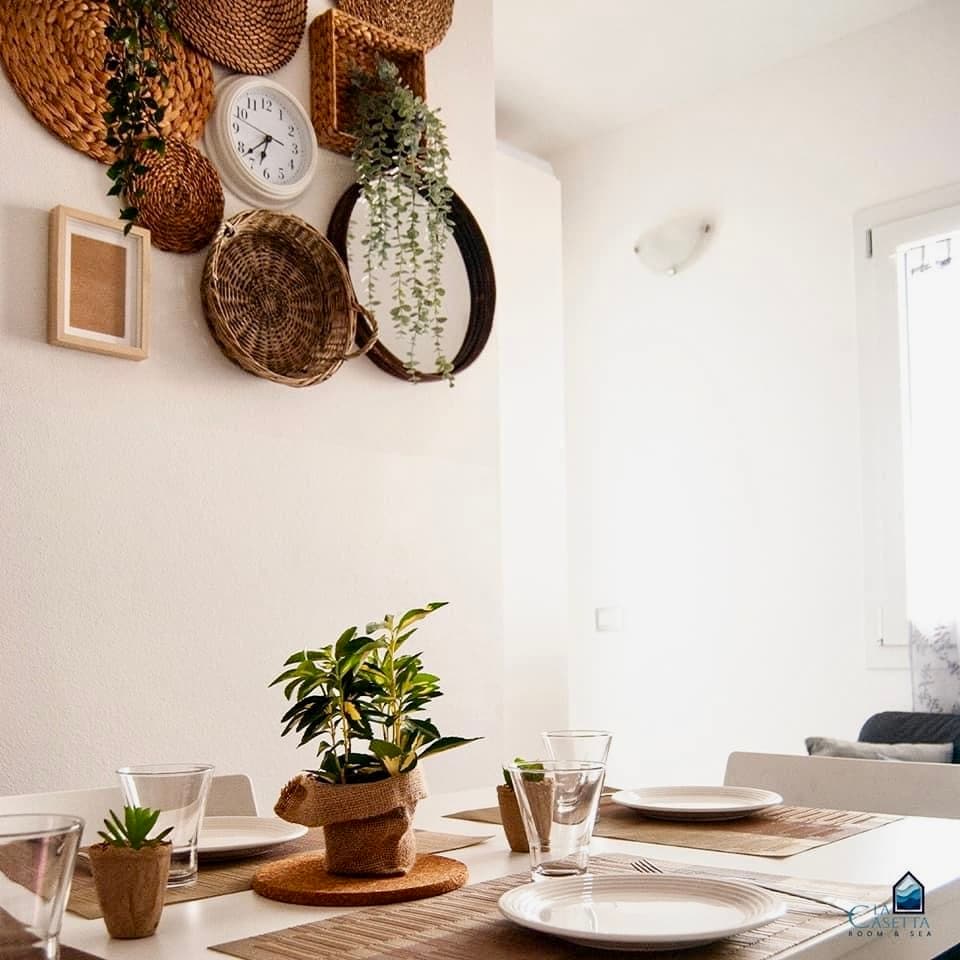
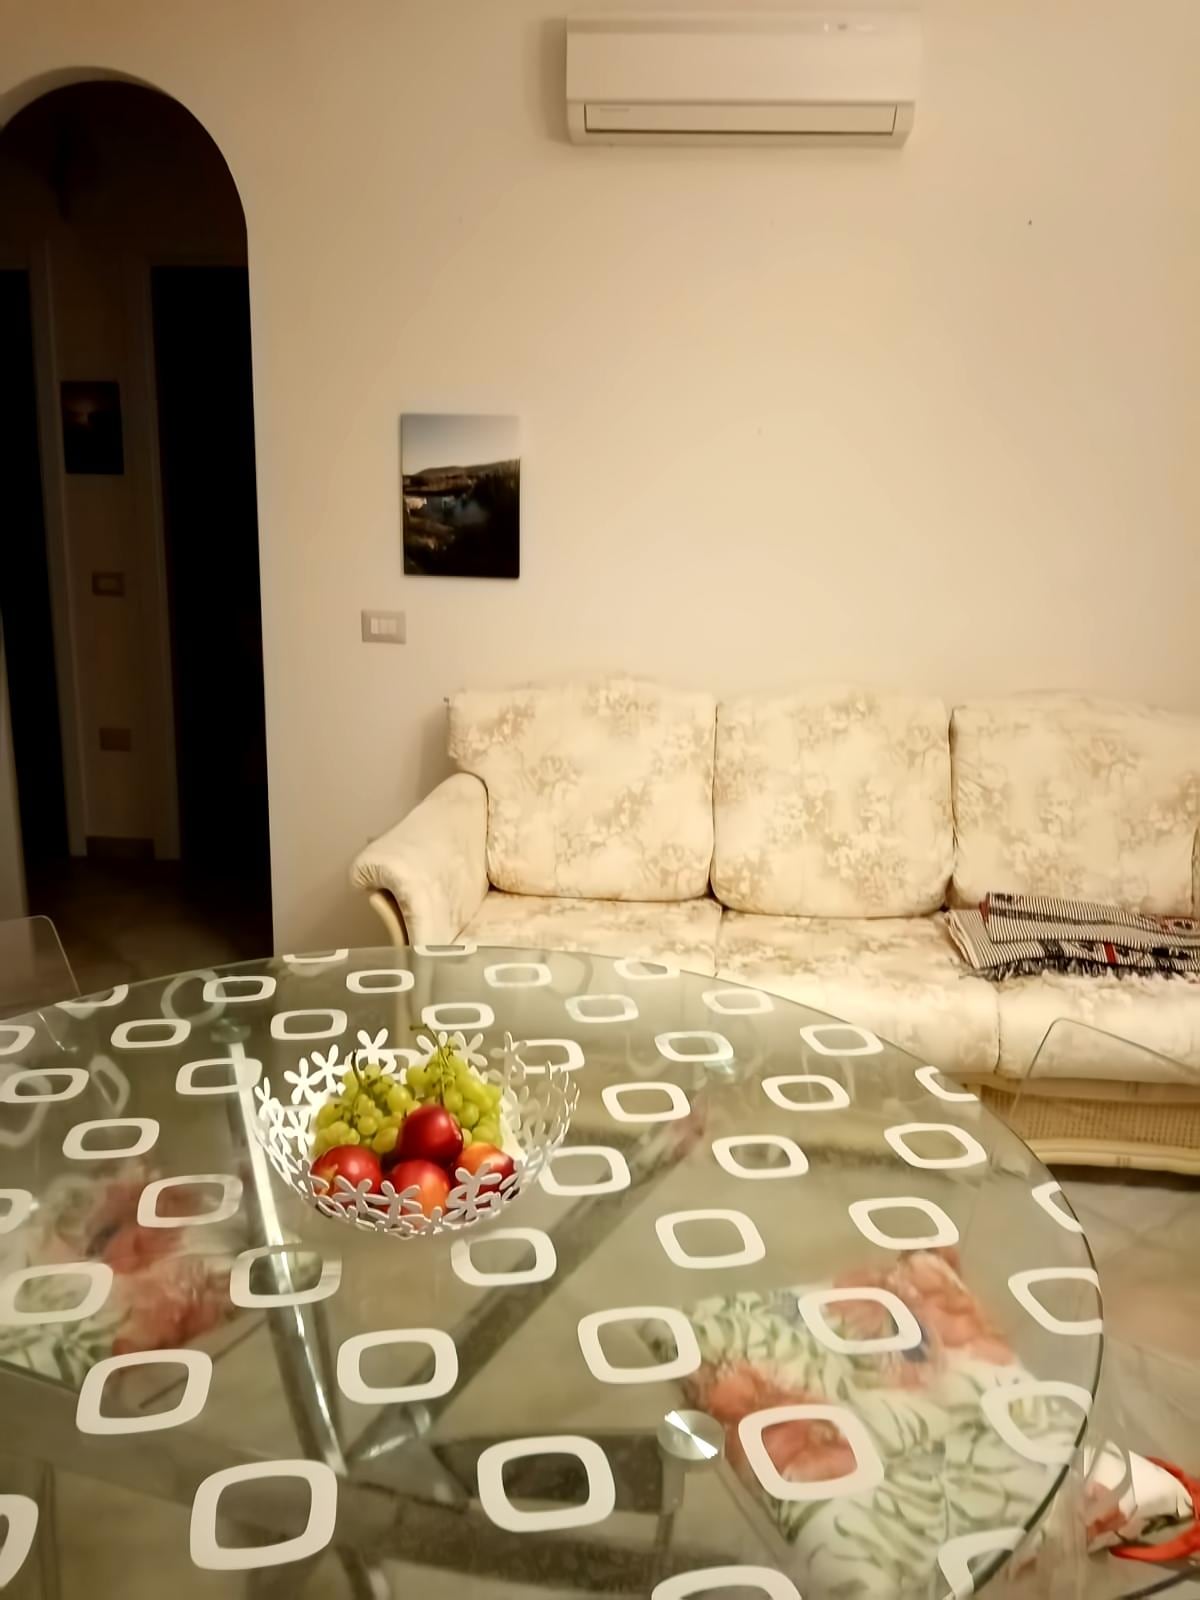
Featured Listings
Sant'Anna Arresi, a jewel of the Sulcis region overlooking the spectacular Porto Pino bay, enchants with its famous white-sand dunes and cobalt-colored sea. It is a vibrant destination combining the millenary culture of the downtown nuraghe with the wild beauty of the coast, attracting international tourism seeking relaxation and Sardinian authenticity. The Airbnb market here is solid and efficient, featuring an occupancy rate of 59%. Visitors seek the charm of independent holiday homes and the functionality of apartments near the village, generating an average annual revenue of €37,673. Its summer vitality and hospitable climate ensure stable profitability.
Featured Listings
Carloforte, a village of noble traditions on San Pietro Island, offers an enchanting setting with its colorful houses, quiet alleys, and cliffs overlooking the sea. It is a mythical destination attracting international tourism seeking absolute peace, Tabarchine culture, and excellent gastronomy ranging from tuna to couscous. The Airbnb market here is very active, featuring an occupancy rate of 52%. Visitors seek the character of apartments in the historic center and the exclusivity of residences immersed in olive groves, taking advantage of an average daily rate of €147. Its aura of an ‘island within an island’ and the beauty of the territory ensure steady profitability.
Featured Listings
Calasetta, the ‘White City’ suspended between green vineyards and the blue sea on the Sant'Antioco coastline, offers a setting of rare elegance with its lively harbor and Spanish tower. It is a prestigious destination attracting international tourism seeking relaxation, culture, and golden beaches like ‘Sottotorre’ and ‘Le Saline’. The Airbnb market here is solid and efficient, featuring an occupancy rate of 57%. Visitors appreciate the modernity of apartments near the coast and the charm of holiday homes in the old village, taking advantage of a competitive average daily rate. With an average annual revenue of €24,316, the town ensures stable profitability.
Featured Listings

Sant'Antioco, a millenary island and pearl of the Sulcis region, enchants with its fishing village, ancient catacombs, and wild cliffs watching the horizon. It is a character-filled destination attracting discovery tourism seeking Phoenician history, sea silk (‘bisso’) craftsmanship, and crystalline waters. The Airbnb market here is very active, featuring an occupancy rate of 58%. Visitors appreciate the central location of renovated apartments and the independence of villas immersed in the Mediterranean scrub, taking advantage of an average daily rate of €106. With an average annual revenue of €22,825, the city offers stable profitability sustained by its cultural dynamism.
Featured Listings
Iglesias, a noble medieval city in the heart of mining Sardinia, offers a unique monumental setting among its Pisan walls, the Porto Flavia mines, and the sea of Masua. It is a city vibrant with history and traditions attracting international tourism seeking adventure, industrial archaeology, and spectacular beaches. The Airbnb market here is very active and efficient, featuring an occupancy rate of 53%. Visitors appreciate the central location of historic apartments and the functionality of homes near the mining sites, taking advantage of a competitive average daily rate. With an average annual revenue of €20,593, the city ensures stable profitability sustained by its unique charm.
Featured Listings
Get Live Sud Sardegna, Sardegna Market Intelligence
Discover detailed Sud Sardegna, Sardegna Airbnb Analytics and explore real-time market data to make accurate investment decisions.
Explore Real-time Analytics