Airbnb Occupancy Rates in Modena, Emilia Romagna(June 2026)
The cliché that Modena is only a Ferrari museum and balsamic-vinegar stop on the way to Bologna understates what the data show: guests who actually sleep here book for opera at the Teatro Comunale, Motor Valley factory tours, university conferences, and Emilia’s food belt—not for a two-hour parking-lot selfie. That distinction matters because overnight demand behaves differently from hub spillover.
Citywide averages sit at €23,442 in annual revenue per listing, 58% occupancy, €110 per night, and 528 active Airbnb listings as of June 2026—a profile shaped by compact centro stock, Sant'Agostino–Bastiglia residential belts, and car-hire guests staging Maranello, Sassuolo ceramics routes, and Parmigiano-Reggiano visits.
For hosts, the implication is clear: price and furnish for multi-night Motor Valley itineraries and weekday business, not only weekend day-trippers who never open a suitcase in Modena.
Modena Airbnb Market Map (June 2026)
Modena Market Performance
Period: June 2025 - May 2026
Is Airbnb a Good Investment in Modena?
YES — Modena rewards operators who treat Emilia’s Motor Valley as a standalone overnight market with Bologna-scale compliance discipline, not as a discount satellite where you can skip CIR, CIN, and tourist-tax filing.
Who should invest
- Operators buying one- or two-bedroom flats near walkable centro, the university zone, or fast links toward the A1 and Maranello corridors.
- Hosts comfortable with Emilia-Romagna paperwork (Accesso Unitario, ROSS1000 CIR, BDSR CIN, municipal tourist tax) and Modena’s tighter non-imprenditorial unit cap than Bologna.
- Investors who model trade-fair and automotive-calendar weeks alongside opera and food-tourism peaks—not only August city breaks.
- Buyers who accept lower headline ADR than Milano or Firenze in exchange for Motor Valley positioning and sensible centro acquisition costs.
Who should skip
- Pure trophy hunters expecting Florence-level leisure premiums on every street without elevator access, AC, or condominium tolerance.
- Portfolio scalers planning four-plus units under non-imprenditorial rules without switching to the correct imprenditoriale / locazione breve path.
- Operators who want only Bologna spillover with no local demand story—if guests never sleep in Modena, occupancy will track hub calendars, not Modena’s.
- Hosts unwilling to run Alloggiati Web, ROSS1000 flows, and imposta di soggiorno before publishing.
| Market | Avg revenue | Occupancy | Rules snapshot |
|---|---|---|---|
| Modena | €23,442 | 58% | EMR CIR + CIN; non-imprenditorial cap typically two furnished tourist units. |
| Bologna | €35,453 | 67% | Same regional stack; three-unit non-imprenditorial ceiling. |
| Milano | €36,031 | 64% | Lombardy SUAP; highest northern corporate ADR. |
| Firenze | €43,466 | 65% | Tighter leisure supply; monument-led pricing. |
| Parma | €18,079 | 58% | Food-tourism peer; similar EMR registration path. |
Get Live Modena Market Intelligence
Discover detailed Modena Airbnb Analytics and explore real-time market data to make accurate investment decisions.
Explore Real-time Analytics
How Often Will Your Airbnb Be Booked in Modena?
View Demand Patterns →Occupancy rates directly impact your revenue potential. Understanding demand patterns helps you set realistic expectations and optimize your availability strategy.
The current average occupancy rate in Modena is 58%, meaning properties are booked for about 213 nights per year. However, occupancy varies significantly based on property quality and management. Here's what you can expect:
Airbnb Occupancy Tiers in Modena
Premium(Top 10%) | High-performing(Top 25%) | Average(Median) | Low-performing(Bottom 25%) |
|---|---|---|---|
| 89% | 75% | 56% | 31% |
*High desirability & optimized availability | *Good market fit & guest satisfaction | *Standard market performance | *Higher vacancy, optimization needed |
Seasonal Occupancy Patterns in Modena
March, April
Highest demand and occupancy rates. Perfect for premium pricing strategies and maximizing revenue. Consider longer minimum stays and higher rates.
August, July
Moderate demand with balanced pricing opportunities. Good for attracting budget-conscious travelers while maintaining reasonable occupancy rates.
December, November
Lower demand requires competitive pricing and creative marketing. Focus on local events, extended stay discounts, and targeting specific traveler segments.
How Much Can You Earn with Airbnb in Modena?
Calculate Earnings →One of the most common questions for potential Airbnb hosts in Modena is about earning potential. Let's break down the revenue patterns and what you can realistically expect to earn.
Monthly Revenue Trends in Modena
Best-in-class Airbnb properties (top 10%) in Modena achieve around €35,254 annually, while strong performers (top 25%) earn at least €24,477. Typical properties generate about €15,880 per year, and entry-level listings (bottom 25%) see earnings near €7,278, often with room for optimization. Keep in mind, these are market averages—your actual earnings can be even higher depending on your property's location, bedrooms, guest capacity, and unique amenities.
Want to see how your listing could perform? Create a free account to unlock personalized analytics and explore exclusive insights in our app!
What Can You Learn from Top-Performing Airbnbs in Modena?
View Top Performers →Studying successful properties provides valuable insights for your own Airbnb strategy. Here are the top-performing listings in Modena and what makes them successful.
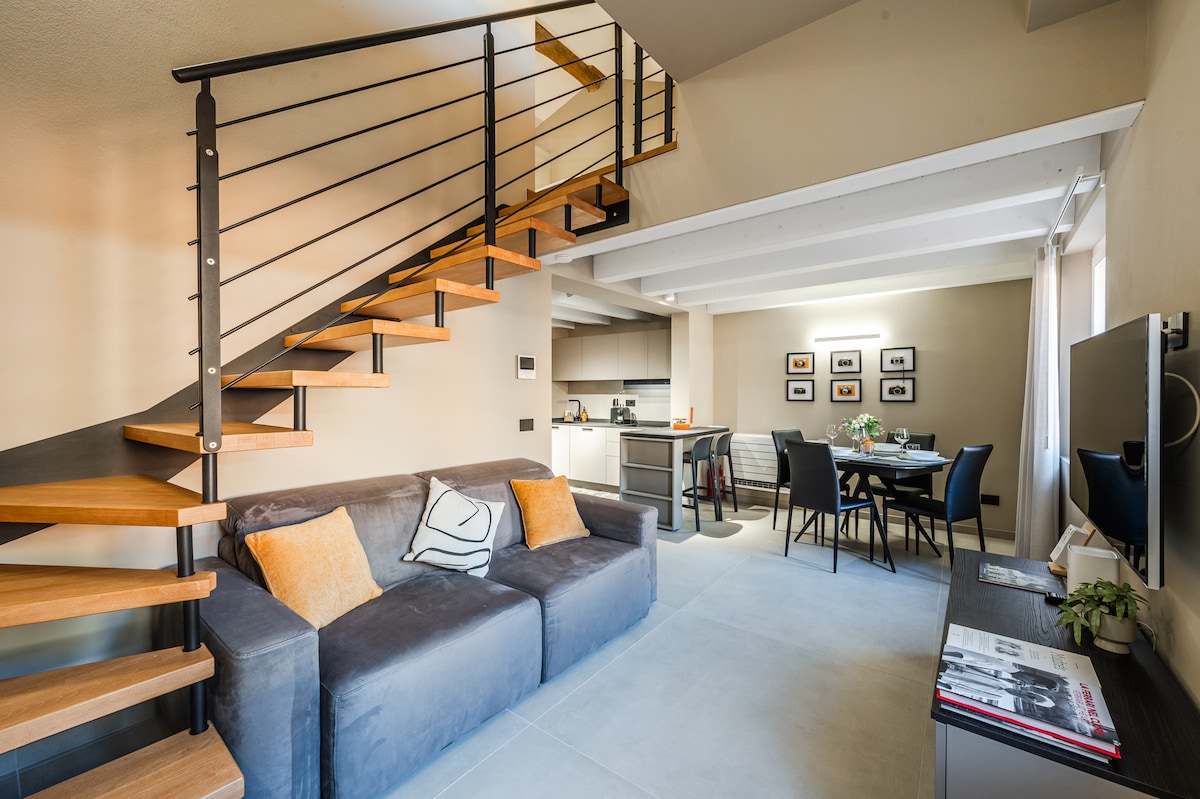

![Top performing Airbnb: [City Center] "Il Terrazzino" apartment in Modena](https://a0.muscache.com/im/pictures/hosting/Hosting-1205781972307839519/original/dc87a2d7-b701-4ebf-944c-3f7fb7be401d.jpeg)
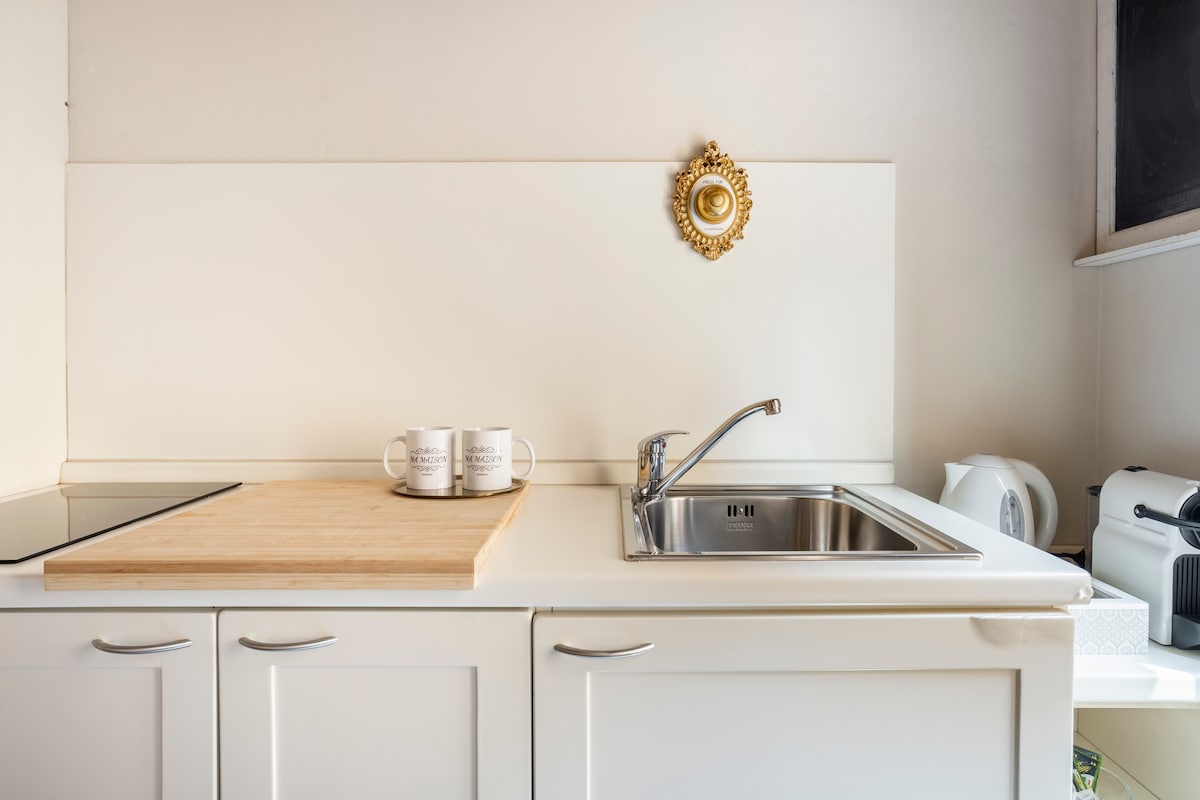
![Popular Airbnb listing: [Luxury & Secret View] - Swing in the Square in Modena](https://a0.muscache.com/im/pictures/miso/Hosting-988535475572020787/original/00834f90-92c5-4a78-a6d3-7171b3b47981.jpeg)
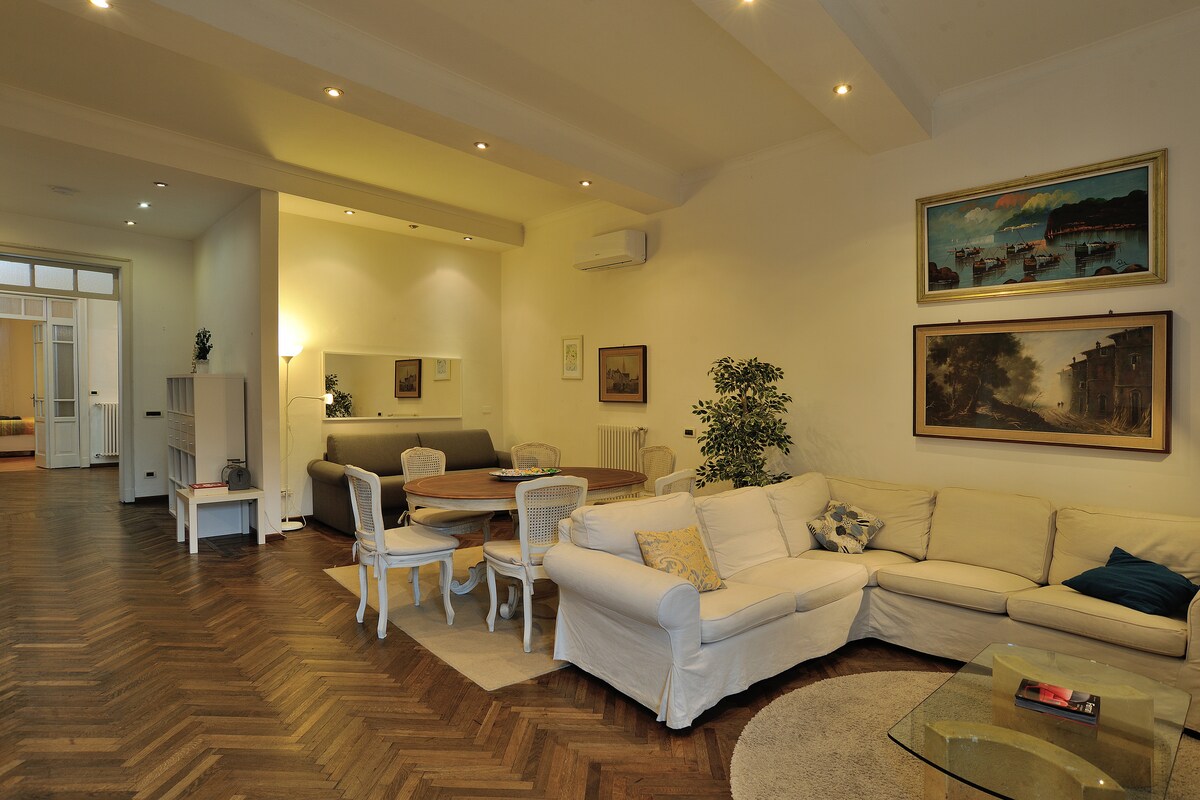
![Successful Airbnb property: [Wonderful garden, 5min from the centre & Garage] in Modena](https://a0.muscache.com/im/pictures/hosting/Hosting-U3RheVN1cHBseUxpc3Rpbmc6MTM5NTQ3NTAyNDA1Mjk5NjA3NA==/original/c3831050-5c93-4a8b-abd0-0e270067af9b.jpeg)
Modena Market Analysis
Motor Valley overnight demand—not just Bologna spillover
Modena’s booking curve is driven by guests who sleep in the city while touring Ferrari and Maserati museums, Autodromo di Imola weekends, balsamic producers in Spilamberto, and Parmigiano dairies toward Parma—not by anonymous traffic that only eats lunch and returns to Bologna. That shows up in stay length: two- to four-night blocks cluster around centro storico (Duomo, Piazza Grande, Ghirlandina), Sant'Agostino–Madonnina, and Buon Pastore corridors where walkable osterie and opera nights justify a base camp. Car-hire families price parking, luggage access, and clear check-in windows more harshly than canal views; operators who disclose stairs, ZTL access, and meeting points keep reviews healthier than those selling only “supercar country.” Compare Modena’s €110 with Milano before assuming every Emilia week looks like fair season in Lombardy—Modena wins on Motor Valley positioning at lower basis costs, not on corporate mid-week peaks.
Seasonality and unit fit
Spring and autumn carry university terms, design and automotive trade visitors, and food-tourism weekends; summer mixes international city breaks with short opera and festival windows. Major motorsport and factory-tour calendars can reprice specific weeks—underwrite the full year. Compact two-bedroom apartments with AC, fast Wi-Fi, and desk space outperform large suburban homes for this guest pool; ground-floor or elevator access matters in the porticoed core. Before closing, confirm condominium rules, whether you run non-imprenditorial furnished tourist use (typically up to two units in Modena) or an imprenditoriale path, and that ROSS1000 → CIN → tourist tax is budgeted alongside revenue targets.
What Are the Airbnb Regulations in Modena?
Understanding local regulations is crucial for operating a successful Airbnb. Let's examine the compliance landscape and what you need to know about licensing requirements in Modena.
Current Regulatory Status
69% compliance indicates strict regulatory enforcement in this market.
Work through this sequence before taking bookings in Modena:
- Classify activity: appartamento ammobiliato uso turistico (non-imprenditorial, typically up to two units in Modena) vs locazione breve imprenditoriale—paths differ on SUAP, insurance, and scaling rules.
- File the required comunicazione di inizio attività through regional Accesso Unitario and the Comune SUAP online channel when the Comune requires it for your classification (appartamenti ammobiliati uso turistico).
- Register in ROSS1000 and obtain CIR, then request CIN on BDSR; display CIN on every ad and at the property (regional CIN/CIR circular).
- Log guests on Alloggiati Web within 24 hours and keep tourist-flow data current in ROSS1000.
- Register for imposta di soggiorno, collect qualifying municipal rates, and remit per Comune schedules (imposta di soggiorno hub, 2025 tariffs, FAQ).
- Install safety hardware tied to CIN issuance and confirm cedolare secca (or business tax if you exceed national apartment thresholds on Agenzia delle Entrate — locazioni brevi).
- Verify condominium rules and L.R. 10/2025 urbanistic constraints before marketing.
Comune di Modena
Modena routes short-let operators through SUAP and Accesso Unitario for opening communications, then coordinates CIR, CIN, Alloggiati Web, and imposta di soggiorno reporting. The municipal appartamenti ammobiliati per uso turistico page is the starting point; practical steps align with Emilia-Romagna regional guidance on normativa appartamenti turistici.
National and Emilia-Romagna rules
Italy caps each contract at 30 days per stay; there is no uniform national annual night limit like France or Spain. CIN is mandatory under D.L. 145/2023 art. 13-ter, with safety equipment tied to issuance (Ministero del Turismo BDSR FAQ). Emilia-Romagna governs extralberghiero structures under L.R. 16/2004 and locazione breve planning under L.R. 10/2025—confirm cadastral category and condominium tolerance before closing.
How Competitive is the Airbnb Market in Modena?
Analyze Competition →Understanding market competition is crucial for any potential Airbnb host. Let's examine the supply dynamics and what they mean for your investment strategy. The Modena Airbnb market currently features 528 active listings with an average occupancy rate of 58%. This represents a moderately competitive market environment where balanced supply and demand create opportunities for strategic positioning.
Airbnb Listings: Change Over Time
Strategic Entry into Modena Airbnb Market
Competitive Positioning
- Focus on mid-market with competitive pricing
- Balance quality and competitive pricing
- Target mid-range market segment
Market Opportunities
- Strong demand supports premium pricing strategies
- Rapid market growth creates new opportunities
- Established market with proven demand patterns
What Should You Charge for Your Airbnb in Modena?
Smart Pricing Tools →Pricing is one of the most critical decisions for Airbnb success. Let's analyze the current pricing landscape and help you understand what rates you can realistically charge.
The current average daily rate in Modena is €110 per night. However, pricing varies significantly based on property quality and location. Here's what different property tiers typically charge:
Airbnb Pricing Tiers in Modena
Premium(Top 10%) | High-performing(Top 25%) | Average(Median) | Budget(Bottom 25%) |
|---|---|---|---|
| €160per night | €119per night | €91per night | €69per night |
*Top locations, big properties, premium amenities | *Good property management, highly rated | *Standard market performance | *Basic properties, less desirable locations |
Is It Profitable to Start an Airbnb in Modena?
Investment Analysis →Understanding the profitability potential is crucial for any Airbnb investment decision. Let's analyze the revenue performance and profit margins in the Modena market to help you make informed financial decisions.