Airbnb Occupancy Rates in Roma, Lazio(July 2026)
Few cities concentrate world heritage, state visitors, and weekend city-break demand in a single walkable core the way Rome does. For short-term rental investors, that density is both the opportunity and the challenge: competition is fierce, but the guest pool never really disappears.
On current data, Rome averages €47,639 in annual revenue per listing, 70% occupancy, and €187 per night, with 24,538 active Airbnb listings as of July 2026. Those figures span everything from Pantheon-adjacent studios to EUR business apartments—citywide averages hide wide gaps between streets.
Italy’s largest STR inventory means benchmarks are easy to find; winning here is about compliance, positioning, and guest experience—not simply being listed.
Roma Airbnb Market Map (July 2026)
Roma Market Performance
Period: July 2025 - June 2026
Is Airbnb a Good Investment in Roma?
YES — Rome belongs on any serious Italy short-term rental shortlist, provided you budget for CIN registration, tourist tax, and professional operations in a crowded centre.
Rome tends to work best if you:
- Want maximum liquidity and comparables (no other Italian city matches Rome’s listing depth).
- Can operate year-round—not only summer—with pricing tuned to spring, autumn, and event weekends.
- Are willing to classify the activity correctly (affitto breve vs alloggio ad uso turistico) before publishing.
Against other major Italian markets, Rome trades per-listing revenue against scale. Venice often shows higher averages (€49,741 revenue, 63% occupancy) on fewer listings; Milan leans corporate (€35,728, 64%); Florence and Bologna are smaller but intense art-and-university markets. Rome’s edge is volume plus year-round cultural demand, not the highest ADR on the peninsula.
| Market | Avg revenue | Occupancy | ADR proxy |
|---|---|---|---|
| Rome | €47,639 | 70% | €187 |
| Milan | €35,728 | 64% | — |
| Florence | €43,927 | 66% | — |
| Venice | €49,741 | 63% | — |
| Bologna | €36,317 | 68% | — |
Italy does not impose a national 120- or 180-day letting cap like several other European countries; the burden here is registration, tax, and—depending on classification—SUAR and CIR paperwork.
Get Live Roma Market Intelligence
Discover detailed Roma Airbnb Analytics and explore real-time market data to make accurate investment decisions.
Explore Real-time Analytics
How Often Will Your Airbnb Be Booked in Roma?
View Demand Patterns →Occupancy rates directly impact your revenue potential. Understanding demand patterns helps you set realistic expectations and optimize your availability strategy.
The current average occupancy rate in Roma is 70%, meaning properties are booked for about 255 nights per year. However, occupancy varies significantly based on property quality and management. Here's what you can expect:
Airbnb Occupancy Tiers in Roma
Premium(Top 10%) | High-performing(Top 25%) | Average(Median) | Low-performing(Bottom 25%) |
|---|---|---|---|
| 95% | 86% | 70% | 46% |
*High desirability & optimized availability | *Good market fit & guest satisfaction | *Standard market performance | *Higher vacancy, optimization needed |
Seasonal Occupancy Patterns in Roma
June, April
Highest demand and occupancy rates. Perfect for premium pricing strategies and maximizing revenue. Consider longer minimum stays and higher rates.
August, February
Moderate demand with balanced pricing opportunities. Good for attracting budget-conscious travelers while maintaining reasonable occupancy rates.
January, December
Lower demand requires competitive pricing and creative marketing. Focus on local events, extended stay discounts, and targeting specific traveler segments.
How Much Can You Earn with Airbnb in Roma?
Calculate Earnings →One of the most common questions for potential Airbnb hosts in Roma is about earning potential. Let's break down the revenue patterns and what you can realistically expect to earn.
Monthly Revenue Trends in Roma
Best-in-class Airbnb properties (top 10%) in Roma achieve around €76,458 annually, while strong performers (top 25%) earn at least €49,650. Typical properties generate about €30,372 per year, and entry-level listings (bottom 25%) see earnings near €15,916, often with room for optimization. Keep in mind, these are market averages—your actual earnings can be even higher depending on your property's location, bedrooms, guest capacity, and unique amenities.
Want to see how your listing could perform? Create a free account to unlock personalized analytics and explore exclusive insights in our app!
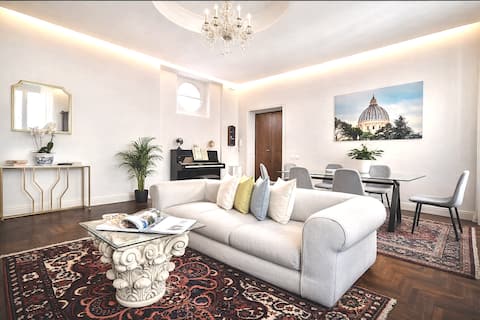
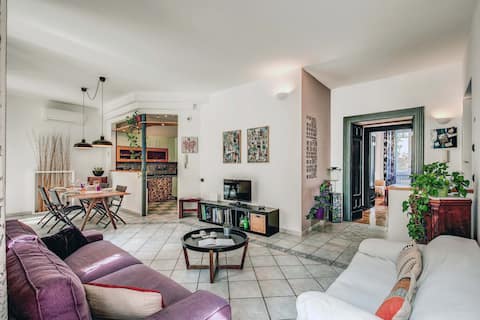
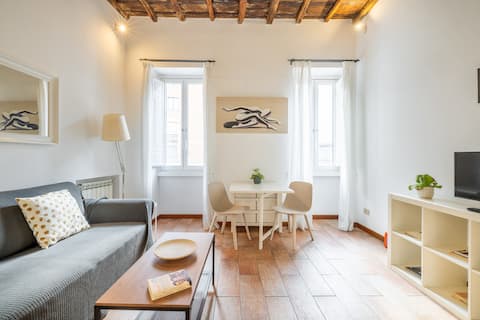
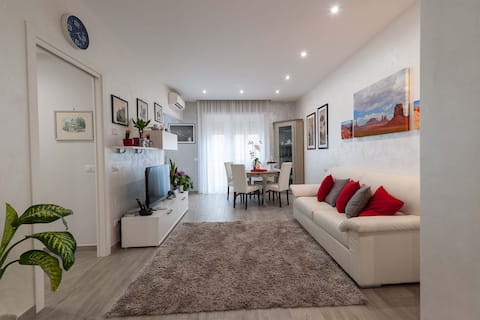
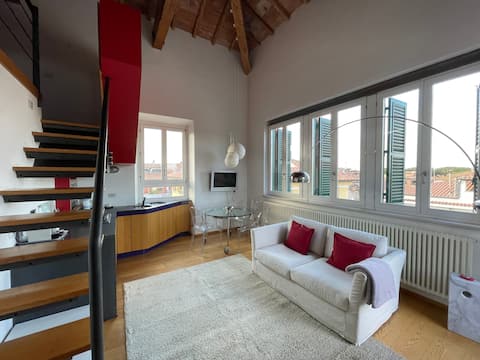
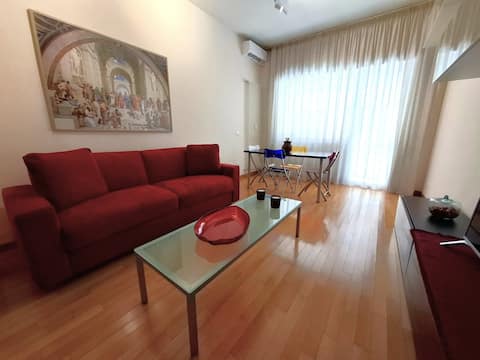
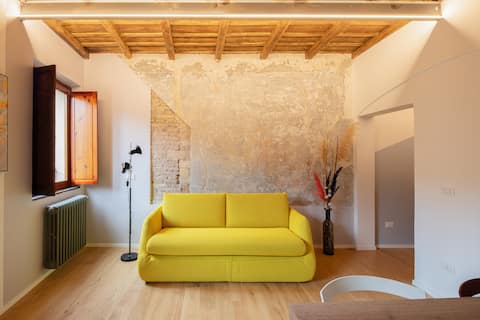
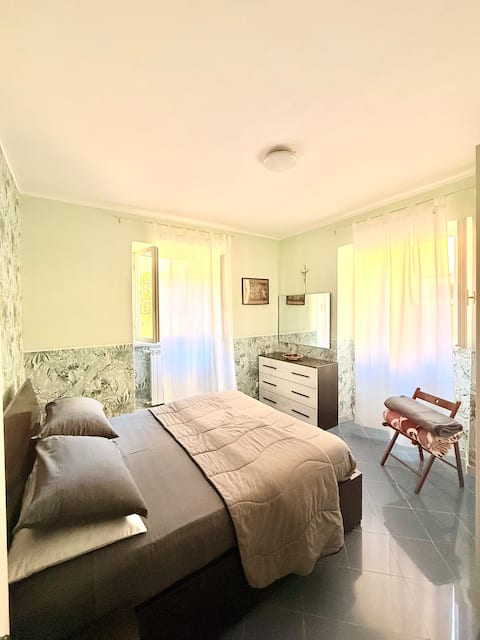
What Can You Learn from Top-Performing Airbnbs in Roma?
View Top Performers →Studying successful properties provides valuable insights for your own Airbnb strategy. Here are the top-performing listings in Roma and what makes them successful.

Roma Market Analysis
Where Rome’s Airbnb market actually clusters
Performance follows geography more than platform labels. The historic centre—Monti, Trevi, Pantheon-adjacent streets—commands the highest nightly rates and the stiffest competition. Trastevere and Vatican-side lanes attract walk-in tourism; Prati and the EUR district pull embassy, government, and conference guests with steadier mid-week nights. Outer zones near universities and hospitals can outperform on occupancy when the product suits longer stays, even if ADR looks modest on paper.
When bookings peak — and when they don’t
April through June and September through October are the reliable windows for leisure pricing. July and August stay busy for families despite heat; August softens in pockets where Romans leave town. Easter, Jubilee years, and major papal events can reprice entire weeks. Christmas and New Year city breaks are underrated relative to summer; cruise and airport-corridor stays add demand in well-connected suburbs outside the postcard centre.
Property formats that match guest demand
Compact one- and two-bedroom apartments within walking distance of sights suit international tourists and short city breaks. Larger homes near parks work for families; well-connected flats near Termini, Ostiense, or EUR suit business and multi-day conference guests. Buying a centro trophy asset without elevator access, legal clarity, or condo tolerance for guests is a common mistake—Rome rewards operational fit more than postcard views alone.
Before listing, plan for CIN registration, safety hardware, cedolare secca (or business tax if you cross apartment thresholds from 2026), and quarterly contributo di soggiorno. Rome has also signalled tighter local rules for tourist rentals; treat draft municipal measures as pending until formally adopted.
What Are the Airbnb Regulations in Roma?
Understanding local regulations is crucial for operating a successful Airbnb. Let's examine the compliance landscape and what you need to know about licensing requirements in Roma.
Current Regulatory Status
77% compliance indicates strict regulatory enforcement in this market.
If you list in Rome, work through this sequence before taking bookings:
- Obtain and display a CIN on the property and every platform listing (BDSR register).
- Install required safety equipment (gas/CO detection, portable extinguishers) under national rules tied to CIN issuance.
- Decide whether you operate a pure short let (affitto breve) or classified tourist accommodation—that choice drives SUAR, CIR, and condo notifications.
- Register for and remit contributo di soggiorno on qualifying overnight stays (Roma Capitale guidance).
- Confirm tax treatment (typically cedolare secca; business status if you exceed national apartment thresholds from 2026).
Roma Capitale: city procedures
Pure affitto breve without tourist-accommodation classification generally avoids a SUAR CIA, but CIN and tourist tax still apply. B&B and case vacanza paths require administrator notification; the city does not pre-clear condominium consent—disputes are usually civil. Non-business operators face unit caps within Rome (for example, a maximum of twocase vacanza in the city for non-business use—confirm current SUAR FAQs).
National law caps each contract at 30 days per stay but does not set a nationwide annual night limit on short lets. Lazio allows up to twoalloggio ad uso turistico units per comune with regional CIR (Ross1000) and municipal CIA when that classification applies.
Further reading: Roma Capitale FAQ on accommodation, Lazio RR 8/2015 art. 12-bis, DL 145/2023 (Normattiva), and Agenzia delle Entrate — short lets.
How Competitive is the Airbnb Market in Roma?
Analyze Competition →Understanding market competition is crucial for any potential Airbnb host. Let's examine the supply dynamics and what they mean for your investment strategy. The Roma Airbnb market currently features 24,538 active listings with an average occupancy rate of 70%. This represents a highly competitive market environment where strong demand supports premium pricing.
Airbnb Listings: Change Over Time
Strategic Entry into Roma Airbnb Market
Competitive Positioning
- Target premium segment with high-quality amenities
- Emphasize unique features and exceptional service
- Position as luxury accommodation option
Market Opportunities
- Strong demand supports premium pricing strategies
- Stable market provides predictable investment returns
- Established market with proven demand patterns
What Should You Charge for Your Airbnb in Roma?
Smart Pricing Tools →Pricing is one of the most critical decisions for Airbnb success. Let's analyze the current pricing landscape and help you understand what rates you can realistically charge.
The current average daily rate in Roma is €187 per night. However, pricing varies significantly based on property quality and location. Here's what different property tiers typically charge:
Airbnb Pricing Tiers in Roma
Premium(Top 10%) | High-performing(Top 25%) | Average(Median) | Budget(Bottom 25%) |
|---|---|---|---|
| €307per night | €202per night | €137per night | €95per night |
*Top locations, big properties, premium amenities | *Good property management, highly rated | *Standard market performance | *Basic properties, less desirable locations |
Is It Profitable to Start an Airbnb in Roma?
Investment Analysis →Understanding the profitability potential is crucial for any Airbnb investment decision. Let's analyze the revenue performance and profit margins in the Roma market to help you make informed financial decisions.