Airbnb Occupancy Rates in South Australia, Australia(July 2026)
- Annual revenue:A$58,632 per listing
- Occupancy:56%
- ADR:A$289
- Active listings:8,145
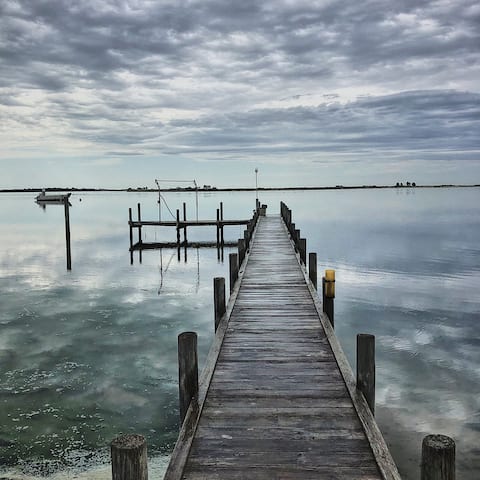
South Australia combines festival-city weekends in Adelaide, beach-front stays in Glenelg, and wine-country or island escapes in the Adelaide Hills and Kangaroo Island. Search demand is unusually concentrated on the state hub — guests often land on the South Australia page before drilling into a suburb or council area.
Hosts who win here match property type to Adelaide event weeks versus slow winter peninsula nights, not the state average alone.
South Australia Airbnb Market Map (July 2026)
South Australia Market Performance
Period: July 2025 - June 2026
Is Airbnb a Good Investment in South Australia?
YES — South Australia suits hosts who want lower entry prices than Sydney or Melbourne with credible wine, coast, and festival demand — if you buy in Adelaide or a named coastal town with proven named-market demand.
Who should invest
- Buyers targeting Adelaide (3,371 listings) for Fringe, AFL, and food-festival weekends.
- Hosts with beach houses near Glenelg or Fleurieu Peninsula towns with parking and summer outdoor space.
- Operators comfortable with longer drive times on Kangaroo Island for nature-led premium ADR.
Who should skip
- Investors expecting Melbourne-scale event density from a regional SA town with thin weekday demand.
- Hosts unwilling to register under SA short-term rental rules before taking paid bookings.
| Market | Avg revenue | Occupancy | Listings |
|---|---|---|---|
| South Australia | A$58,632 | 56% | 8,145 |
| Adelaide | A$62,769 | 63% | 3,371 |
| Victoria | A$58,518 | 53% | 32,402 |
| Western Australia | A$74,721 | 66% | 9,746 |
Get Live South Australia Market Intelligence
Discover detailed South Australia Airbnb Analytics and explore real-time market data to make accurate investment decisions.
Explore Real-time Analytics
How Often Will Your Airbnb Be Booked in South Australia?
View Demand Patterns →Occupancy rates directly impact your revenue potential. Understanding demand patterns helps you set realistic expectations and optimize your availability strategy.
The current average occupancy rate in South Australia is 56%, meaning properties are booked for about 203 nights per year. However, occupancy varies significantly based on property quality and management. Here's what you can expect:
Airbnb Occupancy Tiers in South Australia
Premium(Top 10%) | High-performing(Top 25%) | Average(Median) | Low-performing(Bottom 25%) |
|---|---|---|---|
| 91% | 74% | 49% | 22% |
*High desirability & optimized availability | *Good market fit & guest satisfaction | *Standard market performance | *Higher vacancy, optimization needed |
Seasonal Occupancy Patterns in South Australia
February, March
Highest demand and occupancy rates. Perfect for premium pricing strategies and maximizing revenue. Consider longer minimum stays and higher rates.
November, July
Moderate demand with balanced pricing opportunities. Good for attracting budget-conscious travelers while maintaining reasonable occupancy rates.
August, June
Lower demand requires competitive pricing and creative marketing. Focus on local events, extended stay discounts, and targeting specific traveler segments.
How Much Can You Earn with Airbnb in South Australia?
Calculate Earnings →One of the most common questions for potential Airbnb hosts in South Australia is about earning potential. Let's break down the revenue patterns and what you can realistically expect to earn.
Monthly Revenue Trends in South Australia
Best-in-class Airbnb properties (top 10%) in South Australia achieve around A$80,726 annually, while strong performers (top 25%) earn at least A$54,286. Typical properties generate about A$31,585 per year, and entry-level listings (bottom 25%) see earnings near A$12,401, often with room for optimization. Keep in mind, these are market averages—your actual earnings can be even higher depending on your property's location, bedrooms, guest capacity, and unique amenities.
Want to see how your listing could perform? Create a free account to unlock personalized analytics and explore exclusive insights in our app!
What Can You Learn from Top-Performing Airbnbs in South Australia?
View Top Performers →Studying successful properties provides valuable insights for your own Airbnb strategy. Here are the top-performing listings in South Australia and what makes them successful.
South Australia Market Analysis
Common assumptions
Many investors treat South Australia as “Adelaide only” and ignore coast and wine-country councils that outperform on revenue per listing outside festival weeks.
What the numbers show
Adelaide anchors short-stay demand, but Glenelg and Fleurieu Peninsula towns capture beach-week bookings without CBD body-corporate friction. Kangaroo Island trades lower occupancy for nature-led ADR when ferry access and cleaning logistics are solved.
Operational reality
Fringe and summer race weeks spike ADR in inner Adelaide; winter needs wine-country or hot-tub positioning. Regional listings live or die on reviews, fast Wi-Fi, and honest drive-time descriptions.
What Are the Airbnb Regulations in South Australia?
Understanding local regulations is crucial for operating a successful Airbnb. Let's examine the compliance landscape and what you need to know about licensing requirements in South Australia.
Current Regulatory Status
No properties have proper licensing in this market, indicating minimal regulatory enforcement.
Registration required: South Australia operates a short-term rental accommodation register — list before advertising to paying guests.
SA short-term rental registration — register via SA.GOV.AU short-term rental accommodation and keep the registration current.
Council local laws — some councils add caps or amenity standards; check Adelaide, Onkaparinga, or Fleurieu council pages before buying.
Strata & community titles — apartment buildings may restrict short stays in by-laws; obtain written approval from the corporation.
Safety standards — smoke alarms, pool fencing, and gas compliance apply to paying guests; maintain a guest information book.
Tax — declare income to the ATO; land tax and emergency services levy may apply depending on ownership structure.
Insurance — standard home policies often exclude commercial short-stay use; confirm public liability cover with your insurer.
How Competitive is the Airbnb Market in South Australia?
Analyze Competition →Understanding market competition is crucial for any potential Airbnb host. Let's examine the supply dynamics and what they mean for your investment strategy. The South Australia Airbnb market currently features 8,145 active listings with an average occupancy rate of 56%. This represents a highly competitive market environment where balanced supply and demand create opportunities for strategic positioning.
Airbnb Listings: Change Over Time
Strategic Entry into South Australia Airbnb Market
Competitive Positioning
- Focus on mid-market with competitive pricing
- Emphasize unique features and exceptional service
- Position as luxury accommodation option
Market Opportunities
- Strong demand supports premium pricing strategies
- Stable market provides predictable investment returns
- Established market with proven demand patterns
What Should You Charge for Your Airbnb in South Australia?
Smart Pricing Tools →Pricing is one of the most critical decisions for Airbnb success. Let's analyze the current pricing landscape and help you understand what rates you can realistically charge.
The current average daily rate in South Australia is A$289 per night. However, pricing varies significantly based on property quality and location. Here's what different property tiers typically charge:
Airbnb Pricing Tiers in South Australia
Premium(Top 10%) | High-performing(Top 25%) | Average(Median) | Budget(Bottom 25%) |
|---|---|---|---|
| A$461per night | A$320per night | A$226per night | A$140per night |
*Top locations, big properties, premium amenities | *Good property management, highly rated | *Standard market performance | *Basic properties, less desirable locations |
Is It Profitable to Start an Airbnb in South Australia?
Investment Analysis →Understanding the profitability potential is crucial for any Airbnb investment decision. Let's analyze the revenue performance and profit margins in the South Australia market to help you make informed financial decisions.
Revenue Performance
Profitability Factors
Which Areas in South Australia Are Most Profitable for Airbnb?
Explore All Areas →South Australia guest demand clusters on Adelaide and a ring of coastal or wine councils — not every outback shire.
Top performing towns & cities
Adelaide:3,371 listings at A$62,769 and 63% occupancy — metro hub for festivals, sport, and food tourism.
Glenelg:201 listings earning A$67,803 — tram-linked beach suburb with family summer demand.
Adelaide Hills:238 listings at A$74,089 — wine villages and cool-climate weekend cabins.
Kangaroo Island:428 listings at A$69,710 — wildlife tourism and premium coastal stays with ferry logistics.
Coastal yield pockets
Yorke Peninsula and Fleurieu councils add lower-priced beach houses with strong January occupancy. Competition is thinner than Glenelg but drive-time and supermarket access matter for family reviews.
Explore Other Markets in Australia
Airbnb Occupancy Rates in Surfers Paradise, Queensland
Gold Coast City, Australia
2,400 Active Listings