Airbnb Occupancy Rates in Brisbane, Queensland(October 2026)
Short-term rentals across Brisbane generate an average of A$65,199 per year, with a typical occupancy rate of 67% and daily rates averaging A$266. As of October 2026, there were 6,119 active listings on Airbnb from the CBD and inner suburbs to Moreton Bay, the Redcliffe peninsula, and nearby island getaways.
Brisbane combines subtropical lifestyle appeal with a growing corporate and events economy. Investors benefit from solid occupancy, more accessible entry pricing than Sydney, and a market that rewards inner-city apartments and river precincts as much as coastal day-trip destinations.
Brisbane Airbnb Market Map (October 2026)
Brisbane Market Performance
Australia average: 58% occupancy, A$333 per night.
Airbnb occupancy rates by city in AustraliaPeriod: October 2025 - September 2026
Is Airbnb a Good Investment in Brisbane?
YES, Brisbane is a strong east-coast investment market for investors seeking balance between yield, occupancy, and lower capital intensity than Sydney.
Brisbane sits between Melbourne and Sydney on average revenue while delivering healthy occupancy and a diversified guest mix—corporate travellers, domestic tourists, students, and event visitors. Unlike New South Wales, Queensland has no statewide night cap on short-term rentals, though planning approval and council rates categories still matter. The main homework is zone-by-zone planning under Brisbane City Plan, not a single permit register.
Market Comparison: Brisbane vs. Major Australian Markets
| Market | Avg Revenue | Occupancy | What stands out |
|---|---|---|---|
| Brisbane | A$65,199 | 67% | Growing corporate hub; no QLD night cap; varied inner-city and bay submarkets. |
| Sydney | A$81,843 | 68% | Highest revenue; 180-day non-hosted cap and mandatory NSW register. |
| Melbourne | A$59,054 | 60% | Largest listing pool; Victoria short-stay levy applies. |
| Gold Coast City | A$95,105 | 69% | Holiday-first market; higher average revenue, stronger leisure seasonality. |
| Perth | A$71,104 | 72% | High occupancy; resources-sector corporate demand. |
Strategic Advantages
- 2032 Olympics pipeline: Infrastructure and global exposure are lifting Brisbane’s profile with investors and travellers alike.
- Inner-city regeneration: Fortitude Valley, South Bank, and Howard Smith Wharves precincts sustain events, dining, and apartment demand.
- Corporate growth: Professional services, healthcare, and government employment support mid-week bookings beyond tourism.
- Regulatory flexibility: No state STR night cap; council focuses on planning zones and rates classification rather than a permit moratorium.
Get Live Brisbane Market Intelligence
Discover detailed Brisbane Airbnb Analytics and explore real-time market data to make accurate investment decisions.
Explore Real-time Analytics
How Often Will Your Airbnb Be Booked in Brisbane?
View Demand Patterns →Occupancy rates directly impact your revenue potential. Understanding demand patterns helps you set realistic expectations and optimize your availability strategy.
The current average occupancy rate in Brisbane is 67%, meaning properties are booked for about 245 nights per year. However, occupancy varies significantly based on property quality and management. Here's what you can expect:
Airbnb Occupancy Tiers in Brisbane
Premium(Top 10%) | High-performing(Top 25%) | Average(Median) | Low-performing(Bottom 25%) |
|---|---|---|---|
| 98% | 87% | 69% | 39% |
*High desirability & optimized availability | *Good market fit & guest satisfaction | *Standard market performance | *Higher vacancy, optimization needed |
Seasonal Occupancy Patterns in Brisbane
September, August
Highest demand and occupancy rates. Perfect for premium pricing strategies and maximizing revenue. Consider longer minimum stays and higher rates.
April, November
Moderate demand with balanced pricing opportunities. Good for attracting budget-conscious travelers while maintaining reasonable occupancy rates.
March, January
Lower demand requires competitive pricing and creative marketing. Focus on local events, extended stay discounts, and targeting specific traveler segments.
How Much Can You Earn with Airbnb in Brisbane?
Calculate Earnings →One of the most common questions for potential Airbnb hosts in Brisbane is about earning potential. Let's break down the revenue patterns and what you can realistically expect to earn.
Monthly Revenue Trends in Brisbane
Best-in-class Airbnb properties (top 10%) in Brisbane achieve around A$90,653 annually, while strong performers (top 25%) earn at least A$64,742. Typical properties generate about A$40,990 per year, and entry-level listings (bottom 25%) see earnings near A$18,110, often with room for optimization. Keep in mind, these are market averages—your actual earnings can be even higher depending on your property's location, bedrooms, guest capacity, and unique amenities.
Want to see how your listing could perform? Create a free account to unlock personalized analytics and explore exclusive insights in our app!
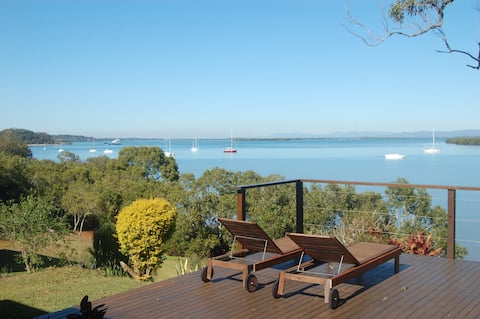
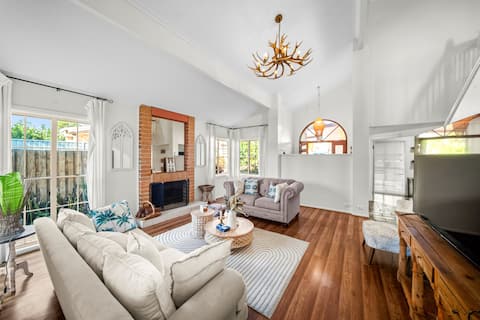
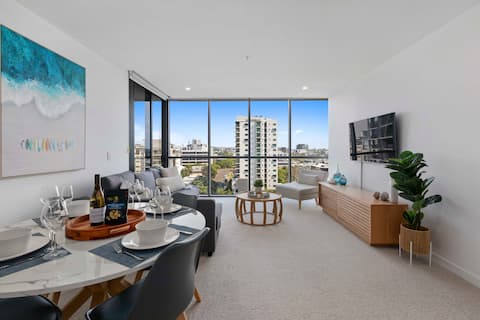
What Can You Learn from Top-Performing Airbnbs in Brisbane?
View Top Performers →Studying successful properties provides valuable insights for your own Airbnb strategy. Here are the top-performing listings in Brisbane and what makes them successful.
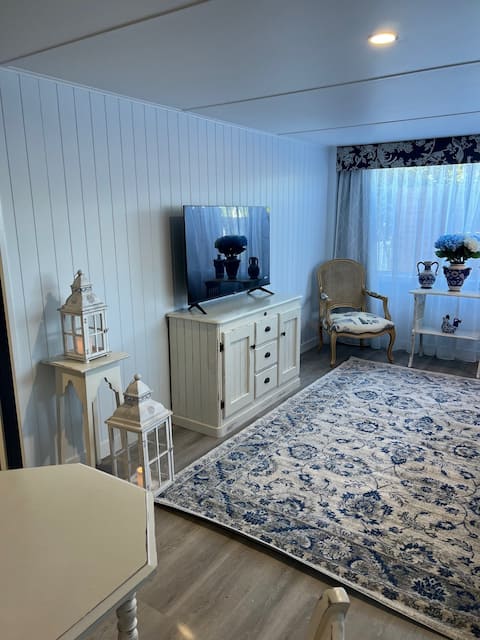
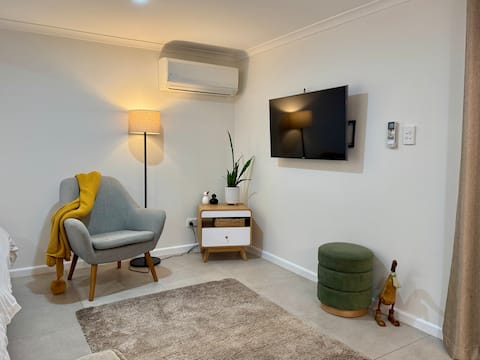
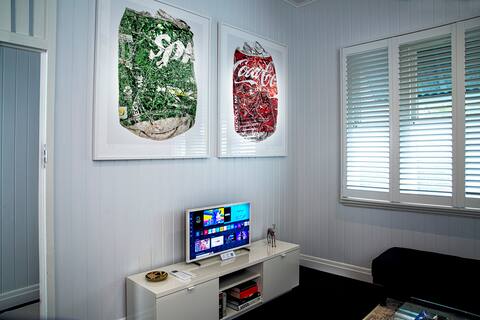
Brisbane Market Analysis
Brisbane Short-Term Rental Market Insights
Brisbane’s metropolitan area stretches from the CBD and inner-north terraces to bayside suburbs, Moreton Bay islands, and the Redcliffe peninsula. The market is smaller than Sydney or Melbourne but less saturated, with clear leaders in the CBD, South Brisbane, and Fortitude Valley corridor.
Demand Drivers
Domestic leisure travel dominates weekends, especially along the bay and on Stradbroke Island (Point Lookout). Corporate and conference demand fills weekdays around the CBD, South Bank, and RNA Showgrounds events. University semesters support mid-term stays in Toowong, St Lucia, and inner suburbs.
Major events—Brisbane Festival, Riverfire, State of Origin fixtures at Suncorp Stadium, and the build-up to the 2032 Olympics—create predictable occupancy spikes. Interstate visitors increasingly treat Brisbane as a standalone city break rather than only a Gold Coast add-on.
Seasonality
Subtropical winters (June–August) are mild and popular with southern-state visitors, making Brisbane less seasonal than Melbourne. Summer brings humidity and storm risk but strong bay and island demand. School holidays lift Redcliffe, Wynnum, and Moreton Island noticeably.
Investment Outlook
Brisbane favours well-located apartments in the CBD, South Brisbane, and Valley precincts for corporate and event guests, while bay and island properties capture premium whole-home leisure stays. Run a City Plan online check before buying—planning outcomes vary by zone. Budget for potential transitory accommodation council rates on high-utilisation whole-home listings.
What Are the Airbnb Regulations in Brisbane?
Understanding local regulations is crucial for operating a successful Airbnb. Let's examine the compliance landscape and what you need to know about licensing requirements in Brisbane.
Registration Numbers on Airbnb
None of the active Airbnb listings we tracked last month display a registration or license number.
This reflects what hosts publish on their Airbnb listings, not the local legal requirements. Always confirm them with local authorities.
Short-term rental accommodation in Brisbane is regulated primarily through Queensland planning law and Brisbane City Council planning and rates rules. There is no state STR register and no statewide night cap comparable to New South Wales.
Queensland Planning Framework
- Short-term accommodation is defined in the Planning Regulation 2017 as stays under three consecutive months for tourists or travellers.
- Whether development approval is required depends on the local planning scheme for your property’s zone—not a single statewide rule.
- The Queensland Government STR review recommends future registration and a code of conduct but does not support statewide night caps.
Brisbane City Council
- Council is not proceeding with a proposed 2025 short-stay permit local law—there is no Brisbane STR permit scheme at this time.
- Check City Plan online per address before listing; outcomes vary by suburb and zone.
- Rates categories: Whole-home listings used heavily for short stays may be rated as transitory accommodation (dwelling offered more than 60 days per year, each stay under 42 days). Shorter paid-guest stays use a different category. These thresholds affect council rates, not a maximum letting period. Notify Council when property use changes.
Strata Buildings
- Under the Body Corporate and Community Management Act, by-laws generally cannot prohibit short-term residential use on lots that may lawfully be used residentially—but bodies corporate can still enforce noise and behaviour rules.
Official Sources
What Should You Charge for Your Airbnb in Brisbane?
Smart Pricing Tools →Pricing is one of the most critical decisions for Airbnb success. Let's analyze the current pricing landscape and help you understand what rates you can realistically charge.
The current average daily rate in Brisbane is A$266 per night. However, pricing varies significantly based on property quality and location. Here's what different property tiers typically charge:
Airbnb Pricing Tiers in Brisbane
Premium(Top 10%) | High-performing(Top 25%) | Average(Median) | Budget(Bottom 25%) |
|---|---|---|---|
| A$441per night | A$303per night | A$221per night | A$158per night |
*Top locations, big properties, premium amenities | *Good property management, highly rated | *Standard market performance | *Basic properties, less desirable locations |
Is It Profitable to Start an Airbnb in Brisbane?
Investment Analysis →Understanding the profitability potential is crucial for any Airbnb investment decision. Let's analyze the revenue performance and profit margins in the Brisbane market to help you make informed financial decisions.
Revenue Performance
Profitability Factors
Which Areas in Brisbane Are Most Profitable for Airbnb?
Explore All Areas →Brisbane’s short-term rental performance splits between the inner-city river corridor, lifestyle suburbs, and Moreton Bay escapes. CBD and South Bank precincts drive volume; bay and island towns often lead on revenue per listing.
Top Performing Areas
Brisbane City: The CBD core averages A$70,906 in annual revenue with 71% occupancy—ideal for compact apartments targeting business and event guests.
South Brisbane: South Bank cultural precinct proximity delivers A$66,922 average revenue at 76% occupancy.
Fortitude Valley: Nightlife and dining drive A$65,331 average revenue with 71% occupancy across a large apartment inventory.
New Farm: James Street and river walks support A$71,949 average revenue at 65% occupancy.
Newstead: Gasworks and riverside dining yield A$86,668 average revenue with 75% occupancy.
Business & Corporate Hubs
Teneriffe: Renovated warehouses and river views achieve A$74,751 average revenue at 73% occupancy.
Kangaroo Point: Cliffs, Story Bridge views, and CBD access generate A$59,122 average revenue with 66% occupancy.
Toowong: University and office precinct demand supports A$58,806 average revenue at 71% occupancy.
Lifestyle & Creative Districts
West End: Markets and multicultural dining sustain A$61,731 average revenue with 70% occupancy.
Paddington: Given Terrace boutiques and village charm deliver A$66,512 average revenue at 70% occupancy.
Woolloongabba: Gabba stadium events and inner-south access yield A$60,282 average revenue with 72% occupancy.
Bay, Coast & Island Getaways
Moreton Island: Sand-island escapes command A$159,801 average revenue at 70% occupancy for premium whole-home stays.
Point Lookout: North Stradbroke Island surf and whale-watching drive A$96,162 average revenue with 56% occupancy.
Redcliffe: Peninsula beaches and weekend markets support A$61,114 average revenue at 65% occupancy.
Explore Other Markets in Australia
Airbnb Occupancy Rates in Surfers Paradise, Queensland
Gold Coast City, Australia
2,397 Active Listings
Airbnb Occupancy Rates in Byron Bay, New South Wales
Byron Shire Council, Australia
857 Active Listings