Airbnb Occupancy Rates in Parma, Emilia Romagna(June 2026)
Parma sells itself through taste—Parmigiano-Reggiano dairies, prosciutto routes, Barilla-era food heritage, Teatro Regio, and a compact centro where guests eat seriously before they sightsee. That positioning shows up in the data as €18,079 average annual revenue per listing, 58% occupancy, €85 per night, and 630 active Airbnb listings in June 2026: a market that rewards food-weekend operators and Motor Valley hub stays more than trophy-centre ADR chasers.
Treat Parma as Emilia’s gastronomy satellite—lower nightly rates than Bologna, but defensible occupancy when the unit is built for couples, food tourists, and two- to four-night culinary itineraries.
Parma Airbnb Market Map (June 2026)
Parma Market Performance
Period: June 2025 - May 2026
Is Airbnb a Good Investment in Parma?
YES — Parma fits investors who want Emilia-Romagna food tourism and university-week demand at lower acquisition ADR than Bologna, provided you complete SUAP, ROSS1000 CIR, CIN, Alloggiati Web, and imposta di soggiorno before scaling.
Parma is not Bologna’s revenue clone—it is a food-and-culture yield play where disciplined two-bedroom stock near the Duomo or rail links can stay booked when you price for CIBUS weeks and autumn opera, not Milan-style corporate tariffs.
| Market | Revenue | Occupancy | vs Parma |
|---|---|---|---|
| Parma | €18,079 | 58% | Baseline: food tourism, moderate ADR |
| Bologna | €35,453 | 67% | Higher scale and ADR; Fiera & university hub |
| Modena | €23,442 | 58% | Motor Valley peer; similar inland profile |
| Rimini | €24,980 | 52% | Adriatic beach volume; summer-led curve |
Bologna still leads the Emilia comparison on per-listing revenue (€35,453, 67%) with far deeper inventory—useful if you need conference calendars and AV weekend liquidity. Parma trades that headline for lower centro entry prices and a guest mix anchored in gastronomy, Teatro Regio, and Verdi-season weekends. Modena (€23,442, 58%) competes for the same Motor Valley and balsamic itineraries; differentiate with Parma’s UNESCO food identity and rail links toward Milan and the Ligurian coast. Rimini (€24,980, 52%) wins summer beach nights Parma cannot replicate—inland stock should underwrite shoulder food tourism and autumn culture, not July Adriatic assumptions. Compliance is procedural across Emilia-Romagna: SCIA or comunicazione via SUAP, CIR in ROSS1000, CIN on BDSR, and imposta di soggiorno on the municipal portal—not a national night cap.
Get Live Parma Market Intelligence
Discover detailed Parma Airbnb Analytics and explore real-time market data to make accurate investment decisions.
Explore Real-time Analytics
How Often Will Your Airbnb Be Booked in Parma?
View Demand Patterns →Occupancy rates directly impact your revenue potential. Understanding demand patterns helps you set realistic expectations and optimize your availability strategy.
The current average occupancy rate in Parma is 58%, meaning properties are booked for about 213 nights per year. However, occupancy varies significantly based on property quality and management. Here's what you can expect:
Airbnb Occupancy Tiers in Parma
Premium(Top 10%) | High-performing(Top 25%) | Average(Median) | Low-performing(Bottom 25%) |
|---|---|---|---|
| 89% | 75% | 55% | 29% |
*High desirability & optimized availability | *Good market fit & guest satisfaction | *Standard market performance | *Higher vacancy, optimization needed |
Seasonal Occupancy Patterns in Parma
March, April
Highest demand and occupancy rates. Perfect for premium pricing strategies and maximizing revenue. Consider longer minimum stays and higher rates.
July, August
Moderate demand with balanced pricing opportunities. Good for attracting budget-conscious travelers while maintaining reasonable occupancy rates.
December, November
Lower demand requires competitive pricing and creative marketing. Focus on local events, extended stay discounts, and targeting specific traveler segments.
How Much Can You Earn with Airbnb in Parma?
Calculate Earnings →One of the most common questions for potential Airbnb hosts in Parma is about earning potential. Let's break down the revenue patterns and what you can realistically expect to earn.
Monthly Revenue Trends in Parma
Best-in-class Airbnb properties (top 10%) in Parma achieve around €25,834 annually, while strong performers (top 25%) earn at least €18,944. Typical properties generate about €12,447 per year, and entry-level listings (bottom 25%) see earnings near €5,891, often with room for optimization. Keep in mind, these are market averages—your actual earnings can be even higher depending on your property's location, bedrooms, guest capacity, and unique amenities.
Want to see how your listing could perform? Create a free account to unlock personalized analytics and explore exclusive insights in our app!
What Can You Learn from Top-Performing Airbnbs in Parma?
View Top Performers →Studying successful properties provides valuable insights for your own Airbnb strategy. Here are the top-performing listings in Parma and what makes them successful.
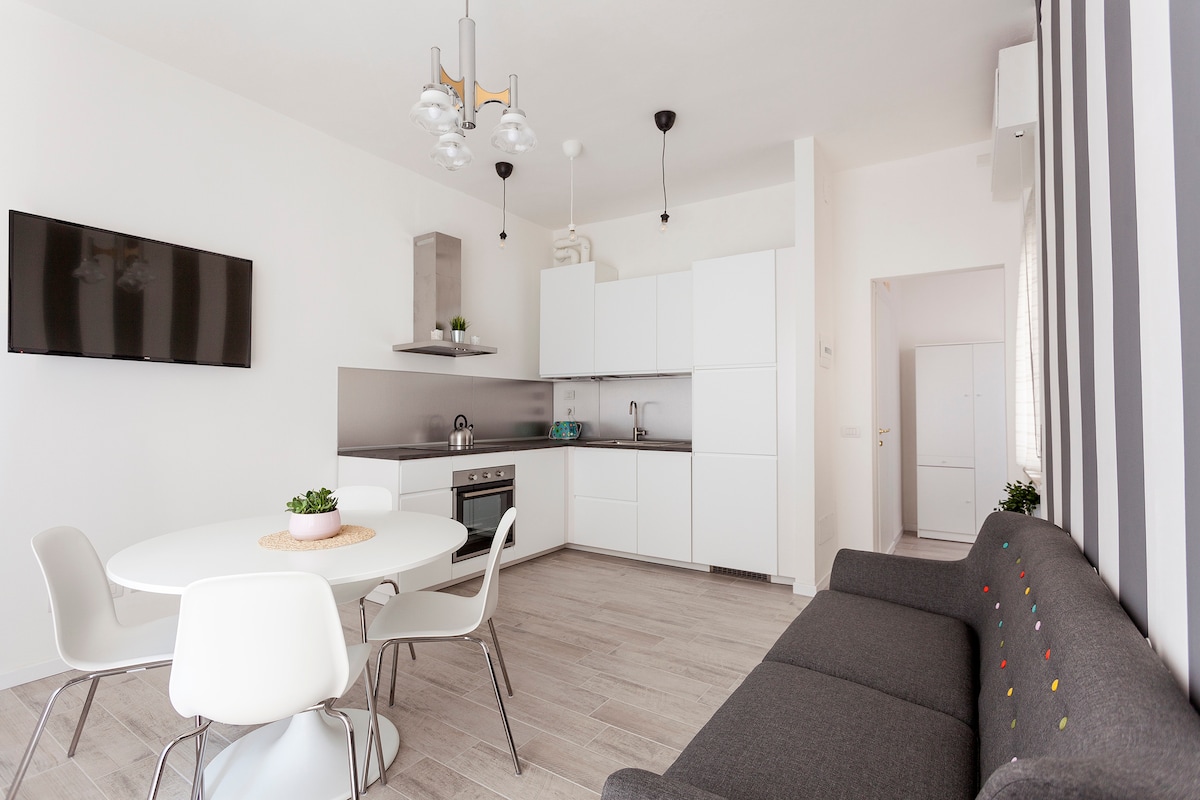
![Popular Airbnb listing: [Borgo Retto 2Suites] - Center at 5 min - WIFI A/C in Parma](https://a0.muscache.com/im/pictures/miso/Hosting-1285263916651609254/original/1574aed3-33d0-45a5-9fd4-7cc1da945313.jpeg)
Parma Market Analysis
What tends to work in Parma
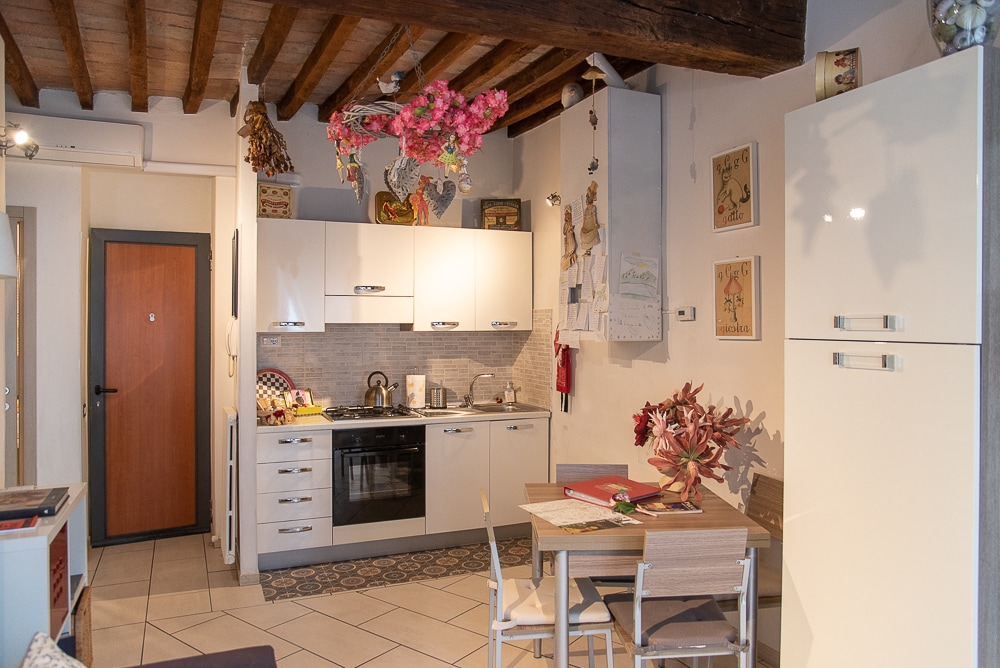
- Two-bedroom apartments within a 10–15 minute walk of Piazza Garibaldi, the Duomo, or Parma railway station—guests want dinner on foot, then a quiet bedroom after late osteria meals.
- Air-conditioned units with reliable Wi‑Fi and honest stair or parking disclosures; food tourists tolerate compact centro fabric if heat and luggage access are solved.
- Stock positioned for Motor Valley day trips (Modena, Maranello, Langhirano ham routes) with clear check-in windows and one dedicated parking or drop-off instruction.
- Opera and festival calendars (Teatro Regio, Verdi Festival shoulder weeks, CIBUS-related trade traffic) priced as event surcharges, not year-round base ADR.
- Ground-floor or elevator access when targeting older couples on parmesan-and-ham itineraries—reviews punish surprise stairs more than missing canal views.
What to avoid in Parma
- Trophy centro buys without condo tolerance or elevator access, modelled on Bologna Fiera ADR—Parma’s citywide €85 profile rewards operational fit over postcard piazza premiums.
- Single studios marketed as “cheap Bologna” without food-tourism positioning; guests who expect university-party or fair-week pricing will rate value poorly.
- Summer-only underwriting copied from Rimini beach curves—Parma is inland; July helps, but autumn food travel and spring trade weeks matter as much.
- Scaling past the non-business unit limits (regional guidance now points to two furnished tourist apartments for private hosts from 2026) without the imprenditoriale SUAP path and ROSS1000 reporting in place.
- Listing before CIR → CIN → imposta di soggiorno portal accreditation—Parma enforcement runs through tributi and SUAP channels even without a single “affitti brevi” landing page.
What Are the Airbnb Regulations in Parma?
Understanding local regulations is crucial for operating a successful Airbnb. Let's examine the compliance landscape and what you need to know about licensing requirements in Parma.
Current Regulatory Status
66% compliance indicates strict regulatory enforcement in this market.
| Requirement | Where to file | Link |
|---|---|---|
| Open or change tourist-rental activity (SCIA / comunicazione) | Comune di Parma SUAP Telematico | SUAP Telematico · SUAPE hub |
| Regional CIR and ISTAT tourist flows | ROSS1000 (Emilia-Romagna) | ROSS1000 |
| National CIN (display on ads and at entrance) | BDSR — Ministero del Turismo | BDSR portal · BDSR FAQ |
| Guest police register (within 24 hours) | Alloggiati Web — Questura di Parma | Questura Parma guidance · Alloggiati Web |
| Imposta di soggiorno collection & annual Modello 21 | Municipal IDS portal (SPID + CIR) | impostasoggiorno.comune.parma.it · IDS overview |
| Non-business furnished tourist apartment rules | Regione Emilia-Romagna (L.R. 16/2004 art. 12) | Appartamento uso turistico FAQ |
| Short-let urban planning (locazione breve) | Regione — L.R. 10/2025 | Disciplina locazione breve |
| Tax treatment (cedolare secca / business thresholds) | Agenzia delle Entrate | Locazioni brevi |
Parma spreads short-let compliance across SUAP, tributi, and regional/national registers rather than one municipal “Airbnb” page. Italy caps each contract at 30 days per stay; there is no uniform national annual night limit like France or Spain. After SUAP registration, obtain CIR via data flowing to ROSS1000, request CIN on BDSR, register guests on Alloggiati Web, and accredit the property on the imposta di soggiorno portal before taking paid bookings. L.R. 10/2025 may require an urbanistic “locazione breve” destination for new setups—confirm cadastral category and condominium rules before marketing. Municipal pages also explain CIR and CIN for hosts filing in Parma.
How Competitive is the Airbnb Market in Parma?
Analyze Competition →Understanding market competition is crucial for any potential Airbnb host. Let's examine the supply dynamics and what they mean for your investment strategy. The Parma Airbnb market currently features 630 active listings with an average occupancy rate of 58%. This represents a moderately competitive market environment where balanced supply and demand create opportunities for strategic positioning.
Airbnb Listings: Change Over Time
Strategic Entry into Parma Airbnb Market
Competitive Positioning
- Focus on mid-market with competitive pricing
- Balance quality and competitive pricing
- Focus on value-for-money positioning
Market Opportunities
- Strong demand supports premium pricing strategies
- Rapid market growth creates new opportunities
- Established market with proven demand patterns
What Should You Charge for Your Airbnb in Parma?
Smart Pricing Tools →Pricing is one of the most critical decisions for Airbnb success. Let's analyze the current pricing landscape and help you understand what rates you can realistically charge.
The current average daily rate in Parma is €85 per night. However, pricing varies significantly based on property quality and location. Here's what different property tiers typically charge:
Airbnb Pricing Tiers in Parma
Premium(Top 10%) | High-performing(Top 25%) | Average(Median) | Budget(Bottom 25%) |
|---|---|---|---|
| €124per night | €96per night | €75per night | €56per night |
*Top locations, big properties, premium amenities | *Good property management, highly rated | *Standard market performance | *Basic properties, less desirable locations |
Is It Profitable to Start an Airbnb in Parma?
Investment Analysis →Understanding the profitability potential is crucial for any Airbnb investment decision. Let's analyze the revenue performance and profit margins in the Parma market to help you make informed financial decisions.