Airbnb Occupancy Rates in Lucca, Toscana(June 2026)
Is Lucca still a short-term rental buy in June 2026 when Firenze hogs Tuscany headlines and Pisa competes on tower-day traffic?
Citywide averages say €35,973 annual revenue per listing, 56% occupancy, €176 per night, and 1,645 active listings—shaped by walled-centre walk-ups, Lucca Comics & Games compression, and Versilia beach spillover rather than Uffizi queues alone.
Operators who treat Lucca as “cheap Florence” without MOTouristOffice filing, CIN, and imposta di soggiorno on the municipal IDS portal often misprice October convention weeks and underestimate condominium tolerance inside the mura.
Lucca Airbnb Market Map (June 2026)
Lucca Market Performance
Period: June 2025 - May 2026
Is Airbnb a Good Investment in Lucca?
YES — Lucca rewards investors who want a walled Renaissance base with event-driven repricing and lower acquisition friction than central Florence, if you complete Comune communication via MOTouristOffice, regional LTN registration, CIN, and tourist-tax flows before scaling.
Versus art-city giants:Firenze still commands higher leisure ADR on monument density (€43,466, 65%); Roma offers national-scale inventory (€46,775, 69%). Lucca rarely wins pure revenue-per-listing against Florence on trophy streets, but it often beats Florence on operating calm—compact centro, strong Comics calendar, and guests who want quiet portico evenings without Arno crowds.
Versus Tuscan peers:Siena (€32,563, 56%) competes on Palio and medieval hill-town premiums with a smaller pool (1,001); Pisa (€27,125, 63%) skews to tower-and-airport day trips. Lucca’s edge is walled-city character plus Versilia access on 1,645 listings—underwrite Lucca Comics, Puccini festival windows, and honest parking inside the walls.
| City | Avg revenue | Occupancy | ADR |
|---|---|---|---|
| Lucca | €35,973 | 56% | €176 |
| Firenze | €43,466 | 65% | €183 |
| Siena | €32,563 | 56% | €158 |
| Pisa | €27,125 | 63% | €118 |
| Roma | €46,775 | 69% | €187 |
Get Live Lucca Market Intelligence
Discover detailed Lucca Airbnb Analytics and explore real-time market data to make accurate investment decisions.
Explore Real-time Analytics
How Often Will Your Airbnb Be Booked in Lucca?
View Demand Patterns →Occupancy rates directly impact your revenue potential. Understanding demand patterns helps you set realistic expectations and optimize your availability strategy.
The current average occupancy rate in Lucca is 56%, meaning properties are booked for about 204 nights per year. However, occupancy varies significantly based on property quality and management. Here's what you can expect:
Airbnb Occupancy Tiers in Lucca
Premium(Top 10%) | High-performing(Top 25%) | Average(Median) | Low-performing(Bottom 25%) |
|---|---|---|---|
| 92% | 68% | 45% | 20% |
*High desirability & optimized availability | *Good market fit & guest satisfaction | *Standard market performance | *Higher vacancy, optimization needed |
Seasonal Occupancy Patterns in Lucca
July, August
Highest demand and occupancy rates. Perfect for premium pricing strategies and maximizing revenue. Consider longer minimum stays and higher rates.
February, March
Moderate demand with balanced pricing opportunities. Good for attracting budget-conscious travelers while maintaining reasonable occupancy rates.
November, January
Lower demand requires competitive pricing and creative marketing. Focus on local events, extended stay discounts, and targeting specific traveler segments.
How Much Can You Earn with Airbnb in Lucca?
Calculate Earnings →One of the most common questions for potential Airbnb hosts in Lucca is about earning potential. Let's break down the revenue patterns and what you can realistically expect to earn.
Monthly Revenue Trends in Lucca
Best-in-class Airbnb properties (top 10%) in Lucca achieve around €47,211 annually, while strong performers (top 25%) earn at least €26,254. Typical properties generate about €14,243 per year, and entry-level listings (bottom 25%) see earnings near €5,403, often with room for optimization. Keep in mind, these are market averages—your actual earnings can be even higher depending on your property's location, bedrooms, guest capacity, and unique amenities.
Want to see how your listing could perform? Create a free account to unlock personalized analytics and explore exclusive insights in our app!
What Can You Learn from Top-Performing Airbnbs in Lucca?
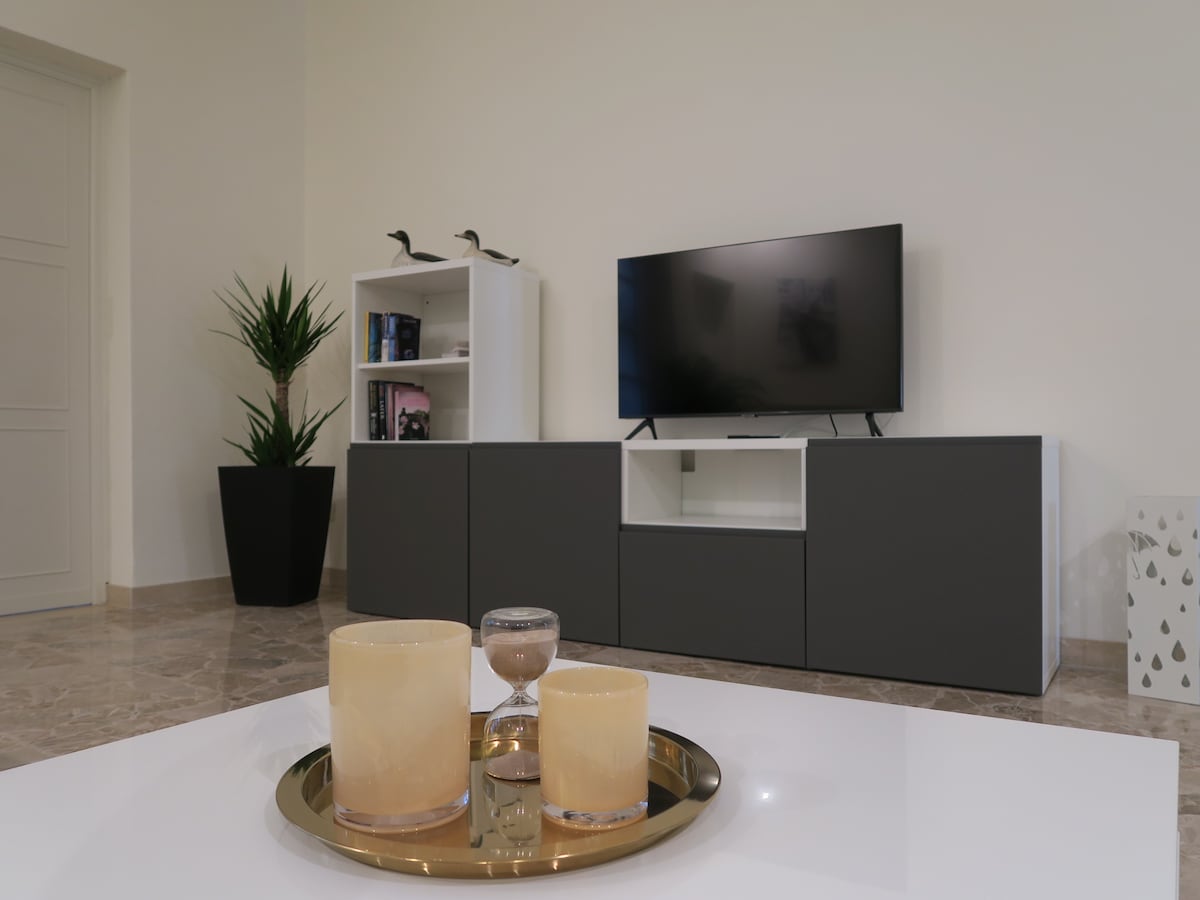
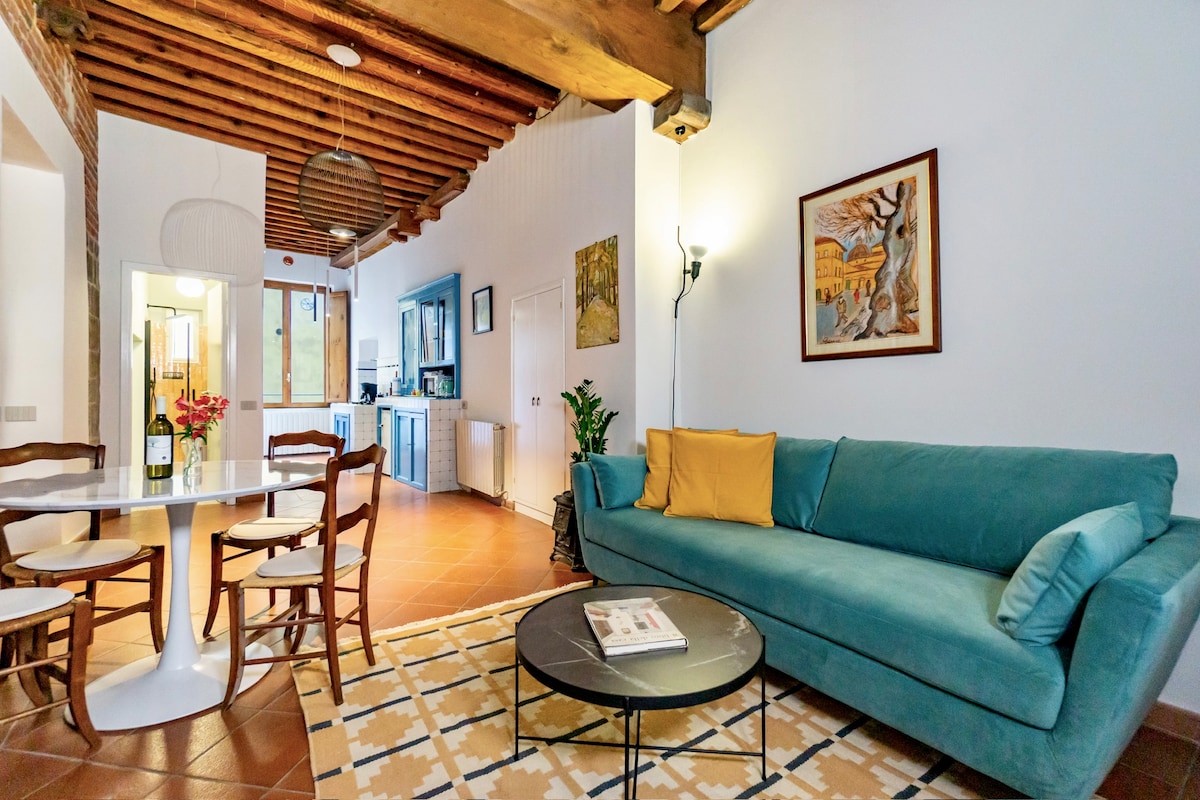
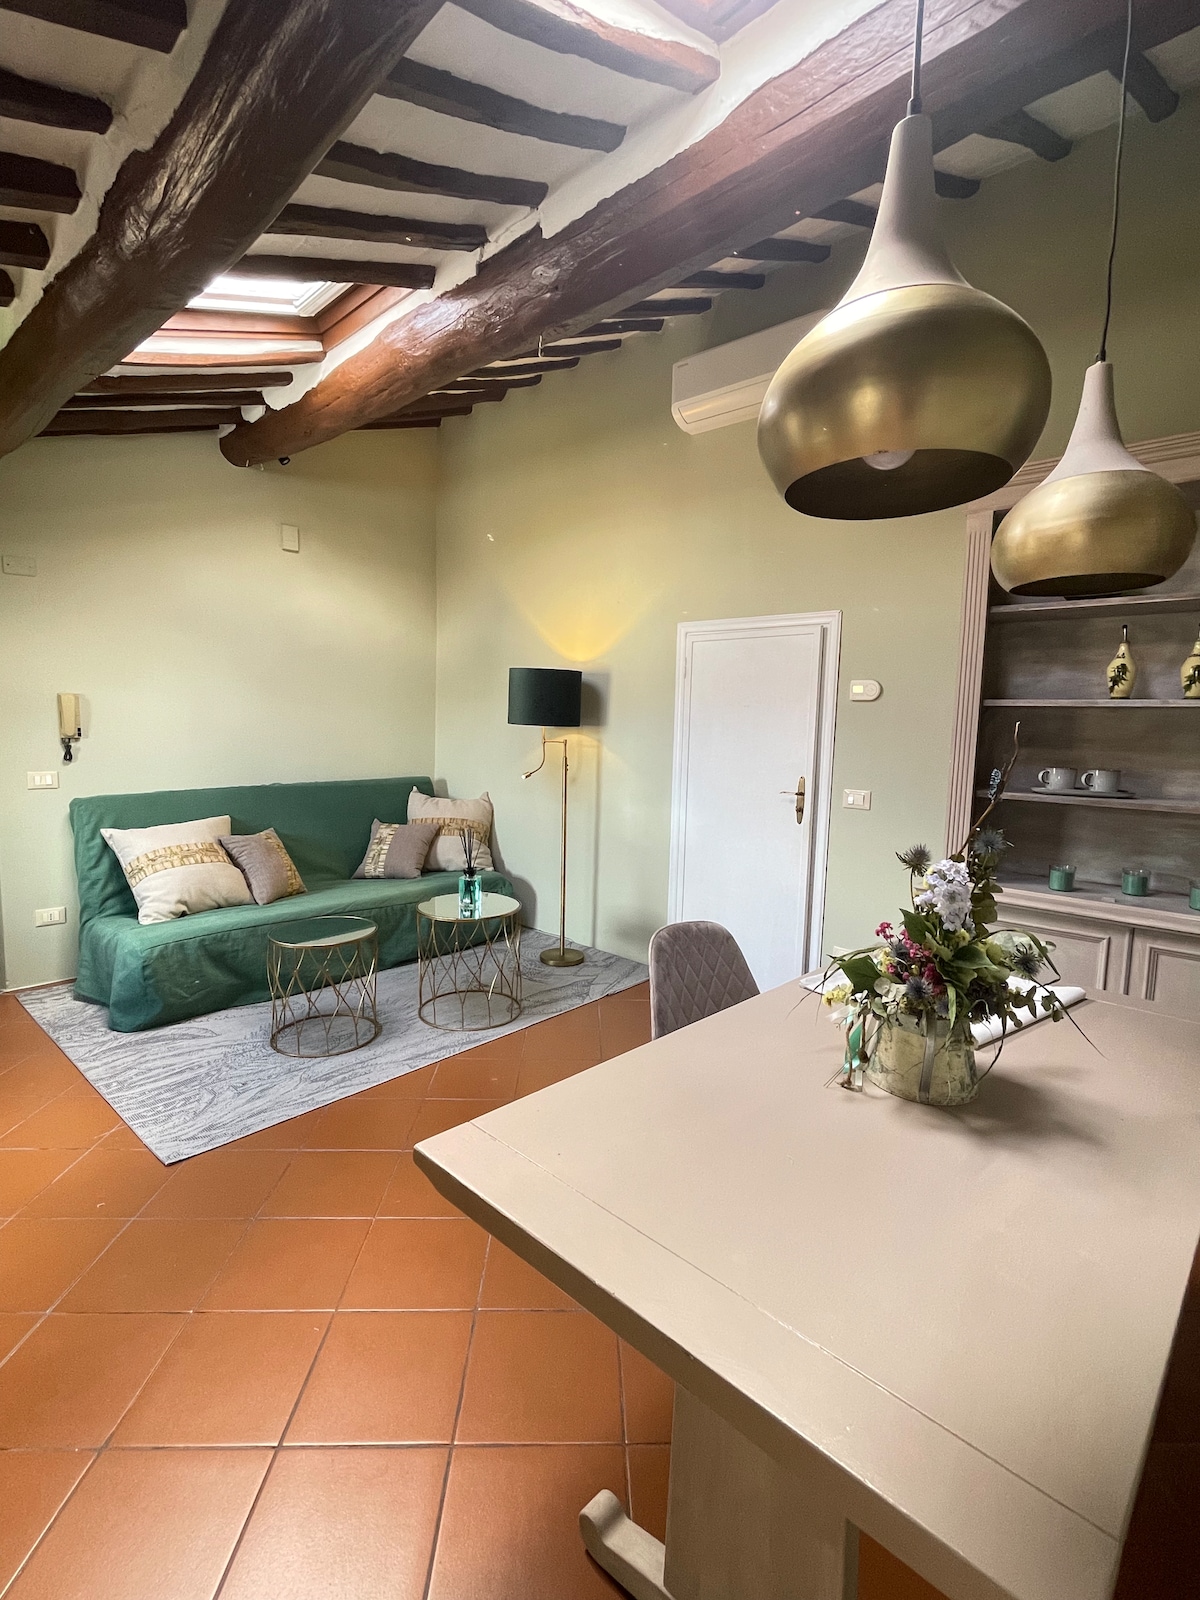
View Top Performers →Studying successful properties provides valuable insights for your own Airbnb strategy. Here are the top-performing listings in Lucca and what makes them successful.
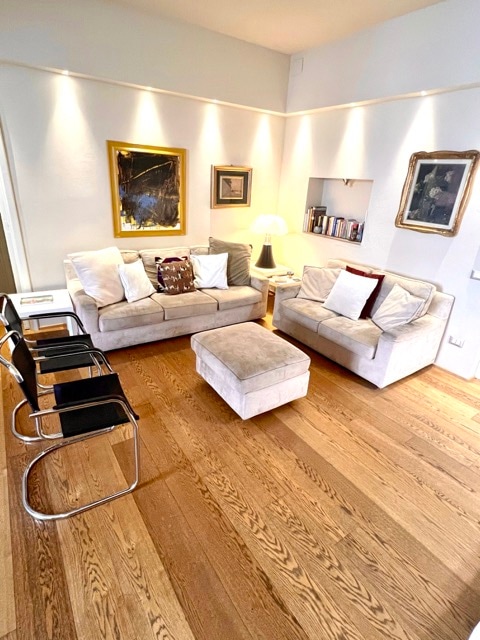
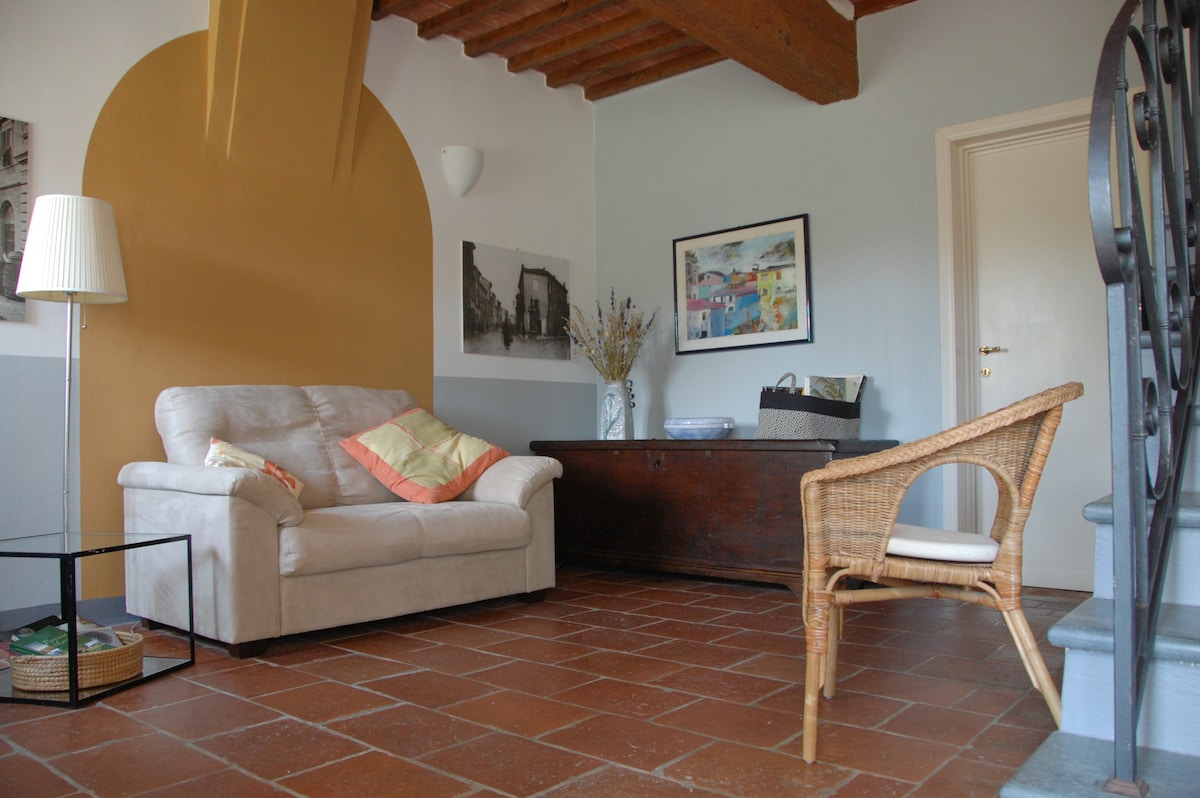
![Successful Airbnb property: ["Porta Elisa" + FREE Parking] in Lucca](https://a0.muscache.com/im/pictures/hosting/Hosting-U3RheVN1cHBseUxpc3Rpbmc6MTE2Njc4MzgzMjQyMDA1NTExMQ==/original/4335ef5c-5ea5-4d0d-8f77-35685df0c750.jpeg)

Lucca Market Analysis
Lucca’s walled-centre market at a glance
Performance clusters inside the mura (Piazza dell'Anfiteatro, San Michele, Duomo walks), Porta Elisa / station belts, and outer Lammari / Monte San Quirico stock where parking and Versilia day-trips matter. Guests book two- to five-night stays for Comics, opera at Teatro del Giglio, Garfagnana hikes, and Viareggio beach runs—not only a Florence day trip. Compact one- and two-bedroom flats with AC, dehumidification, and honest stair disclosures outperform trophy attics that hide summer heat.
When bookings peak — and when they ease
Late October–early November can reprice around Lucca Comics & Games; summer mixes wall walks with Versilia beaches; spring and autumn carry Puccini and food-tourism weekends. January softens outside events—use full-year 56%, not only convention screenshots.
Investor checklist before you list in Lucca
- File comunicazione alloggi locati via Comune — comunicazione and MOTouristOffice Toscana registration.
- Obtain CIN on BDSR and display it on every listing and at the entrance.
- Register guests on Alloggiati Web within 24 hours.
- Enable imposta di soggiorno per Comune guidance and the municipal IDS portal.
- If you run locazioni turistiche imprenditoriali (LTI), plan SCIA via SUAP from November 2024 alignment—see Regione Toscana — TUT.
- Confirm condominium rules inside the mura and cadastral category under L.R. 61/2024 before closing.
- Model revenue against Firenze and Siena on acquisition math—not only Lucca event peaks.
What Are the Airbnb Regulations in Lucca?
Understanding local regulations is crucial for operating a successful Airbnb. Let's examine the compliance landscape and what you need to know about licensing requirements in Lucca.
Current Regulatory Status
73% compliance indicates strict regulatory enforcement in this market.
| Requirement | Where to file | Link |
|---|---|---|
| Comunicazione alloggi locati | Comune + MOTouristOffice | Comune Lucca — comunicazione · Registrazione LT Toscana |
| CIN (national) | BDSR | BDSR |
| Guest register | Questura | Alloggiati Web |
| Imposta di soggiorno | Comune IDS | Imposta di soggiorno — informazioni |
| LTI / SCIA (if imprenditoriale) | SUAP | Impresa in un giorno |
Tuscany’s L.R. 61/2024 and locazioni brevi non imprenditoriali govern LTN registration, safety duties, and scaling paths. Italy caps each contract at 30 days; CIN is mandatory once registered (Ministry BDSR FAQ). Many private hosts use cedolare secca on up to two apartments (Agenzia delle Entrate — locazioni brevi); habitual operation of three or more units generally requires SCIA and business taxation under art. 13-ter, L. 191/2023.
How Competitive is the Airbnb Market in Lucca?
Analyze Competition →Understanding market competition is crucial for any potential Airbnb host. Let's examine the supply dynamics and what they mean for your investment strategy. The Lucca Airbnb market currently features 1,645 active listings with an average occupancy rate of 56%. This represents a highly competitive market environment where balanced supply and demand create opportunities for strategic positioning.
Airbnb Listings: Change Over Time
Strategic Entry into Lucca Airbnb Market
Competitive Positioning
- Focus on mid-market with competitive pricing
- Emphasize unique features and exceptional service
- Position as luxury accommodation option
Market Opportunities
- Strong demand supports premium pricing strategies
- Stable market provides predictable investment returns
- Established market with proven demand patterns
What Should You Charge for Your Airbnb in Lucca?
Smart Pricing Tools →Pricing is one of the most critical decisions for Airbnb success. Let's analyze the current pricing landscape and help you understand what rates you can realistically charge.
The current average daily rate in Lucca is €176 per night. However, pricing varies significantly based on property quality and location. Here's what different property tiers typically charge:
Airbnb Pricing Tiers in Lucca
Premium(Top 10%) | High-performing(Top 25%) | Average(Median) | Budget(Bottom 25%) |
|---|---|---|---|
| €250per night | €147per night | €99per night | €56per night |
*Top locations, big properties, premium amenities | *Good property management, highly rated | *Standard market performance | *Basic properties, less desirable locations |
Is It Profitable to Start an Airbnb in Lucca?
Investment Analysis →Understanding the profitability potential is crucial for any Airbnb investment decision. Let's analyze the revenue performance and profit margins in the Lucca market to help you make informed financial decisions.