Airbnb Occupancy Rates in Siena, Tuscany(October 2026)
The cliché that Siena is “Florence without the crowds” ignores Palio economics: twice each summer the Campo compresses demand into windows that repricing algorithms either capture or miss entirely.
On October 2026 data, citywide averages show €33,109 annual revenue per listing, 57% occupancy, €159 per night, and 1,065 active listings—shaped by contrade hill walks, Chianti day trips, and strict centro fabric rather than Uffizi queues.
Investors who import Firenze ADR onto Via di Città walk-ups without MOTouristOffice, CIN, and Ricestat flows often misprice Palio weeks and underestimate ZTL friction inside the walls.
Siena Airbnb Market Map (October 2026)
Siena Market Performance
Italy average: 60% occupancy, €167 per night.
Airbnb occupancy rates by city in ItalyPeriod: October 2025 - September 2026
Is Airbnb a Good Investment in Siena?
YES — Siena rewards operators who price medieval-hill scarcity and Palio calendars with Tuscany compliance discipline, not year-round museum throughput like Roma.
| Market | Revenue | Occupancy | vs Siena |
|---|---|---|---|
| Siena | €33,109 | 57% | Baseline: Palio + Chianti hill town |
| Firenze | €43,385 | 66% | Higher leisure ADR; deeper pool |
| Lucca | €36,479 | 57% | Walled city; Comics/fair spikes |
| Pisa | €27,508 | 64% | Tower/airport day-trip skew |
| Roma | €47,883 | 70% | National-scale inventory |
Firenze (€43,385, 66%) still leads Tuscan leisure ADR on monument density; Siena competes on scarcity inside the walls with only 1,065 listings—far thinner than Lucca (1,745) or Pisa (1,107). Winning here means Palio-aware pricing, honest hill climbs, and MOTouristOffice + Ricestat compliance—not assuming every medieval town equals Florence revenue.
Get Live Siena Market Intelligence
Discover detailed Siena Airbnb Analytics and explore real-time market data to make accurate investment decisions.
Explore Real-time Analytics
How Often Will Your Airbnb Be Booked in Siena?
View Demand Patterns →Occupancy rates directly impact your revenue potential. Understanding demand patterns helps you set realistic expectations and optimize your availability strategy.
The current average occupancy rate in Siena is 57%, meaning properties are booked for about 208 nights per year. However, occupancy varies significantly based on property quality and management. Here's what you can expect:
Airbnb Occupancy Tiers in Siena
Premium(Top 10%) | High-performing(Top 25%) | Average(Median) | Low-performing(Bottom 25%) |
|---|---|---|---|
| 89% | 72% | 51% | 28% |
*High desirability & optimized availability | *Good market fit & guest satisfaction | *Standard market performance | *Higher vacancy, optimization needed |
Seasonal Occupancy Patterns in Siena
June, May
Highest demand and occupancy rates. Perfect for premium pricing strategies and maximizing revenue. Consider longer minimum stays and higher rates.
March, February
Moderate demand with balanced pricing opportunities. Good for attracting budget-conscious travelers while maintaining reasonable occupancy rates.
January, December
Lower demand requires competitive pricing and creative marketing. Focus on local events, extended stay discounts, and targeting specific traveler segments.
How Much Can You Earn with Airbnb in Siena?
Calculate Earnings →One of the most common questions for potential Airbnb hosts in Siena is about earning potential. Let's break down the revenue patterns and what you can realistically expect to earn.
Monthly Revenue Trends in Siena
Best-in-class Airbnb properties (top 10%) in Siena achieve around €46,695 annually, while strong performers (top 25%) earn at least €28,589. Typical properties generate about €17,159 per year, and entry-level listings (bottom 25%) see earnings near €8,038, often with room for optimization. Keep in mind, these are market averages—your actual earnings can be even higher depending on your property's location, bedrooms, guest capacity, and unique amenities.
Want to see how your listing could perform? Create a free account to unlock personalized analytics and explore exclusive insights in our app!
What Can You Learn from Top-Performing Airbnbs in Siena?
View Top Performers →Studying successful properties provides valuable insights for your own Airbnb strategy. Here are the top-performing listings in Siena and what makes them successful.
![Popular Airbnb listing: [NEW!] Renovated, within walking distance of the center! in Siena](https://a0.muscache.com/im/pictures/hosting/Hosting-1700874210332305571/original/9772507f-5199-407c-b3db-d598ae5ef9f0.jpeg?im_w=480)
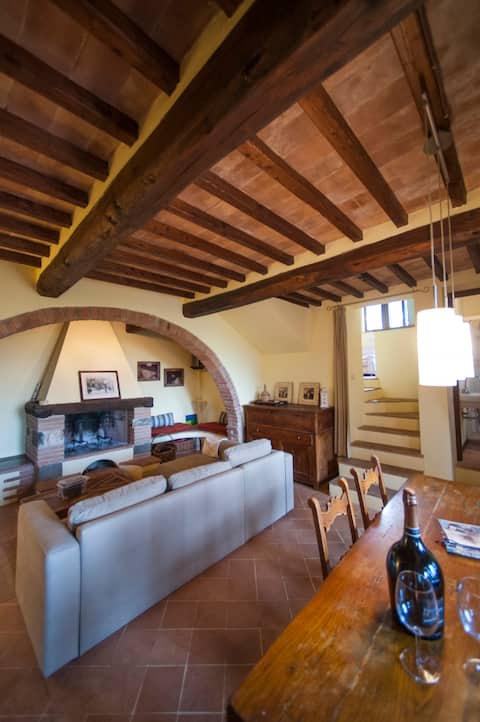
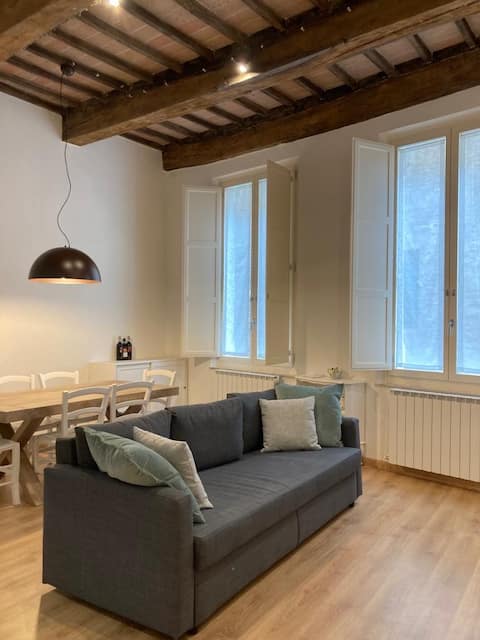
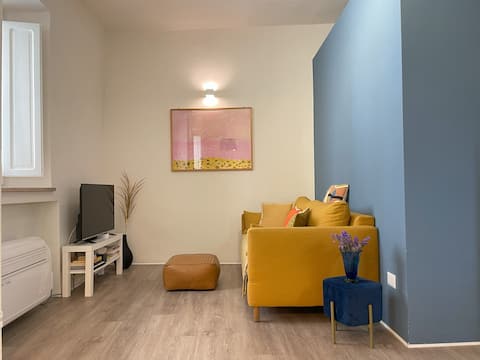
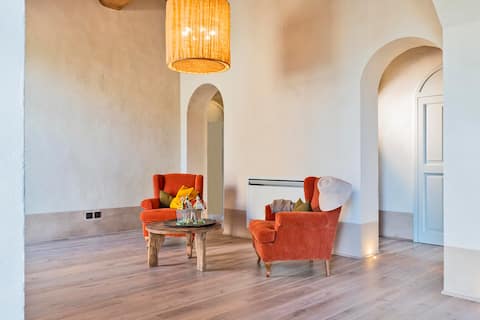
Siena Market Analysis
Who books Siena—and for how long?
Palio pilgrims and contrada culture tourists book tight windows around 2 July and 16 August—minimum stays and cancellation policies should reflect that volatility. Chianti and Val d'Orcia road-trippers use Siena as a two- to four-night base when parking and luggage access are clear. Italian weekenders arrive for Piazza del Campo, Duomo, and winter mercato atmosphere when heating in stone flats is honest.
What drives ADR inside the walls?
Elevator or ground-floor access, AC, and dehumidification separate bookable stock from trophy attics. Contrada proximity matters for Palio weeks but can mean noise other months—disclose both. Compare with Lucca flat centro walks: Siena ADR is hill-and-scarcity weighted, not beach spillover.
What should you buy?
One- and two-bedroom flats within walking distance of Campo with documented condominium tolerance for tourists. Avoid car-dependent suburbs without a story when guests expect pedestrian medieval Siena. Underwrite January–February softness—citywide 57% blends Palio peaks with quiet winters.
What Are the Airbnb Regulations in Siena?
Understanding local regulations is crucial for operating a successful Airbnb. Let's examine the compliance landscape and what you need to know about licensing requirements in Siena.
Registration Numbers on Airbnb
68% of the active Airbnb listings we tracked last month display a registration or license number.
This reflects what hosts publish on their Airbnb listings, not the local legal requirements. Always confirm them with local authorities.
Before listing
File LTN comunicazione via MOTouristOffice Siena and read Comune — richiesta CIN plus testo unico turismo. Classify non-imprenditorial LTN vs LTI requiring SCIA via SUAP from November 2024 alignment.
First booking
Obtain CIN on BDSR and display it on every listing and at the entrance (Ministry BDSR FAQ). Register tourist flows on Ricestat and guests on Alloggiati Web within 24 hours. Enable imposta di soggiorno per municipal schedules.
Ongoing compliance
Follow L.R. 61/2024 and the TUT implementation. Italy caps contracts at 30 days; many private hosts use cedolare secca on up to two apartments (Agenzia delle Entrate — locazioni brevi); three or more units habitually require SCIA and business taxation under art. 13-ter, L. 191/2023.
What Should You Charge for Your Airbnb in Siena?
Smart Pricing Tools →Pricing is one of the most critical decisions for Airbnb success. Let's analyze the current pricing landscape and help you understand what rates you can realistically charge.
The current average daily rate in Siena is €159 per night. However, pricing varies significantly based on property quality and location. Here's what different property tiers typically charge:
Airbnb Pricing Tiers in Siena
Premium(Top 10%) | High-performing(Top 25%) | Average(Median) | Budget(Bottom 25%) |
|---|---|---|---|
| €251per night | €155per night | €109per night | €70per night |
*Top locations, big properties, premium amenities | *Good property management, highly rated | *Standard market performance | *Basic properties, less desirable locations |
Is It Profitable to Start an Airbnb in Siena?
Investment Analysis →Understanding the profitability potential is crucial for any Airbnb investment decision. Let's analyze the revenue performance and profit margins in the Siena market to help you make informed financial decisions.